Zip Codes with the Highest Percentage of Population Employed in Health Care & Social Assistance in Danville, IL
RELATED REPORTS & OPTIONS
Health Care & Social Assistance
Danville
Compare Zip Codes
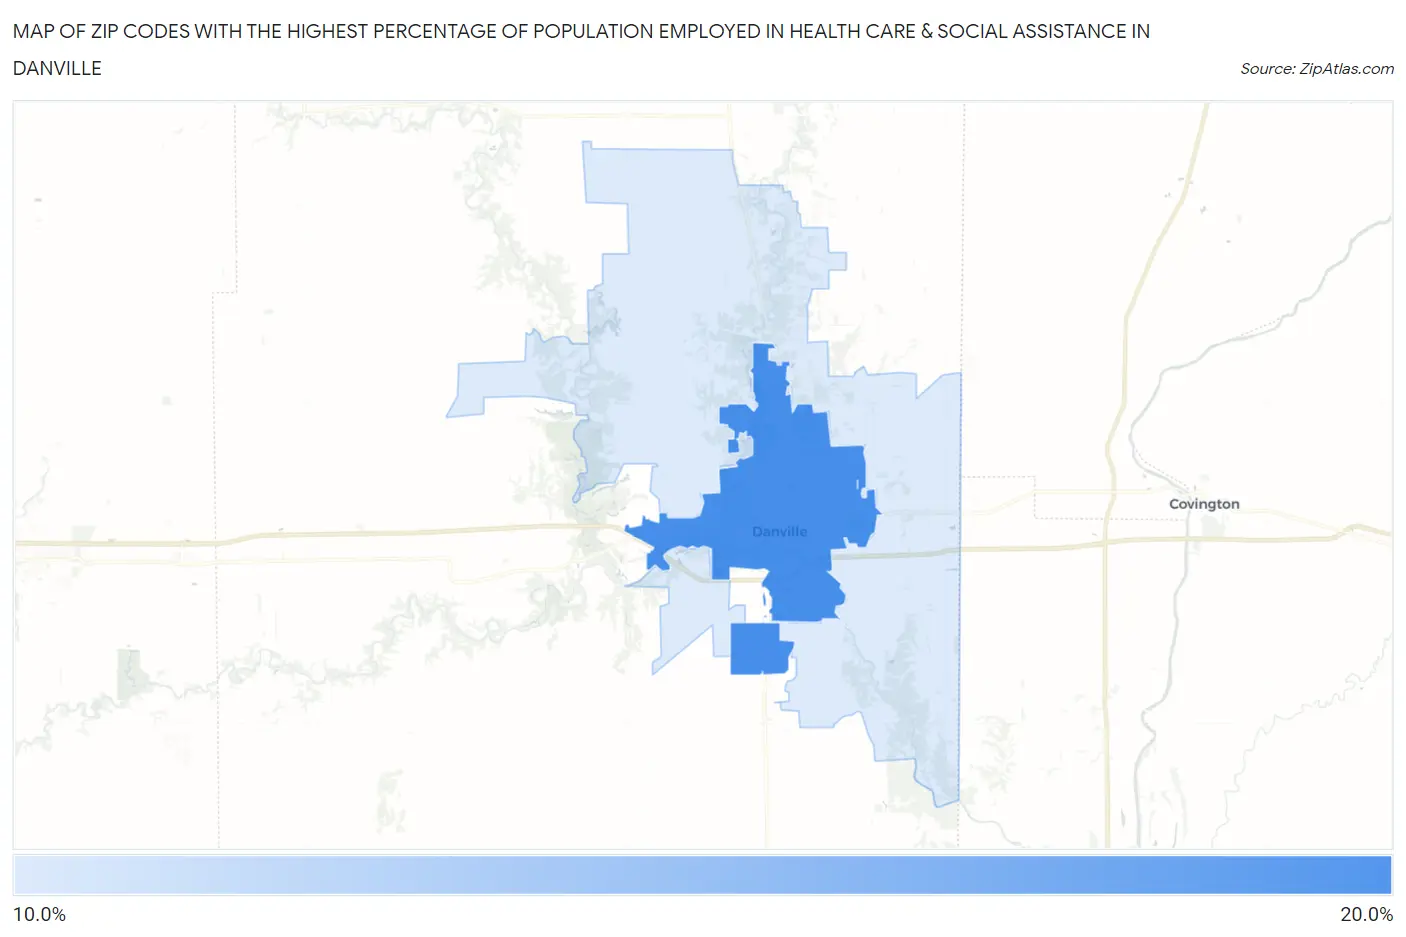
Map of Zip Codes with the Highest Percentage of Population Employed in Health Care & Social Assistance in Danville
0.0%
20.0%
Zip Codes with the Highest Percentage of Population Employed in Health Care & Social Assistance in Danville, IL
| Zip Code | % Employed | vs State | vs National | |
| 1. | 61832 | 17.0% | 13.8%(+3.23)#361 | 13.9%(+3.06)#7,725 |
| 2. | 61834 | 16.1% | 13.8%(+2.35)#436 | 13.9%(+2.18)#9,283 |
1
Common Questions
What are the Top Zip Codes with the Highest Percentage of Population Employed in Health Care & Social Assistance in Danville, IL?
Top Zip Codes with the Highest Percentage of Population Employed in Health Care & Social Assistance in Danville, IL are:
What zip code has the Highest Percentage of Population Employed in Health Care & Social Assistance in Danville, IL?
61832 has the Highest Percentage of Population Employed in Health Care & Social Assistance in Danville, IL with 17.0%.
What is the Percentage of Population Employed in Health Care & Social Assistance in Danville, IL?
Percentage of Population Employed in Health Care & Social Assistance in Danville is 17.4%.
What is the Percentage of Population Employed in Health Care & Social Assistance in Illinois?
Percentage of Population Employed in Health Care & Social Assistance in Illinois is 13.8%.
What is the Percentage of Population Employed in Health Care & Social Assistance in the United States?
Percentage of Population Employed in Health Care & Social Assistance in the United States is 13.9%.