Zip Codes with the Highest Percentage of Black / African American Population in Danville, IL
RELATED REPORTS & OPTIONS
Black / African American
Danville
Compare Zip Codes
Map of Zip Codes with the Highest Percentage of Black / African American Population in Danville
11.7%
27.5%
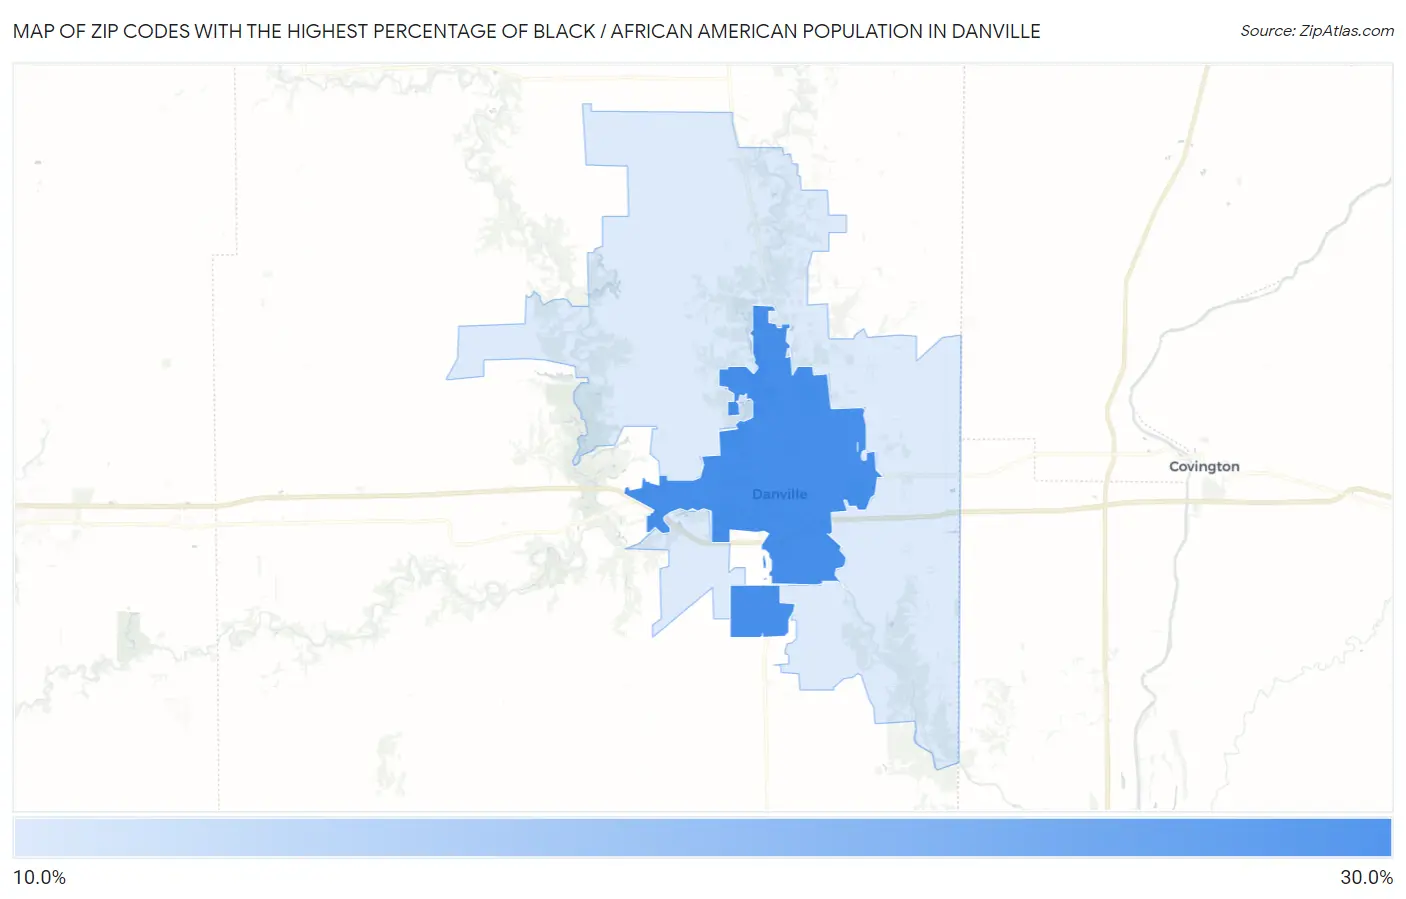
Zip Codes with the Highest Percentage of Black / African American Population in Danville, IL
| Zip Code | Black / African American | vs State | vs National | |
| 1. | 61832 | 27.5% | 13.9%(+13.6)#75 | 12.5%(+15.1)#2,896 |
| 2. | 61834 | 11.7% | 13.9%(-2.23)#167 | 12.5%(-0.793)#5,989 |
1
Common Questions
What are the Top Zip Codes with the Highest Percentage of Black / African American Population in Danville, IL?
Top Zip Codes with the Highest Percentage of Black / African American Population in Danville, IL are:
What zip code has the Highest Percentage of Black / African American Population in Danville, IL?
61832 has the Highest Percentage of Black / African American Population in Danville, IL with 27.5%.
What is the Percentage of Black / African American Population in Danville, IL?
Percentage of Black / African American Population in Danville is 33.1%.
What is the Percentage of Black / African American Population in Illinois?
Percentage of Black / African American Population in Illinois is 13.9%.
What is the Percentage of Black / African American Population in the United States?
Percentage of Black / African American Population in the United States is 12.5%.