Zip Codes with the Highest Percentage of Population Employed in Agriculture, Fishing & Hunting in Crystal Lake, IL
RELATED REPORTS & OPTIONS
Agriculture, Fishing & Hunting
Crystal Lake
Compare Zip Codes
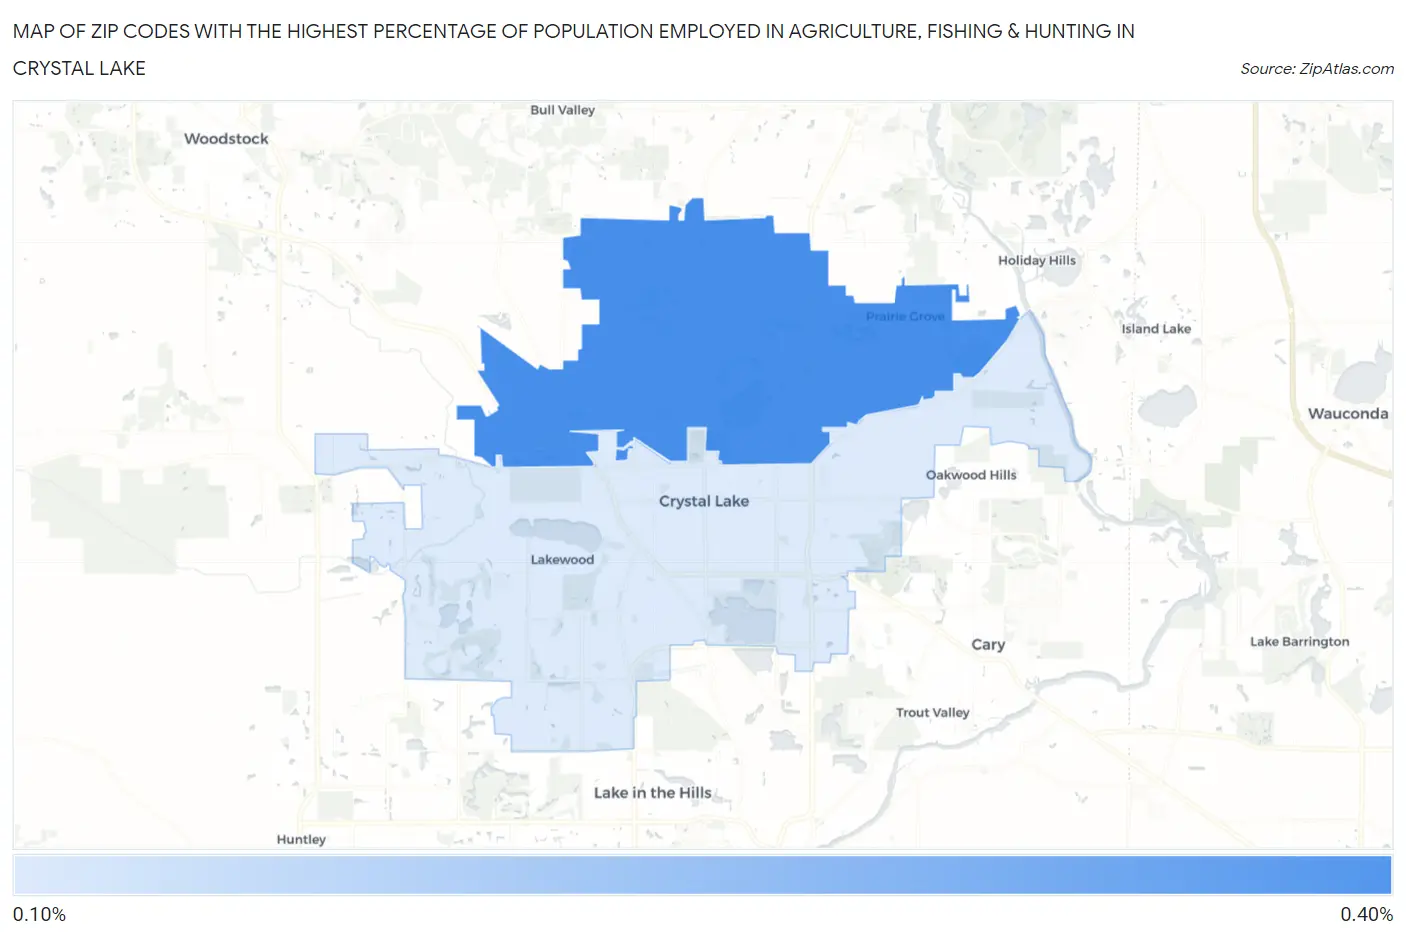
Map of Zip Codes with the Highest Percentage of Population Employed in Agriculture, Fishing & Hunting in Crystal Lake
0.0%
0.40%
Zip Codes with the Highest Percentage of Population Employed in Agriculture, Fishing & Hunting in Crystal Lake, IL
| Zip Code | % Employed | vs State | vs National | |
| 1. | 60012 | 0.37% | 0.88%(-0.510)#946 | 1.2%(-0.831)#20,459 |
| 2. | 60014 | 0.19% | 0.88%(-0.684)#1,031 | 1.2%(-1.01)#22,440 |
1
Common Questions
What are the Top Zip Codes with the Highest Percentage of Population Employed in Agriculture, Fishing & Hunting in Crystal Lake, IL?
Top Zip Codes with the Highest Percentage of Population Employed in Agriculture, Fishing & Hunting in Crystal Lake, IL are:
What zip code has the Highest Percentage of Population Employed in Agriculture, Fishing & Hunting in Crystal Lake, IL?
60012 has the Highest Percentage of Population Employed in Agriculture, Fishing & Hunting in Crystal Lake, IL with 0.37%.
What is the Percentage of Population Employed in Agriculture, Fishing & Hunting in Crystal Lake, IL?
Percentage of Population Employed in Agriculture, Fishing & Hunting in Crystal Lake is 0.23%.
What is the Percentage of Population Employed in Agriculture, Fishing & Hunting in Illinois?
Percentage of Population Employed in Agriculture, Fishing & Hunting in Illinois is 0.88%.
What is the Percentage of Population Employed in Agriculture, Fishing & Hunting in the United States?
Percentage of Population Employed in Agriculture, Fishing & Hunting in the United States is 1.2%.