Cities with the Highest Percentage of Population Employed in Transportation in Illinois
RELATED REPORTS & OPTIONS
Transportation
Illinois
Compare Cities
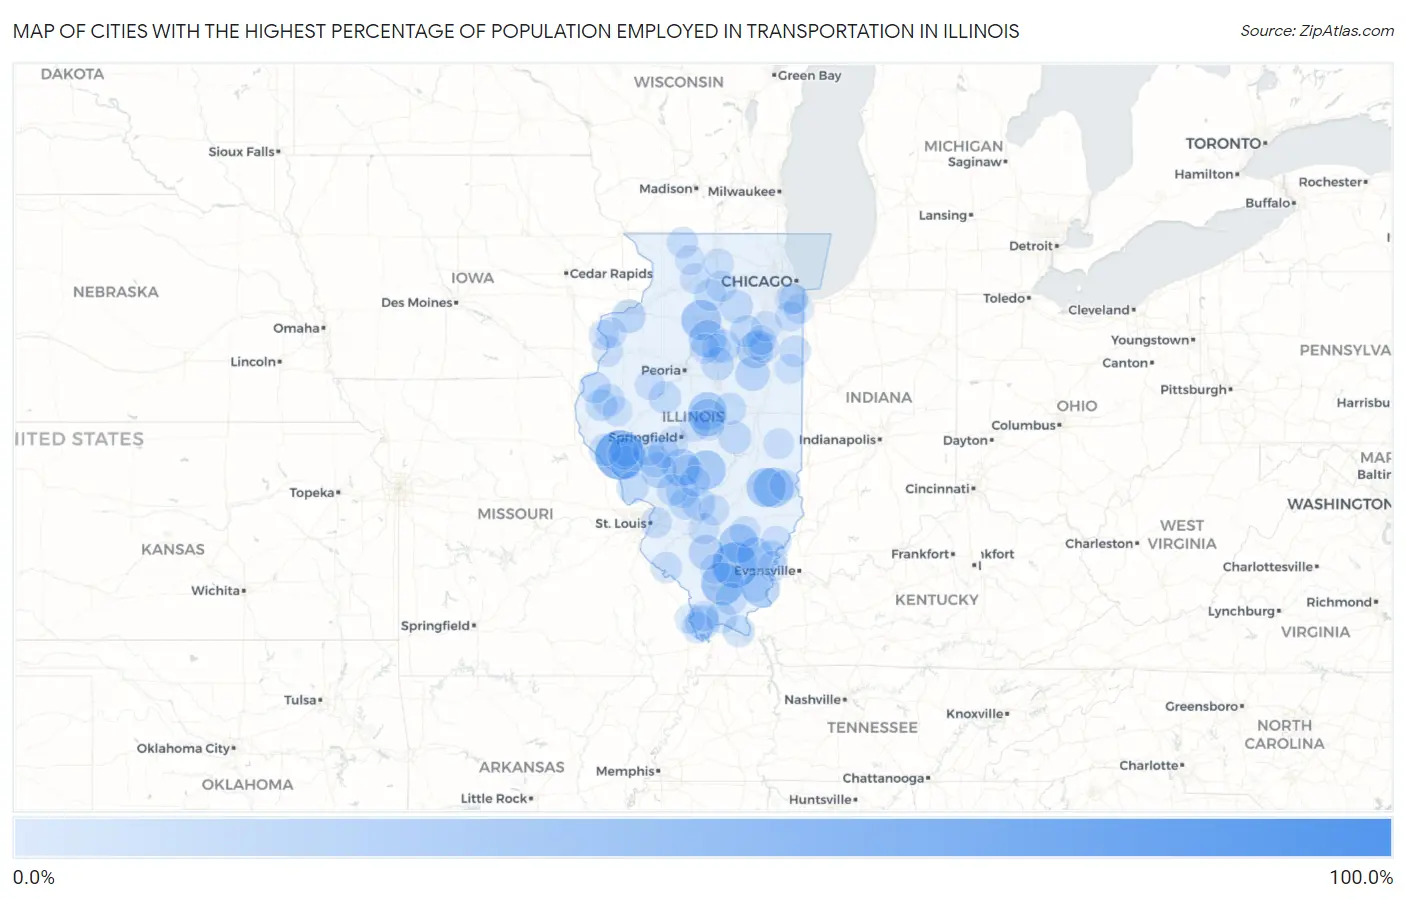
Map of Cities with the Highest Percentage of Population Employed in Transportation in Illinois
0.0%
100.0%
Cities with the Highest Percentage of Population Employed in Transportation in Illinois
| City | % Employed | vs State | vs National | |
| 1. | Oxville | 100.0% | 4.2%(+95.8)#1 | 3.8%(+96.2)#16 |
| 2. | Time | 60.0% | 4.2%(+55.8)#2 | 3.8%(+56.2)#53 |
| 3. | Macedonia | 50.0% | 4.2%(+45.8)#3 | 3.8%(+46.2)#100 |
| 4. | Triumph | 44.7% | 4.2%(+40.5)#4 | 3.8%(+40.9)#138 |
| 5. | Whiteash | 42.6% | 4.2%(+38.4)#5 | 3.8%(+38.8)#153 |
| 6. | Yale | 36.8% | 4.2%(+32.6)#6 | 3.8%(+33.0)#208 |
| 7. | Hollowayville | 36.7% | 4.2%(+32.4)#7 | 3.8%(+32.8)#212 |
| 8. | Rose Hill | 35.3% | 4.2%(+31.1)#8 | 3.8%(+31.5)#239 |
| 9. | Keenes | 34.6% | 4.2%(+30.4)#9 | 3.8%(+30.8)#246 |
| 10. | Ohlman | 34.5% | 4.2%(+30.3)#10 | 3.8%(+30.7)#250 |
| 11. | Marcelline | 33.3% | 4.2%(+29.1)#11 | 3.8%(+29.5)#280 |
| 12. | Burton | 32.7% | 4.2%(+28.4)#12 | 3.8%(+28.8)#293 |
| 13. | Beason | 32.1% | 4.2%(+27.9)#13 | 3.8%(+28.3)#302 |
| 14. | Waggoner | 30.3% | 4.2%(+26.1)#14 | 3.8%(+26.5)#330 |
| 15. | Magnolia | 30.3% | 4.2%(+26.0)#15 | 3.8%(+26.4)#333 |
| 16. | Chestnut | 30.0% | 4.2%(+25.8)#16 | 3.8%(+26.2)#336 |
| 17. | Junction | 29.2% | 4.2%(+24.9)#17 | 3.8%(+25.3)#356 |
| 18. | Emington | 27.8% | 4.2%(+23.5)#18 | 3.8%(+24.0)#399 |
| 19. | Hettick | 27.3% | 4.2%(+23.0)#19 | 3.8%(+23.5)#408 |
| 20. | Springerton | 26.1% | 4.2%(+21.9)#20 | 3.8%(+22.3)#454 |
| 21. | Du Bois | 25.0% | 4.2%(+20.8)#21 | 3.8%(+21.2)#491 |
| 22. | Strawn | 23.8% | 4.2%(+19.6)#22 | 3.8%(+20.0)#539 |
| 23. | Burtons Bridge | 22.9% | 4.2%(+18.7)#23 | 3.8%(+19.1)#591 |
| 24. | Tamms | 22.2% | 4.2%(+17.9)#24 | 3.8%(+18.3)#641 |
| 25. | Oak Grove | 22.0% | 4.2%(+17.7)#25 | 3.8%(+18.1)#648 |
| 26. | Smithboro | 20.9% | 4.2%(+16.7)#26 | 3.8%(+17.1)#717 |
| 27. | Sheridan | 20.8% | 4.2%(+16.5)#27 | 3.8%(+17.0)#734 |
| 28. | Pearl | 20.6% | 4.2%(+16.4)#28 | 3.8%(+16.8)#749 |
| 29. | Walshville | 20.3% | 4.2%(+16.1)#29 | 3.8%(+16.5)#766 |
| 30. | Long Point | 20.3% | 4.2%(+16.1)#30 | 3.8%(+16.5)#768 |
| 31. | Panola | 20.0% | 4.2%(+15.8)#31 | 3.8%(+16.2)#810 |
| 32. | Florence | 20.0% | 4.2%(+15.8)#32 | 3.8%(+16.2)#811 |
| 33. | Laplace | 19.8% | 4.2%(+15.5)#33 | 3.8%(+15.9)#827 |
| 34. | Preemption | 19.4% | 4.2%(+15.1)#34 | 3.8%(+15.5)#853 |
| 35. | Campbell's Island | 18.9% | 4.2%(+14.6)#35 | 3.8%(+15.0)#890 |
| 36. | Topeka | 18.8% | 4.2%(+14.5)#36 | 3.8%(+14.9)#902 |
| 37. | Plymouth | 18.7% | 4.2%(+14.5)#37 | 3.8%(+14.9)#910 |
| 38. | Verona | 18.2% | 4.2%(+13.9)#38 | 3.8%(+14.4)#971 |
| 39. | De Witt | 18.1% | 4.2%(+13.8)#39 | 3.8%(+14.3)#995 |
| 40. | Bowen | 18.0% | 4.2%(+13.8)#40 | 3.8%(+14.2)#1,003 |
| 41. | West Brooklyn | 17.9% | 4.2%(+13.6)#41 | 3.8%(+14.0)#1,020 |
| 42. | Scottville | 17.9% | 4.2%(+13.6)#42 | 3.8%(+14.0)#1,024 |
| 43. | Fieldon | 17.8% | 4.2%(+13.5)#43 | 3.8%(+14.0)#1,031 |
| 44. | New Burnside | 17.6% | 4.2%(+13.4)#44 | 3.8%(+13.8)#1,041 |
| 45. | Belknap | 17.6% | 4.2%(+13.4)#45 | 3.8%(+13.8)#1,042 |
| 46. | El Dara | 17.6% | 4.2%(+13.4)#46 | 3.8%(+13.8)#1,043 |
| 47. | Brookport | 17.6% | 4.2%(+13.4)#47 | 3.8%(+13.8)#1,052 |
| 48. | Milton | 17.5% | 4.2%(+13.3)#48 | 3.8%(+13.7)#1,056 |
| 49. | Gulfport | 17.4% | 4.2%(+13.2)#49 | 3.8%(+13.6)#1,078 |
| 50. | Woodson | 17.4% | 4.2%(+13.1)#50 | 3.8%(+13.6)#1,081 |
| 51. | Old Ripley | 17.2% | 4.2%(+13.0)#51 | 3.8%(+13.4)#1,093 |
| 52. | Ferris | 17.2% | 4.2%(+13.0)#52 | 3.8%(+13.4)#1,098 |
| 53. | Sawyerville | 16.9% | 4.2%(+12.6)#53 | 3.8%(+13.1)#1,135 |
| 54. | Crossville | 16.7% | 4.2%(+12.4)#54 | 3.8%(+12.8)#1,157 |
| 55. | Beaverville | 16.4% | 4.2%(+12.2)#55 | 3.8%(+12.6)#1,204 |
| 56. | Robbins | 16.4% | 4.2%(+12.2)#56 | 3.8%(+12.6)#1,206 |
| 57. | Olive Branch | 16.3% | 4.2%(+12.1)#57 | 3.8%(+12.5)#1,219 |
| 58. | Oquawka | 16.3% | 4.2%(+12.1)#58 | 3.8%(+12.5)#1,221 |
| 59. | Ellis Grove | 16.2% | 4.2%(+11.9)#59 | 3.8%(+12.4)#1,239 |
| 60. | Hoffman | 16.1% | 4.2%(+11.9)#60 | 3.8%(+12.3)#1,249 |
| 61. | Washington Park | 15.9% | 4.2%(+11.7)#61 | 3.8%(+12.1)#1,268 |
| 62. | Lee | 15.9% | 4.2%(+11.7)#62 | 3.8%(+12.1)#1,270 |
| 63. | Latham | 15.9% | 4.2%(+11.6)#63 | 3.8%(+12.0)#1,282 |
| 64. | Waverly | 15.7% | 4.2%(+11.5)#64 | 3.8%(+11.9)#1,294 |
| 65. | Smithville | 15.7% | 4.2%(+11.5)#65 | 3.8%(+11.9)#1,299 |
| 66. | Cedarville | 15.4% | 4.2%(+11.2)#66 | 3.8%(+11.6)#1,344 |
| 67. | Vernon | 15.4% | 4.2%(+11.2)#67 | 3.8%(+11.6)#1,358 |
| 68. | Joy | 15.1% | 4.2%(+10.8)#68 | 3.8%(+11.2)#1,418 |
| 69. | Mossville | 15.0% | 4.2%(+10.8)#69 | 3.8%(+11.2)#1,430 |
| 70. | Annapolis | 15.0% | 4.2%(+10.8)#70 | 3.8%(+11.2)#1,433 |
| 71. | Cornland | 15.0% | 4.2%(+10.8)#71 | 3.8%(+11.2)#1,434 |
| 72. | Brocton | 14.8% | 4.2%(+10.6)#72 | 3.8%(+11.0)#1,463 |
| 73. | Browns | 14.8% | 4.2%(+10.6)#73 | 3.8%(+11.0)#1,472 |
| 74. | Harvel | 14.8% | 4.2%(+10.6)#74 | 3.8%(+11.0)#1,473 |
| 75. | Johnsonville | 14.8% | 4.2%(+10.6)#75 | 3.8%(+11.0)#1,477 |
| 76. | Cabery | 14.8% | 4.2%(+10.5)#76 | 3.8%(+11.0)#1,485 |
| 77. | Campus | 14.7% | 4.2%(+10.5)#77 | 3.8%(+10.9)#1,494 |
| 78. | Irving | 14.7% | 4.2%(+10.4)#78 | 3.8%(+10.9)#1,499 |
| 79. | Grand Detour | 14.5% | 4.2%(+10.3)#79 | 3.8%(+10.7)#1,543 |
| 80. | Maunie | 14.3% | 4.2%(+10.1)#80 | 3.8%(+10.5)#1,572 |
| 81. | Osco | 14.3% | 4.2%(+10.1)#81 | 3.8%(+10.5)#1,573 |
| 82. | Mill Creek | 14.3% | 4.2%(+10.1)#82 | 3.8%(+10.5)#1,581 |
| 83. | Lockport Heights | 14.2% | 4.2%(+9.93)#83 | 3.8%(+10.3)#1,602 |
| 84. | Lakewood Shores | 13.9% | 4.2%(+9.66)#84 | 3.8%(+10.1)#1,658 |
| 85. | Monee | 13.9% | 4.2%(+9.65)#85 | 3.8%(+10.1)#1,665 |
| 86. | Cuba | 13.9% | 4.2%(+9.64)#86 | 3.8%(+10.1)#1,668 |
| 87. | New Boston | 13.9% | 4.2%(+9.63)#87 | 3.8%(+10.0)#1,673 |
| 88. | East Cape Girardeau | 13.8% | 4.2%(+9.53)#88 | 3.8%(+9.94)#1,687 |
| 89. | Monroe Center | 13.8% | 4.2%(+9.52)#89 | 3.8%(+9.94)#1,688 |
| 90. | Ford Heights | 13.7% | 4.2%(+9.49)#90 | 3.8%(+9.90)#1,700 |
| 91. | Dixmoor | 13.7% | 4.2%(+9.48)#91 | 3.8%(+9.89)#1,701 |
| 92. | Curran | 13.6% | 4.2%(+9.40)#92 | 3.8%(+9.82)#1,722 |
| 93. | Adeline | 13.6% | 4.2%(+9.40)#93 | 3.8%(+9.82)#1,724 |
| 94. | North City | 13.4% | 4.2%(+9.15)#94 | 3.8%(+9.56)#1,792 |
| 95. | Rutland | 13.3% | 4.2%(+9.03)#95 | 3.8%(+9.45)#1,826 |
| 96. | Reddick | 13.3% | 4.2%(+9.02)#96 | 3.8%(+9.44)#1,828 |
| 97. | Equality | 13.2% | 4.2%(+9.00)#97 | 3.8%(+9.42)#1,831 |
| 98. | Woodland | 13.2% | 4.2%(+8.97)#98 | 3.8%(+9.39)#1,836 |
| 99. | La Rose | 13.2% | 4.2%(+8.97)#99 | 3.8%(+9.39)#1,839 |
| 100. | Camden | 13.0% | 4.2%(+8.81)#100 | 3.8%(+9.23)#1,880 |
Common Questions
What are the Top 10 Cities with the Highest Percentage of Population Employed in Transportation in Illinois?
Top 10 Cities with the Highest Percentage of Population Employed in Transportation in Illinois are:
What city has the Highest Percentage of Population Employed in Transportation in Illinois?
Time has the Highest Percentage of Population Employed in Transportation in Illinois with 60.0%.
What is the Percentage of Population Employed in Transportation in the State of Illinois?
Percentage of Population Employed in Transportation in Illinois is 4.2%.
What is the Percentage of Population Employed in Transportation in the United States?
Percentage of Population Employed in Transportation in the United States is 3.8%.