Cities with the Highest Percentage of Population Taking Public Transit to Work in Illinois
RELATED REPORTS & OPTIONS
Public Transit
Illinois
Compare Cities
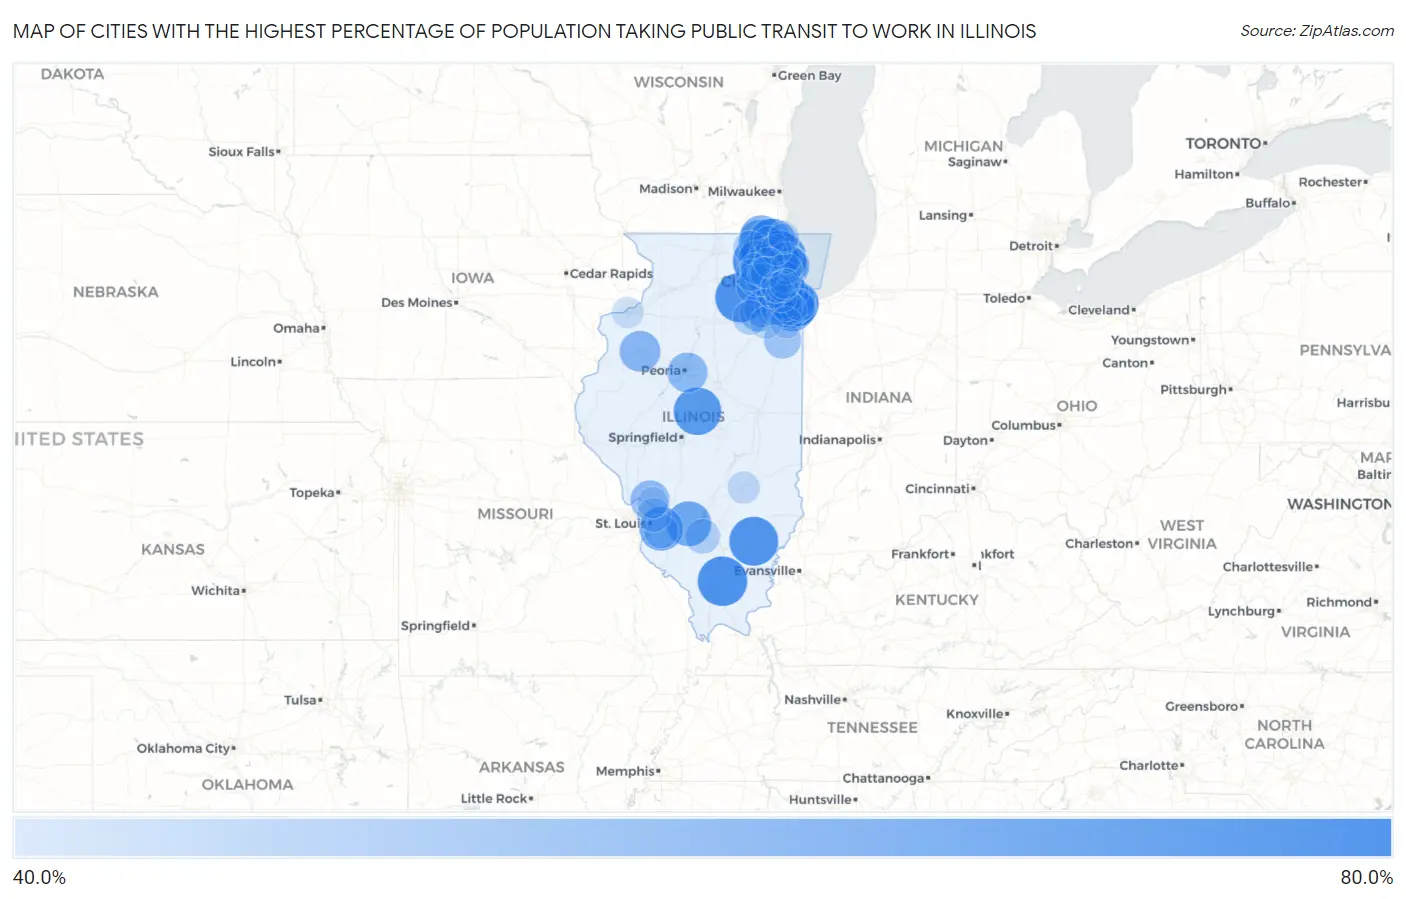
Map of Cities with the Highest Percentage of Population Taking Public Transit to Work in Illinois
0.0%
80.0%
Cities with the Highest Percentage of Population Taking Public Transit to Work in Illinois
| City | % Public Transit | vs State | vs National | |
| 1. | Johnston City | 65.4% | 36.8%(+28.6)#1 | 38.5%(+26.9)#43 |
| 2. | Sandwich | 65.3% | 36.8%(+28.5)#2 | 38.5%(+26.8)#46 |
| 3. | Carpentersville | 65.1% | 36.8%(+28.3)#3 | 38.5%(+26.6)#50 |
| 4. | Fairfield | 64.8% | 36.8%(+28.0)#4 | 38.5%(+26.3)#56 |
| 5. | Lincoln | 63.4% | 36.8%(+26.6)#5 | 38.5%(+24.9)#80 |
| 6. | East Hazel Crest | 62.6% | 36.8%(+25.8)#6 | 38.5%(+24.1)#90 |
| 7. | Bannockburn | 62.4% | 36.8%(+25.6)#7 | 38.5%(+23.9)#95 |
| 8. | Berkeley | 62.0% | 36.8%(+25.2)#8 | 38.5%(+23.5)#108 |
| 9. | Long Grove | 61.7% | 36.8%(+24.9)#9 | 38.5%(+23.2)#112 |
| 10. | Olympia Fields | 60.8% | 36.8%(+24.0)#10 | 38.5%(+22.3)#136 |
| 11. | Breese | 60.6% | 36.8%(+23.8)#11 | 38.5%(+22.1)#143 |
| 12. | Thornton | 60.5% | 36.8%(+23.7)#12 | 38.5%(+22.0)#151 |
| 13. | Port Barrington | 60.5% | 36.8%(+23.7)#13 | 38.5%(+22.0)#152 |
| 14. | Palos Hills | 60.2% | 36.8%(+23.4)#14 | 38.5%(+21.7)#161 |
| 15. | Darien | 59.9% | 36.8%(+23.1)#15 | 38.5%(+21.4)#172 |
| 16. | Swansea | 59.6% | 36.8%(+22.8)#16 | 38.5%(+21.1)#177 |
| 17. | Golf | 59.1% | 36.8%(+22.3)#17 | 38.5%(+20.6)#206 |
| 18. | Lindenhurst | 58.3% | 36.8%(+21.5)#18 | 38.5%(+19.8)#227 |
| 19. | Johnsburg | 58.3% | 36.8%(+21.5)#19 | 38.5%(+19.8)#230 |
| 20. | Spring Grove | 57.7% | 36.8%(+20.9)#20 | 38.5%(+19.2)#273 |
| 21. | Oakwood Hills | 56.8% | 36.8%(+20.0)#21 | 38.5%(+18.3)#322 |
| 22. | North Barrington | 56.5% | 36.8%(+19.7)#22 | 38.5%(+18.0)#340 |
| 23. | Galesburg | 56.4% | 36.8%(+19.6)#23 | 38.5%(+17.9)#344 |
| 24. | Trout Valley | 56.4% | 36.8%(+19.6)#24 | 38.5%(+17.9)#352 |
| 25. | Burr Ridge | 56.3% | 36.8%(+19.5)#25 | 38.5%(+17.8)#356 |
| 26. | Lake Villa | 55.9% | 36.8%(+19.1)#26 | 38.5%(+17.4)#384 |
| 27. | East Peoria | 55.7% | 36.8%(+18.9)#27 | 38.5%(+17.2)#396 |
| 28. | Wayne | 55.0% | 36.8%(+18.2)#28 | 38.5%(+16.5)#453 |
| 29. | Godfrey | 54.8% | 36.8%(+18.0)#29 | 38.5%(+16.3)#460 |
| 30. | Deer Park | 54.4% | 36.8%(+17.6)#30 | 38.5%(+15.9)#488 |
| 31. | Chicago Heights | 54.1% | 36.8%(+17.3)#31 | 38.5%(+15.6)#513 |
| 32. | Minooka | 54.1% | 36.8%(+17.3)#32 | 38.5%(+15.6)#515 |
| 33. | River Forest | 53.7% | 36.8%(+16.9)#33 | 38.5%(+15.2)#543 |
| 34. | North Aurora | 53.2% | 36.8%(+16.4)#34 | 38.5%(+14.7)#589 |
| 35. | Shorewood | 52.9% | 36.8%(+16.1)#35 | 38.5%(+14.4)#615 |
| 36. | Kankakee | 52.8% | 36.8%(+16.0)#36 | 38.5%(+14.3)#620 |
| 37. | Green Oaks | 52.7% | 36.8%(+15.9)#37 | 38.5%(+14.2)#630 |
| 38. | Homer Glen | 52.5% | 36.8%(+15.7)#38 | 38.5%(+14.0)#647 |
| 39. | Norridge | 52.5% | 36.8%(+15.7)#39 | 38.5%(+14.0)#648 |
| 40. | Algonquin | 52.2% | 36.8%(+15.4)#40 | 38.5%(+13.7)#666 |
| 41. | South Holland | 52.2% | 36.8%(+15.4)#41 | 38.5%(+13.7)#669 |
| 42. | Villa Park | 51.9% | 36.8%(+15.1)#42 | 38.5%(+13.4)#694 |
| 43. | Hazel Crest | 51.4% | 36.8%(+14.6)#43 | 38.5%(+12.9)#732 |
| 44. | Kenilworth | 51.4% | 36.8%(+14.6)#44 | 38.5%(+12.9)#738 |
| 45. | Rosemont | 51.3% | 36.8%(+14.5)#45 | 38.5%(+12.8)#750 |
| 46. | Ingalls Park | 51.3% | 36.8%(+14.5)#46 | 38.5%(+12.8)#751 |
| 47. | Wilmette | 50.9% | 36.8%(+14.1)#47 | 38.5%(+12.4)#783 |
| 48. | Ford Heights | 50.9% | 36.8%(+14.1)#48 | 38.5%(+12.4)#789 |
| 49. | Dolton | 50.5% | 36.8%(+13.7)#49 | 38.5%(+12.0)#824 |
| 50. | Forest View | 50.5% | 36.8%(+13.7)#50 | 38.5%(+12.0)#832 |
| 51. | Richton Park | 50.3% | 36.8%(+13.5)#51 | 38.5%(+11.8)#847 |
| 52. | Frankfort Square | 50.3% | 36.8%(+13.5)#52 | 38.5%(+11.8)#850 |
| 53. | Hoyleton | 50.3% | 36.8%(+13.5)#53 | 38.5%(+11.8)#858 |
| 54. | Frankfort | 50.2% | 36.8%(+13.4)#54 | 38.5%(+11.7)#864 |
| 55. | Morris | 50.1% | 36.8%(+13.3)#55 | 38.5%(+11.6)#882 |
| 56. | Belleville | 50.0% | 36.8%(+13.2)#56 | 38.5%(+11.5)#893 |
| 57. | South Elgin | 49.8% | 36.8%(+13.0)#57 | 38.5%(+11.3)#907 |
| 58. | Granite City | 49.6% | 36.8%(+12.8)#58 | 38.5%(+11.1)#929 |
| 59. | Winfield | 49.6% | 36.8%(+12.8)#59 | 38.5%(+11.1)#938 |
| 60. | Barrington Hills | 49.4% | 36.8%(+12.6)#60 | 38.5%(+10.9)#984 |
| 61. | Palos Heights | 49.3% | 36.8%(+12.5)#61 | 38.5%(+10.8)#994 |
| 62. | Stickney | 49.3% | 36.8%(+12.5)#62 | 38.5%(+10.8)#1,000 |
| 63. | Lake Barrington | 49.1% | 36.8%(+12.3)#63 | 38.5%(+10.6)#1,033 |
| 64. | Woodstock | 49.0% | 36.8%(+12.2)#64 | 38.5%(+10.5)#1,040 |
| 65. | Glenwood | 49.0% | 36.8%(+12.2)#65 | 38.5%(+10.5)#1,047 |
| 66. | Winnetka | 48.9% | 36.8%(+12.1)#66 | 38.5%(+10.4)#1,057 |
| 67. | Hinsdale | 48.7% | 36.8%(+11.9)#67 | 38.5%(+10.2)#1,077 |
| 68. | Geneva | 48.6% | 36.8%(+11.8)#68 | 38.5%(+10.1)#1,088 |
| 69. | Orland Hills | 48.6% | 36.8%(+11.8)#69 | 38.5%(+10.1)#1,093 |
| 70. | Evergreen Park | 48.4% | 36.8%(+11.6)#70 | 38.5%(+9.90)#1,115 |
| 71. | Clarendon Hills | 48.4% | 36.8%(+11.6)#71 | 38.5%(+9.90)#1,119 |
| 72. | New Lenox | 48.3% | 36.8%(+11.5)#72 | 38.5%(+9.80)#1,132 |
| 73. | Wilmington | 48.2% | 36.8%(+11.4)#73 | 38.5%(+9.70)#1,159 |
| 74. | Matteson | 48.0% | 36.8%(+11.2)#74 | 38.5%(+9.50)#1,183 |
| 75. | West Chicago | 47.9% | 36.8%(+11.1)#75 | 38.5%(+9.40)#1,188 |
| 76. | Tinley Park | 47.8% | 36.8%(+11.0)#76 | 38.5%(+9.30)#1,198 |
| 77. | Deerfield | 47.8% | 36.8%(+11.0)#77 | 38.5%(+9.30)#1,202 |
| 78. | Effingham | 47.8% | 36.8%(+11.0)#78 | 38.5%(+9.30)#1,206 |
| 79. | Hawthorn Woods | 47.8% | 36.8%(+11.0)#79 | 38.5%(+9.30)#1,207 |
| 80. | Elmwood Park | 47.6% | 36.8%(+10.8)#80 | 38.5%(+9.10)#1,228 |
| 81. | Peotone | 47.6% | 36.8%(+10.8)#81 | 38.5%(+9.10)#1,241 |
| 82. | Woodridge | 47.5% | 36.8%(+10.7)#82 | 38.5%(+9.00)#1,247 |
| 83. | Highland Park | 47.4% | 36.8%(+10.6)#83 | 38.5%(+8.90)#1,271 |
| 84. | Lansing | 47.4% | 36.8%(+10.6)#84 | 38.5%(+8.90)#1,272 |
| 85. | Campton Hills | 47.3% | 36.8%(+10.5)#85 | 38.5%(+8.80)#1,297 |
| 86. | Palos Park | 47.3% | 36.8%(+10.5)#86 | 38.5%(+8.80)#1,300 |
| 87. | Elgin | 47.2% | 36.8%(+10.4)#87 | 38.5%(+8.70)#1,304 |
| 88. | Rock Island | 47.2% | 36.8%(+10.4)#88 | 38.5%(+8.70)#1,308 |
| 89. | Alton | 47.0% | 36.8%(+10.2)#89 | 38.5%(+8.50)#1,344 |
| 90. | Morton Grove | 46.9% | 36.8%(+10.1)#90 | 38.5%(+8.40)#1,356 |
| 91. | Bartlett | 46.8% | 36.8%(+10.00)#91 | 38.5%(+8.30)#1,369 |
| 92. | Hanover Park | 46.8% | 36.8%(+10.00)#92 | 38.5%(+8.30)#1,370 |
| 93. | La Grange | 46.8% | 36.8%(+10.00)#93 | 38.5%(+8.30)#1,372 |
| 94. | Libertyville | 46.4% | 36.8%(+9.60)#94 | 38.5%(+7.90)#1,439 |
| 95. | Round Lake Heights | 46.4% | 36.8%(+9.60)#95 | 38.5%(+7.90)#1,446 |
| 96. | Zion | 46.3% | 36.8%(+9.50)#96 | 38.5%(+7.80)#1,451 |
| 97. | Westmont | 46.3% | 36.8%(+9.50)#97 | 38.5%(+7.80)#1,452 |
| 98. | Beach Park | 46.1% | 36.8%(+9.30)#98 | 38.5%(+7.60)#1,491 |
| 99. | Inverness | 45.9% | 36.8%(+9.10)#99 | 38.5%(+7.40)#1,512 |
| 100. | Riverside | 45.8% | 36.8%(+9.00)#100 | 38.5%(+7.30)#1,522 |
Common Questions
What are the Top 10 Cities with the Highest Percentage of Population Taking Public Transit to Work in Illinois?
Top 10 Cities with the Highest Percentage of Population Taking Public Transit to Work in Illinois are:
#1
65.4%
#2
65.3%
#3
65.1%
#4
64.8%
#5
63.4%
#6
62.6%
#7
62.4%
#8
62.0%
#9
61.7%
#10
60.8%
What city has the Highest Percentage of Population Taking Public Transit to Work in Illinois?
Johnston City has the Highest Percentage of Population Taking Public Transit to Work in Illinois with 65.4%.
What is the Percentage of Population Taking Public Transit to Work in the State of Illinois?
Percentage of Population Taking Public Transit to Work in Illinois is 36.8%.
What is the Percentage of Population Taking Public Transit to Work in the United States?
Percentage of Population Taking Public Transit to Work in the United States is 38.5%.