Cities with the Highest Percentage of Population Employed in Retail Trade in Illinois
RELATED REPORTS & OPTIONS
Retail Trade
Illinois
Compare Cities
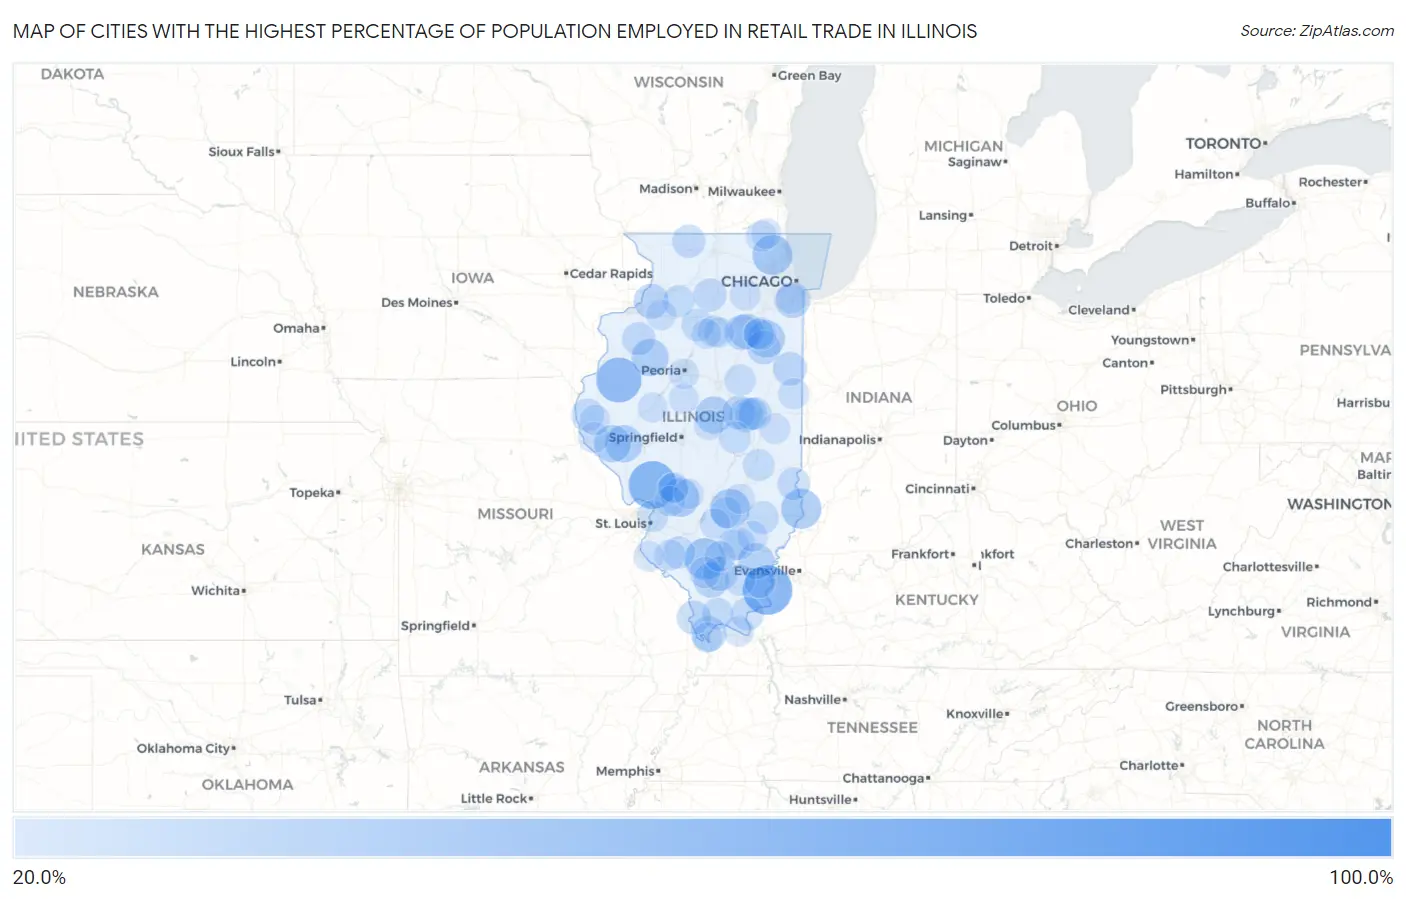
Map of Cities with the Highest Percentage of Population Employed in Retail Trade in Illinois
0.0%
100.0%
Cities with the Highest Percentage of Population Employed in Retail Trade in Illinois
| City | % Employed | vs State | vs National | |
| 1. | West Liberty | 100.0% | 10.5%(+89.5)#1 | 11.0%(+89.0)#23 |
| 2. | Millersburg | 100.0% | 10.5%(+89.5)#2 | 11.0%(+89.0)#27 |
| 3. | Janesville | 100.0% | 10.5%(+89.5)#3 | 11.0%(+89.0)#39 |
| 4. | Marley | 100.0% | 10.5%(+89.5)#4 | 11.0%(+89.0)#45 |
| 5. | Custer Park | 67.1% | 10.5%(+56.6)#5 | 11.0%(+56.1)#104 |
| 6. | Old Shawneetown | 65.6% | 10.5%(+55.1)#6 | 11.0%(+54.6)#116 |
| 7. | Shirley | 62.5% | 10.5%(+52.0)#7 | 11.0%(+51.5)#135 |
| 8. | Fidelity | 61.5% | 10.5%(+51.0)#8 | 11.0%(+50.5)#140 |
| 9. | Serena | 56.1% | 10.5%(+45.7)#9 | 11.0%(+45.2)#182 |
| 10. | Sciota | 55.0% | 10.5%(+44.5)#10 | 11.0%(+44.0)#189 |
| 11. | Bloomfield | 54.1% | 10.5%(+43.6)#11 | 11.0%(+43.1)#203 |
| 12. | Galt | 50.9% | 10.5%(+40.4)#12 | 11.0%(+39.9)#233 |
| 13. | Lynn Center | 50.0% | 10.5%(+39.5)#13 | 11.0%(+39.0)#250 |
| 14. | Tamaroa | 46.7% | 10.5%(+36.2)#14 | 11.0%(+35.7)#301 |
| 15. | Triumph | 44.7% | 10.5%(+34.2)#15 | 11.0%(+33.7)#348 |
| 16. | Russellville | 43.9% | 10.5%(+33.4)#16 | 11.0%(+32.9)#361 |
| 17. | Forest Lake | 43.4% | 10.5%(+32.9)#17 | 11.0%(+32.4)#377 |
| 18. | Farina | 43.1% | 10.5%(+32.6)#18 | 11.0%(+32.1)#381 |
| 19. | Carman | 42.3% | 10.5%(+31.9)#19 | 11.0%(+31.4)#409 |
| 20. | New Douglas | 40.5% | 10.5%(+30.0)#20 | 11.0%(+29.5)#468 |
| 21. | Gilson | 37.7% | 10.5%(+27.2)#21 | 11.0%(+26.7)#568 |
| 22. | Valley City | 37.5% | 10.5%(+27.0)#22 | 11.0%(+26.5)#581 |
| 23. | New Salem | 37.3% | 10.5%(+26.8)#23 | 11.0%(+26.3)#591 |
| 24. | Kenney | 37.2% | 10.5%(+26.7)#24 | 11.0%(+26.2)#595 |
| 25. | Union Hill | 37.1% | 10.5%(+26.7)#25 | 11.0%(+26.2)#596 |
| 26. | Baileyville | 36.9% | 10.5%(+26.4)#26 | 11.0%(+25.9)#608 |
| 27. | Adams | 35.9% | 10.5%(+25.4)#27 | 11.0%(+24.9)#645 |
| 28. | Enfield | 34.9% | 10.5%(+24.4)#28 | 11.0%(+23.9)#697 |
| 29. | Posen | 33.8% | 10.5%(+23.4)#29 | 11.0%(+22.9)#752 |
| 30. | Kinsman | 33.3% | 10.5%(+22.8)#30 | 11.0%(+22.3)#793 |
| 31. | Bush | 33.1% | 10.5%(+22.6)#31 | 11.0%(+22.1)#819 |
| 32. | Mound City | 33.0% | 10.5%(+22.5)#32 | 11.0%(+22.0)#825 |
| 33. | Ophiem | 32.6% | 10.5%(+22.1)#33 | 11.0%(+21.6)#852 |
| 34. | Verona | 32.6% | 10.5%(+22.1)#34 | 11.0%(+21.6)#854 |
| 35. | Hillsdale | 32.4% | 10.5%(+21.9)#35 | 11.0%(+21.4)#880 |
| 36. | Lane | 31.2% | 10.5%(+20.8)#36 | 11.0%(+20.3)#958 |
| 37. | Orient | 31.1% | 10.5%(+20.6)#37 | 11.0%(+20.1)#971 |
| 38. | White Heath | 30.4% | 10.5%(+19.9)#38 | 11.0%(+19.4)#1,020 |
| 39. | Ridgefield | 30.3% | 10.5%(+19.8)#39 | 11.0%(+19.3)#1,031 |
| 40. | Mcclure | 29.8% | 10.5%(+19.3)#40 | 11.0%(+18.8)#1,080 |
| 41. | De Land | 29.7% | 10.5%(+19.2)#41 | 11.0%(+18.7)#1,085 |
| 42. | Cabery | 29.5% | 10.5%(+19.1)#42 | 11.0%(+18.6)#1,111 |
| 43. | Woodland | 29.2% | 10.5%(+18.8)#43 | 11.0%(+18.3)#1,140 |
| 44. | Rio | 28.7% | 10.5%(+18.2)#44 | 11.0%(+17.7)#1,187 |
| 45. | West Brooklyn | 28.6% | 10.5%(+18.1)#45 | 11.0%(+17.6)#1,209 |
| 46. | Dakota | 28.5% | 10.5%(+18.0)#46 | 11.0%(+17.5)#1,225 |
| 47. | Holcomb | 28.0% | 10.5%(+17.5)#47 | 11.0%(+17.0)#1,283 |
| 48. | East Brooklyn | 28.0% | 10.5%(+17.5)#48 | 11.0%(+17.0)#1,286 |
| 49. | Bondville | 27.9% | 10.5%(+17.4)#49 | 11.0%(+16.9)#1,301 |
| 50. | Golconda | 27.7% | 10.5%(+17.2)#50 | 11.0%(+16.7)#1,321 |
| 51. | West York | 27.5% | 10.5%(+17.0)#51 | 11.0%(+16.5)#1,352 |
| 52. | Mendon | 27.1% | 10.5%(+16.7)#52 | 11.0%(+16.2)#1,395 |
| 53. | Keenes | 26.9% | 10.5%(+16.4)#53 | 11.0%(+15.9)#1,425 |
| 54. | Noble | 26.8% | 10.5%(+16.3)#54 | 11.0%(+15.8)#1,444 |
| 55. | Bureau Junction | 26.7% | 10.5%(+16.2)#55 | 11.0%(+15.7)#1,451 |
| 56. | Tilden | 26.6% | 10.5%(+16.1)#56 | 11.0%(+15.6)#1,469 |
| 57. | Seymour | 26.3% | 10.5%(+15.9)#57 | 11.0%(+15.4)#1,510 |
| 58. | Laplace | 25.9% | 10.5%(+15.4)#58 | 11.0%(+14.9)#1,563 |
| 59. | Deer Grove | 25.9% | 10.5%(+15.4)#59 | 11.0%(+14.9)#1,567 |
| 60. | Madison | 25.2% | 10.5%(+14.7)#60 | 11.0%(+14.2)#1,692 |
| 61. | Cypress | 25.0% | 10.5%(+14.5)#61 | 11.0%(+14.0)#1,736 |
| 62. | Lerna | 25.0% | 10.5%(+14.5)#62 | 11.0%(+14.0)#1,737 |
| 63. | Colfax | 24.4% | 10.5%(+13.9)#63 | 11.0%(+13.4)#1,877 |
| 64. | Bluford | 24.4% | 10.5%(+13.9)#64 | 11.0%(+13.4)#1,878 |
| 65. | Burtons Bridge | 24.1% | 10.5%(+13.6)#65 | 11.0%(+13.1)#1,945 |
| 66. | Tonica | 24.1% | 10.5%(+13.6)#66 | 11.0%(+13.1)#1,953 |
| 67. | Dowell | 24.0% | 10.5%(+13.5)#67 | 11.0%(+13.0)#1,965 |
| 68. | Galatia | 24.0% | 10.5%(+13.5)#68 | 11.0%(+13.0)#1,972 |
| 69. | Kinmundy | 23.8% | 10.5%(+13.3)#69 | 11.0%(+12.8)#2,025 |
| 70. | Rossville | 23.6% | 10.5%(+13.1)#70 | 11.0%(+12.6)#2,060 |
| 71. | Plainville | 23.5% | 10.5%(+13.0)#71 | 11.0%(+12.5)#2,096 |
| 72. | Jeffersonville | 23.4% | 10.5%(+12.9)#72 | 11.0%(+12.4)#2,107 |
| 73. | Plano | 23.4% | 10.5%(+12.9)#73 | 11.0%(+12.4)#2,110 |
| 74. | Arbury Hills | 23.4% | 10.5%(+12.9)#74 | 11.0%(+12.4)#2,117 |
| 75. | Spring Grove | 23.4% | 10.5%(+12.9)#75 | 11.0%(+12.4)#2,130 |
| 76. | Nason | 23.2% | 10.5%(+12.7)#76 | 11.0%(+12.2)#2,166 |
| 77. | Baldwin | 23.0% | 10.5%(+12.5)#77 | 11.0%(+12.0)#2,215 |
| 78. | Ridgway | 22.9% | 10.5%(+12.4)#78 | 11.0%(+11.9)#2,250 |
| 79. | Coatsburg | 22.7% | 10.5%(+12.2)#79 | 11.0%(+11.7)#2,315 |
| 80. | Benld | 22.6% | 10.5%(+12.2)#80 | 11.0%(+11.7)#2,316 |
| 81. | Brookport | 22.6% | 10.5%(+12.2)#81 | 11.0%(+11.7)#2,317 |
| 82. | Worden | 22.4% | 10.5%(+11.9)#82 | 11.0%(+11.4)#2,384 |
| 83. | Odin | 22.4% | 10.5%(+11.9)#83 | 11.0%(+11.4)#2,394 |
| 84. | Broadlands | 22.3% | 10.5%(+11.8)#84 | 11.0%(+11.3)#2,411 |
| 85. | Atkinson | 22.3% | 10.5%(+11.8)#85 | 11.0%(+11.3)#2,419 |
| 86. | Fults | 22.2% | 10.5%(+11.7)#86 | 11.0%(+11.2)#2,444 |
| 87. | Creve Coeur | 22.1% | 10.5%(+11.7)#87 | 11.0%(+11.2)#2,465 |
| 88. | Cairo | 22.1% | 10.5%(+11.6)#88 | 11.0%(+11.1)#2,469 |
| 89. | Leonore | 22.1% | 10.5%(+11.6)#89 | 11.0%(+11.1)#2,485 |
| 90. | Mason | 22.0% | 10.5%(+11.5)#90 | 11.0%(+11.0)#2,493 |
| 91. | Channel Lake | 22.0% | 10.5%(+11.5)#91 | 11.0%(+11.0)#2,499 |
| 92. | Eagarville | 21.9% | 10.5%(+11.4)#92 | 11.0%(+10.9)#2,523 |
| 93. | Cameron | 21.9% | 10.5%(+11.4)#93 | 11.0%(+10.9)#2,549 |
| 94. | South Wilmington | 21.8% | 10.5%(+11.3)#94 | 11.0%(+10.8)#2,557 |
| 95. | Robbins | 21.8% | 10.5%(+11.3)#95 | 11.0%(+10.8)#2,568 |
| 96. | Bath | 21.6% | 10.5%(+11.1)#96 | 11.0%(+10.6)#2,625 |
| 97. | Panama | 21.6% | 10.5%(+11.1)#97 | 11.0%(+10.6)#2,630 |
| 98. | Mcnabb | 21.6% | 10.5%(+11.1)#98 | 11.0%(+10.6)#2,642 |
| 99. | Latham | 21.5% | 10.5%(+11.1)#99 | 11.0%(+10.6)#2,645 |
| 100. | San Jose | 21.5% | 10.5%(+11.1)#100 | 11.0%(+10.6)#2,646 |
Common Questions
What are the Top 10 Cities with the Highest Percentage of Population Employed in Retail Trade in Illinois?
Top 10 Cities with the Highest Percentage of Population Employed in Retail Trade in Illinois are:
#1
65.6%
#2
61.5%
#3
55.0%
#4
46.7%
#5
43.9%
#6
43.4%
#7
43.1%
#8
40.5%
#9
37.7%
#10
37.5%
What city has the Highest Percentage of Population Employed in Retail Trade in Illinois?
Old Shawneetown has the Highest Percentage of Population Employed in Retail Trade in Illinois with 65.6%.
What is the Percentage of Population Employed in Retail Trade in the State of Illinois?
Percentage of Population Employed in Retail Trade in Illinois is 10.5%.
What is the Percentage of Population Employed in Retail Trade in the United States?
Percentage of Population Employed in Retail Trade in the United States is 11.0%.