Cities with the Highest Percentage of Population Employed in Manufacturing in Illinois
RELATED REPORTS & OPTIONS
Manufacturing
Illinois
Compare Cities
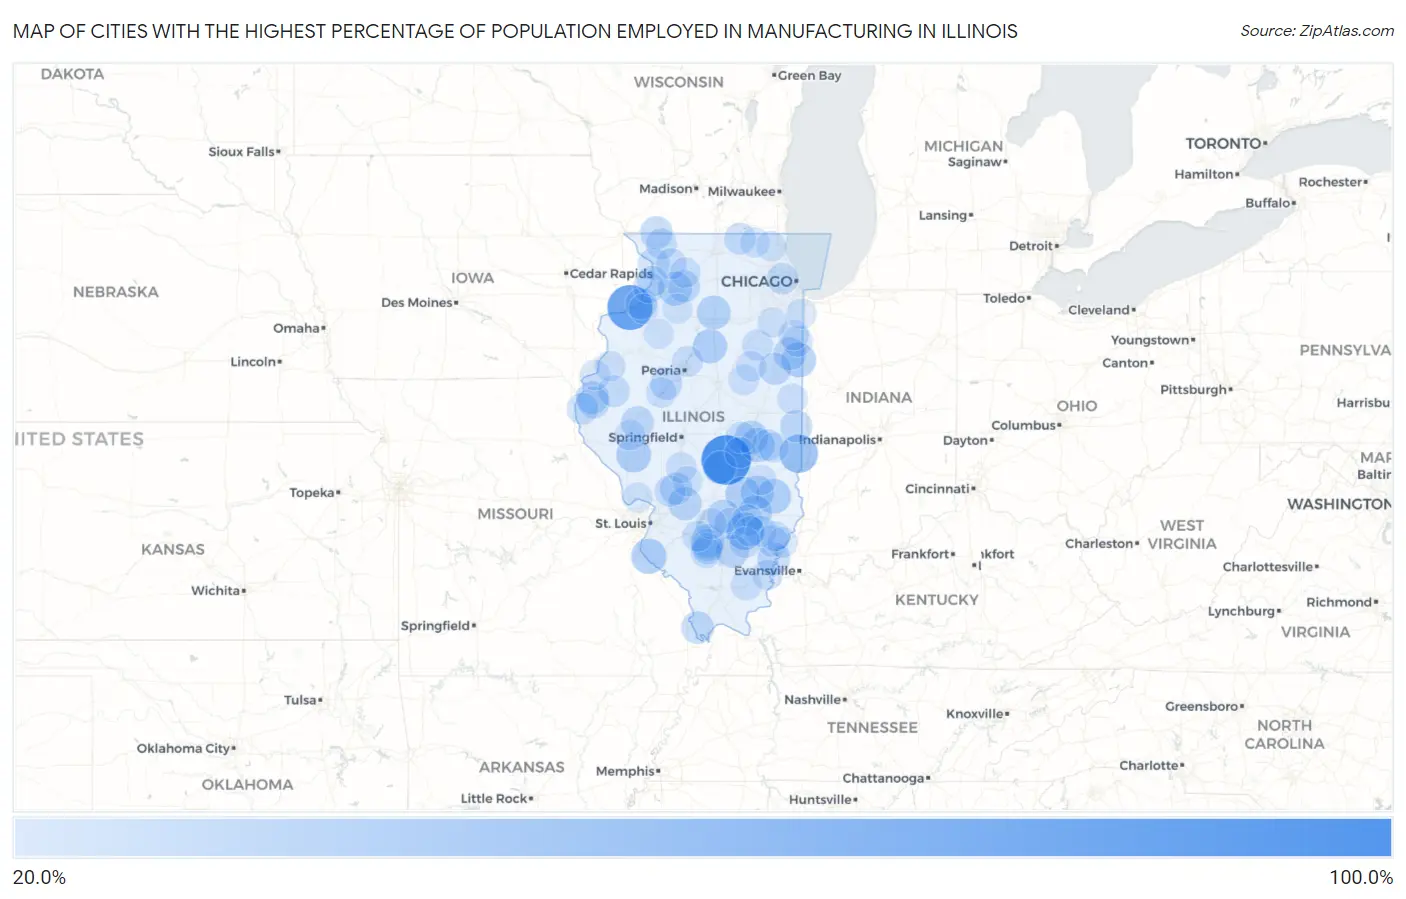
Map of Cities with the Highest Percentage of Population Employed in Manufacturing in Illinois
0.0%
100.0%
Cities with the Highest Percentage of Population Employed in Manufacturing in Illinois
| City | % Employed | vs State | vs National | |
| 1. | Alden | 100.0% | 11.6%(+88.4)#1 | 10.0%(+90.0)#7 |
| 2. | Harding | 100.0% | 11.6%(+88.4)#2 | 10.0%(+90.0)#15 |
| 3. | Westervelt | 100.0% | 11.6%(+88.4)#3 | 10.0%(+90.0)#58 |
| 4. | Rock Island Arsenal | 82.5% | 11.6%(+70.9)#4 | 10.0%(+72.5)#88 |
| 5. | Dewey | 56.9% | 11.6%(+45.3)#5 | 10.0%(+47.0)#241 |
| 6. | Vermilion | 56.7% | 11.6%(+45.1)#6 | 10.0%(+46.7)#243 |
| 7. | Triumph | 55.3% | 11.6%(+43.6)#7 | 10.0%(+45.3)#270 |
| 8. | Johnsonville | 51.9% | 11.6%(+40.2)#8 | 10.0%(+41.9)#344 |
| 9. | Lynn Center | 50.0% | 11.6%(+38.4)#9 | 10.0%(+40.0)#397 |
| 10. | Fowler | 45.0% | 11.6%(+33.4)#10 | 10.0%(+35.0)#550 |
| 11. | Elwin | 44.4% | 11.6%(+32.8)#11 | 10.0%(+34.5)#578 |
| 12. | Fults | 44.4% | 11.6%(+32.8)#12 | 10.0%(+34.5)#580 |
| 13. | Glasgow | 43.1% | 11.6%(+31.5)#13 | 10.0%(+33.1)#650 |
| 14. | Willow Hill | 42.9% | 11.6%(+31.2)#14 | 10.0%(+32.9)#657 |
| 15. | Iroquois | 42.5% | 11.6%(+30.8)#15 | 10.0%(+32.5)#679 |
| 16. | Arcola | 41.5% | 11.6%(+29.9)#16 | 10.0%(+31.5)#734 |
| 17. | Toluca | 41.4% | 11.6%(+29.7)#17 | 10.0%(+31.4)#744 |
| 18. | Watson | 40.7% | 11.6%(+29.1)#18 | 10.0%(+30.7)#783 |
| 19. | Sailor Springs | 40.4% | 11.6%(+28.8)#19 | 10.0%(+30.4)#800 |
| 20. | Troy Grove | 39.9% | 11.6%(+28.2)#20 | 10.0%(+29.9)#850 |
| 21. | Como | 39.7% | 11.6%(+28.1)#21 | 10.0%(+29.7)#858 |
| 22. | Ritchie | 39.6% | 11.6%(+28.0)#22 | 10.0%(+29.6)#862 |
| 23. | Garrett | 39.1% | 11.6%(+27.5)#23 | 10.0%(+29.1)#893 |
| 24. | Wheeler | 38.8% | 11.6%(+27.1)#24 | 10.0%(+28.8)#916 |
| 25. | Richview | 38.6% | 11.6%(+27.0)#25 | 10.0%(+28.6)#929 |
| 26. | Old Ripley | 37.9% | 11.6%(+26.3)#26 | 10.0%(+27.9)#984 |
| 27. | Alma | 37.9% | 11.6%(+26.2)#27 | 10.0%(+27.9)#990 |
| 28. | Tower Hill | 36.9% | 11.6%(+25.3)#28 | 10.0%(+26.9)#1,066 |
| 29. | Literberry | 36.5% | 11.6%(+24.9)#29 | 10.0%(+26.5)#1,108 |
| 30. | Phillipstown | 36.4% | 11.6%(+24.7)#30 | 10.0%(+26.4)#1,128 |
| 31. | Belle Rive | 36.3% | 11.6%(+24.7)#31 | 10.0%(+26.3)#1,136 |
| 32. | Martinton | 36.1% | 11.6%(+24.4)#32 | 10.0%(+26.1)#1,159 |
| 33. | Basco | 35.7% | 11.6%(+24.1)#33 | 10.0%(+25.7)#1,201 |
| 34. | Olive Branch | 35.6% | 11.6%(+24.0)#34 | 10.0%(+25.6)#1,209 |
| 35. | Beardstown | 35.5% | 11.6%(+23.9)#35 | 10.0%(+25.5)#1,222 |
| 36. | Apple River | 35.3% | 11.6%(+23.7)#36 | 10.0%(+25.3)#1,256 |
| 37. | Lake Ka Ho | 34.8% | 11.6%(+23.2)#37 | 10.0%(+24.8)#1,301 |
| 38. | Wilton Center | 34.7% | 11.6%(+23.1)#38 | 10.0%(+24.7)#1,321 |
| 39. | Onarga | 34.2% | 11.6%(+22.6)#39 | 10.0%(+24.3)#1,382 |
| 40. | Lawrence | 34.2% | 11.6%(+22.5)#40 | 10.0%(+24.2)#1,392 |
| 41. | Ashley | 34.0% | 11.6%(+22.4)#41 | 10.0%(+24.0)#1,416 |
| 42. | Argyle | 34.0% | 11.6%(+22.3)#42 | 10.0%(+24.0)#1,425 |
| 43. | Nelson | 33.9% | 11.6%(+22.3)#43 | 10.0%(+23.9)#1,430 |
| 44. | Olivet | 33.8% | 11.6%(+22.1)#44 | 10.0%(+23.8)#1,444 |
| 45. | Banner | 33.3% | 11.6%(+21.7)#45 | 10.0%(+23.3)#1,502 |
| 46. | West Point | 32.2% | 11.6%(+20.6)#46 | 10.0%(+22.2)#1,658 |
| 47. | Harvard | 32.0% | 11.6%(+20.4)#47 | 10.0%(+22.0)#1,685 |
| 48. | Tennessee | 31.9% | 11.6%(+20.3)#48 | 10.0%(+22.0)#1,705 |
| 49. | Albion | 31.7% | 11.6%(+20.1)#49 | 10.0%(+21.7)#1,740 |
| 50. | Lima | 31.7% | 11.6%(+20.1)#50 | 10.0%(+21.7)#1,745 |
| 51. | Savanna | 31.6% | 11.6%(+20.0)#51 | 10.0%(+21.6)#1,767 |
| 52. | Iuka | 31.6% | 11.6%(+19.9)#52 | 10.0%(+21.6)#1,770 |
| 53. | Trilla | 31.6% | 11.6%(+19.9)#53 | 10.0%(+21.6)#1,775 |
| 54. | Nachusa | 31.4% | 11.6%(+19.8)#54 | 10.0%(+21.4)#1,802 |
| 55. | Rapids City | 30.9% | 11.6%(+19.3)#55 | 10.0%(+21.0)#1,880 |
| 56. | Albany | 30.9% | 11.6%(+19.3)#56 | 10.0%(+20.9)#1,887 |
| 57. | Stone Park | 30.8% | 11.6%(+19.1)#57 | 10.0%(+20.8)#1,920 |
| 58. | Hammond | 30.7% | 11.6%(+19.1)#58 | 10.0%(+20.7)#1,924 |
| 59. | Hindsboro | 30.5% | 11.6%(+18.8)#59 | 10.0%(+20.5)#1,985 |
| 60. | Wilsonville | 30.1% | 11.6%(+18.5)#60 | 10.0%(+20.1)#2,051 |
| 61. | Du Bois | 30.0% | 11.6%(+18.4)#61 | 10.0%(+20.0)#2,073 |
| 62. | Stockton | 29.8% | 11.6%(+18.2)#62 | 10.0%(+19.8)#2,106 |
| 63. | Flora | 29.7% | 11.6%(+18.0)#63 | 10.0%(+19.7)#2,133 |
| 64. | Mount Erie | 29.7% | 11.6%(+18.0)#64 | 10.0%(+19.7)#2,135 |
| 65. | Radom | 29.6% | 11.6%(+17.9)#65 | 10.0%(+19.6)#2,156 |
| 66. | Campus | 29.4% | 11.6%(+17.8)#66 | 10.0%(+19.4)#2,186 |
| 67. | Waggoner | 29.2% | 11.6%(+17.6)#67 | 10.0%(+19.2)#2,234 |
| 68. | Spring Bay | 29.1% | 11.6%(+17.5)#68 | 10.0%(+19.1)#2,254 |
| 69. | Sims | 29.1% | 11.6%(+17.5)#69 | 10.0%(+19.1)#2,256 |
| 70. | Sandoval | 29.1% | 11.6%(+17.4)#70 | 10.0%(+19.1)#2,267 |
| 71. | Lanark | 29.0% | 11.6%(+17.3)#71 | 10.0%(+19.0)#2,286 |
| 72. | Hopkins Park | 28.9% | 11.6%(+17.3)#72 | 10.0%(+19.0)#2,299 |
| 73. | Fulton | 28.9% | 11.6%(+17.3)#73 | 10.0%(+19.0)#2,302 |
| 74. | New Minden | 28.7% | 11.6%(+17.0)#74 | 10.0%(+18.7)#2,360 |
| 75. | Sullivan | 28.7% | 11.6%(+17.0)#75 | 10.0%(+18.7)#2,362 |
| 76. | Muddy | 28.6% | 11.6%(+16.9)#76 | 10.0%(+18.6)#2,407 |
| 77. | Meredosia | 28.3% | 11.6%(+16.6)#77 | 10.0%(+18.3)#2,483 |
| 78. | Stronghurst | 28.2% | 11.6%(+16.5)#78 | 10.0%(+18.2)#2,503 |
| 79. | Anchor | 28.1% | 11.6%(+16.5)#79 | 10.0%(+18.1)#2,525 |
| 80. | Forrest | 28.1% | 11.6%(+16.4)#80 | 10.0%(+18.1)#2,538 |
| 81. | Liverpool | 27.9% | 11.6%(+16.3)#81 | 10.0%(+17.9)#2,578 |
| 82. | Momence | 27.9% | 11.6%(+16.2)#82 | 10.0%(+17.9)#2,583 |
| 83. | Dallas City | 27.8% | 11.6%(+16.2)#83 | 10.0%(+17.8)#2,593 |
| 84. | New Haven | 27.7% | 11.6%(+16.1)#84 | 10.0%(+17.7)#2,626 |
| 85. | Polo | 27.5% | 11.6%(+15.9)#85 | 10.0%(+17.5)#2,680 |
| 86. | Keensburg | 27.5% | 11.6%(+15.9)#86 | 10.0%(+17.5)#2,687 |
| 87. | Henning | 27.5% | 11.6%(+15.8)#87 | 10.0%(+17.5)#2,700 |
| 88. | Cisne | 27.3% | 11.6%(+15.6)#88 | 10.0%(+17.3)#2,765 |
| 89. | Round Lake Park | 27.0% | 11.6%(+15.3)#89 | 10.0%(+17.0)#2,863 |
| 90. | Butler | 26.9% | 11.6%(+15.3)#90 | 10.0%(+16.9)#2,875 |
| 91. | Jewett | 26.9% | 11.6%(+15.3)#91 | 10.0%(+16.9)#2,876 |
| 92. | New Bedford | 26.9% | 11.6%(+15.3)#92 | 10.0%(+16.9)#2,882 |
| 93. | Willowbrook | 26.8% | 11.6%(+15.1)#93 | 10.0%(+16.8)#2,910 |
| 94. | Oakland | 26.7% | 11.6%(+15.0)#94 | 10.0%(+16.7)#2,945 |
| 95. | Cleveland | 26.6% | 11.6%(+14.9)#95 | 10.0%(+16.6)#2,972 |
| 96. | Bone Gap | 26.6% | 11.6%(+14.9)#96 | 10.0%(+16.6)#2,975 |
| 97. | Galva | 26.6% | 11.6%(+14.9)#97 | 10.0%(+16.6)#2,977 |
| 98. | Symerton | 26.5% | 11.6%(+14.8)#98 | 10.0%(+16.5)#2,999 |
| 99. | Wonder Lake | 26.5% | 11.6%(+14.8)#99 | 10.0%(+16.5)#3,001 |
| 100. | Grafton | 26.4% | 11.6%(+14.8)#100 | 10.0%(+16.4)#3,011 |
Common Questions
What are the Top 10 Cities with the Highest Percentage of Population Employed in Manufacturing in Illinois?
Top 10 Cities with the Highest Percentage of Population Employed in Manufacturing in Illinois are:
#1
100.0%
#2
82.5%
#3
56.7%
#4
51.9%
#5
44.4%
#6
43.1%
#7
42.9%
#8
42.5%
#9
41.5%
#10
41.4%
What city has the Highest Percentage of Population Employed in Manufacturing in Illinois?
Westervelt has the Highest Percentage of Population Employed in Manufacturing in Illinois with 100.0%.
What is the Percentage of Population Employed in Manufacturing in the State of Illinois?
Percentage of Population Employed in Manufacturing in Illinois is 11.6%.
What is the Percentage of Population Employed in Manufacturing in the United States?
Percentage of Population Employed in Manufacturing in the United States is 10.0%.