Cities with the Highest Percentage of Population Employed in Information in Illinois
RELATED REPORTS & OPTIONS
Information & Technology
Illinois
Compare Cities
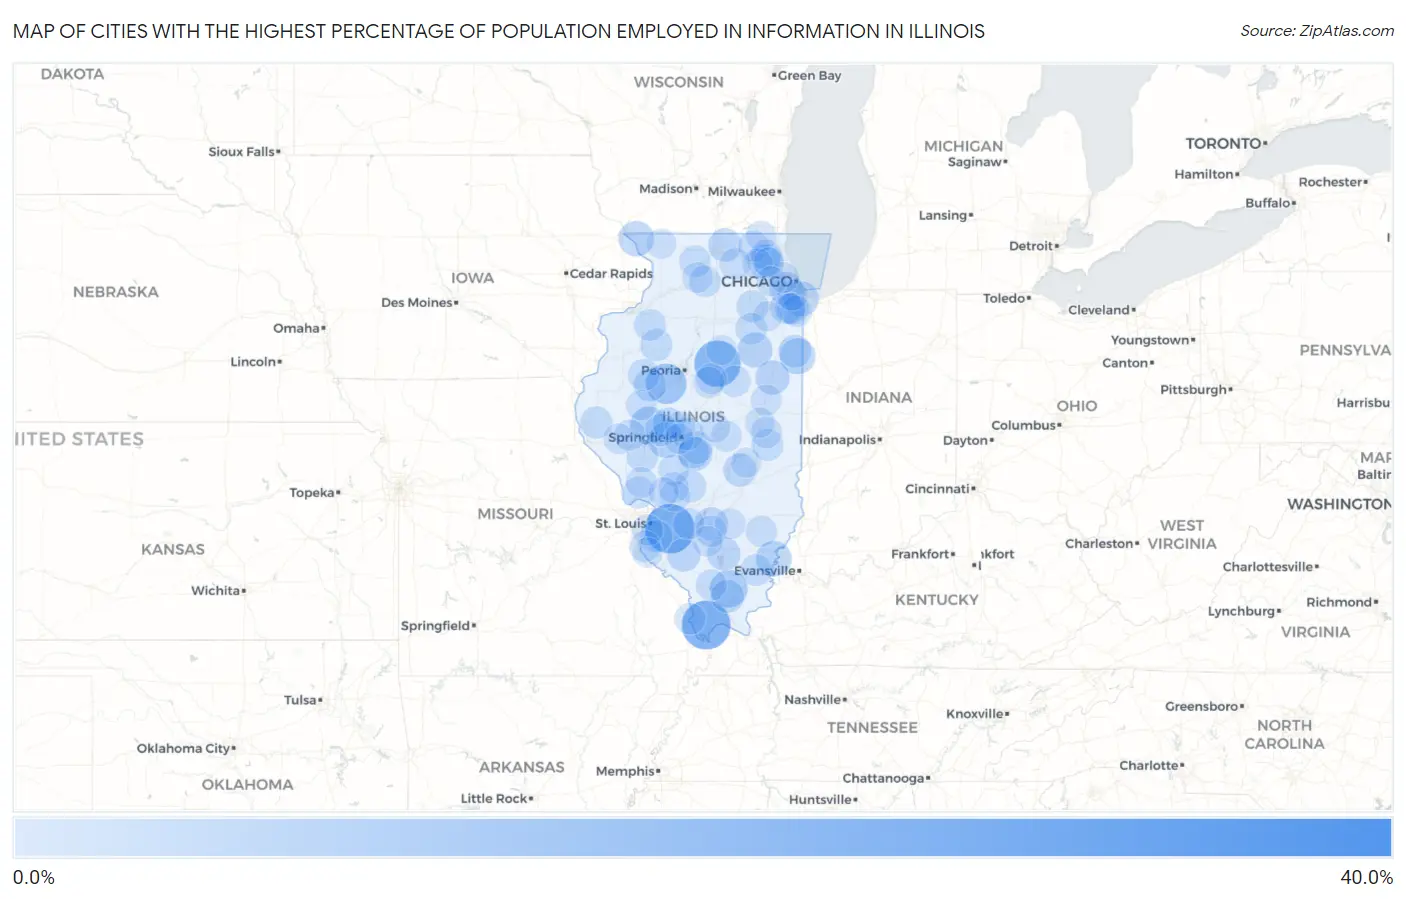
Map of Cities with the Highest Percentage of Population Employed in Information in Illinois
0.0%
40.0%
Cities with the Highest Percentage of Population Employed in Information in Illinois
| City | % Employed | vs State | vs National | |
| 1. | Merritt | 35.3% | 1.7%(+33.6)#1 | 1.9%(+33.4)#44 |
| 2. | Scott Afb | 23.3% | 1.7%(+21.6)#2 | 1.9%(+21.4)#82 |
| 3. | Pulaski | 22.5% | 1.7%(+20.8)#3 | 1.9%(+20.6)#88 |
| 4. | Panola | 20.0% | 1.7%(+18.3)#4 | 1.9%(+18.1)#111 |
| 5. | Argyle | 14.9% | 1.7%(+13.1)#5 | 1.9%(+13.0)#193 |
| 6. | Plum Valley | 14.1% | 1.7%(+12.4)#6 | 1.9%(+12.2)#219 |
| 7. | Banner | 14.0% | 1.7%(+12.3)#7 | 1.9%(+12.1)#221 |
| 8. | Crab Orchard | 11.1% | 1.7%(+9.40)#8 | 1.9%(+9.21)#326 |
| 9. | Virginia | 10.3% | 1.7%(+8.61)#9 | 1.9%(+8.42)#367 |
| 10. | Sunnyland | 9.8% | 1.7%(+8.05)#10 | 1.9%(+7.86)#417 |
| 11. | Paloma | 9.4% | 1.7%(+7.71)#11 | 1.9%(+7.51)#445 |
| 12. | Donovan | 9.3% | 1.7%(+7.60)#12 | 1.9%(+7.40)#451 |
| 13. | Berlin | 9.1% | 1.7%(+7.38)#13 | 1.9%(+7.19)#472 |
| 14. | Phillipstown | 9.1% | 1.7%(+7.38)#14 | 1.9%(+7.19)#476 |
| 15. | Galena | 8.7% | 1.7%(+6.99)#15 | 1.9%(+6.79)#513 |
| 16. | Burnham | 8.5% | 1.7%(+6.83)#16 | 1.9%(+6.63)#522 |
| 17. | Emington | 8.3% | 1.7%(+6.63)#17 | 1.9%(+6.43)#540 |
| 18. | Jeisyville | 7.7% | 1.7%(+5.99)#18 | 1.9%(+5.79)#624 |
| 19. | Buckley | 7.7% | 1.7%(+5.95)#19 | 1.9%(+5.75)#629 |
| 20. | Bedford Park | 6.9% | 1.7%(+5.20)#20 | 1.9%(+5.01)#794 |
| 21. | Bonnie | 6.8% | 1.7%(+5.06)#21 | 1.9%(+4.86)#821 |
| 22. | Strasburg | 6.7% | 1.7%(+4.96)#22 | 1.9%(+4.77)#836 |
| 23. | Timberlane | 6.7% | 1.7%(+4.95)#23 | 1.9%(+4.76)#845 |
| 24. | Sandoval | 6.6% | 1.7%(+4.85)#24 | 1.9%(+4.65)#874 |
| 25. | Creal Springs | 6.5% | 1.7%(+4.79)#25 | 1.9%(+4.60)#882 |
| 26. | Coulterville | 6.5% | 1.7%(+4.76)#26 | 1.9%(+4.57)#886 |
| 27. | Barrington Hills | 6.4% | 1.7%(+4.66)#27 | 1.9%(+4.47)#911 |
| 28. | Edinburg | 6.2% | 1.7%(+4.52)#28 | 1.9%(+4.33)#959 |
| 29. | Frankfort Square | 6.1% | 1.7%(+4.38)#29 | 1.9%(+4.19)#1,001 |
| 30. | Riverton | 6.1% | 1.7%(+4.37)#30 | 1.9%(+4.17)#1,003 |
| 31. | Cuba | 6.0% | 1.7%(+4.27)#31 | 1.9%(+4.08)#1,042 |
| 32. | Beaverville | 5.9% | 1.7%(+4.21)#32 | 1.9%(+4.02)#1,058 |
| 33. | Ashland | 5.8% | 1.7%(+4.10)#33 | 1.9%(+3.91)#1,097 |
| 34. | Victoria | 5.8% | 1.7%(+4.09)#34 | 1.9%(+3.90)#1,101 |
| 35. | Lake Petersburg | 5.8% | 1.7%(+4.07)#35 | 1.9%(+3.88)#1,105 |
| 36. | Millstadt | 5.8% | 1.7%(+4.05)#36 | 1.9%(+3.86)#1,116 |
| 37. | Taylor Springs | 5.7% | 1.7%(+4.01)#37 | 1.9%(+3.82)#1,131 |
| 38. | Columbus | 5.6% | 1.7%(+3.85)#38 | 1.9%(+3.66)#1,210 |
| 39. | Plattville | 5.4% | 1.7%(+3.73)#39 | 1.9%(+3.54)#1,255 |
| 40. | Campbell's Island | 5.4% | 1.7%(+3.68)#40 | 1.9%(+3.49)#1,268 |
| 41. | Barrington | 5.4% | 1.7%(+3.68)#41 | 1.9%(+3.49)#1,269 |
| 42. | Manchester | 5.4% | 1.7%(+3.67)#42 | 1.9%(+3.48)#1,277 |
| 43. | Ellisville | 5.3% | 1.7%(+3.56)#43 | 1.9%(+3.36)#1,338 |
| 44. | Mazon | 5.2% | 1.7%(+3.45)#44 | 1.9%(+3.26)#1,376 |
| 45. | Hindsboro | 5.2% | 1.7%(+3.44)#45 | 1.9%(+3.25)#1,381 |
| 46. | Cambridge | 5.1% | 1.7%(+3.43)#46 | 1.9%(+3.24)#1,387 |
| 47. | Norris City | 5.1% | 1.7%(+3.40)#47 | 1.9%(+3.20)#1,410 |
| 48. | Olympia Fields | 5.0% | 1.7%(+3.33)#48 | 1.9%(+3.14)#1,449 |
| 49. | Leaf River | 5.0% | 1.7%(+3.29)#49 | 1.9%(+3.10)#1,467 |
| 50. | Otterville | 5.0% | 1.7%(+3.29)#50 | 1.9%(+3.10)#1,472 |
| 51. | Kincaid | 4.9% | 1.7%(+3.20)#51 | 1.9%(+3.01)#1,532 |
| 52. | Ashton | 4.9% | 1.7%(+3.18)#52 | 1.9%(+2.99)#1,543 |
| 53. | South Chicago Heights | 4.7% | 1.7%(+3.01)#53 | 1.9%(+2.82)#1,634 |
| 54. | Cooksville | 4.7% | 1.7%(+3.00)#54 | 1.9%(+2.81)#1,638 |
| 55. | Valmeyer | 4.7% | 1.7%(+3.00)#55 | 1.9%(+2.80)#1,642 |
| 56. | Genoa | 4.7% | 1.7%(+2.99)#56 | 1.9%(+2.79)#1,647 |
| 57. | Centralia | 4.7% | 1.7%(+2.99)#57 | 1.9%(+2.79)#1,648 |
| 58. | East Carondelet | 4.7% | 1.7%(+2.98)#58 | 1.9%(+2.79)#1,650 |
| 59. | Mount Erie | 4.7% | 1.7%(+2.98)#59 | 1.9%(+2.79)#1,652 |
| 60. | Villa Grove | 4.7% | 1.7%(+2.97)#60 | 1.9%(+2.77)#1,659 |
| 61. | Danvers | 4.6% | 1.7%(+2.92)#61 | 1.9%(+2.72)#1,703 |
| 62. | Alvan | 4.6% | 1.7%(+2.89)#62 | 1.9%(+2.70)#1,722 |
| 63. | East Cape Girardeau | 4.6% | 1.7%(+2.88)#63 | 1.9%(+2.69)#1,729 |
| 64. | Breese | 4.6% | 1.7%(+2.87)#64 | 1.9%(+2.68)#1,734 |
| 65. | Bull Valley | 4.5% | 1.7%(+2.82)#65 | 1.9%(+2.63)#1,764 |
| 66. | Carman | 4.5% | 1.7%(+2.80)#66 | 1.9%(+2.61)#1,776 |
| 67. | Standard City | 4.5% | 1.7%(+2.77)#67 | 1.9%(+2.58)#1,799 |
| 68. | Cambria | 4.5% | 1.7%(+2.75)#68 | 1.9%(+2.55)#1,818 |
| 69. | Meredosia | 4.4% | 1.7%(+2.73)#69 | 1.9%(+2.53)#1,840 |
| 70. | Long Creek | 4.4% | 1.7%(+2.66)#70 | 1.9%(+2.47)#1,888 |
| 71. | Gulfport | 4.3% | 1.7%(+2.64)#71 | 1.9%(+2.45)#1,911 |
| 72. | Merrionette Park | 4.3% | 1.7%(+2.59)#72 | 1.9%(+2.40)#1,943 |
| 73. | Lake Barrington | 4.3% | 1.7%(+2.58)#73 | 1.9%(+2.39)#1,962 |
| 74. | Lost Nation | 4.3% | 1.7%(+2.56)#74 | 1.9%(+2.37)#1,969 |
| 75. | Williamson | 4.2% | 1.7%(+2.52)#75 | 1.9%(+2.33)#2,017 |
| 76. | Matteson | 4.2% | 1.7%(+2.51)#76 | 1.9%(+2.32)#2,023 |
| 77. | Carlock | 4.2% | 1.7%(+2.51)#77 | 1.9%(+2.32)#2,031 |
| 78. | Kane | 4.2% | 1.7%(+2.46)#78 | 1.9%(+2.27)#2,070 |
| 79. | Rantoul | 4.2% | 1.7%(+2.45)#79 | 1.9%(+2.26)#2,087 |
| 80. | Eagarville | 4.1% | 1.7%(+2.40)#80 | 1.9%(+2.21)#2,118 |
| 81. | Iuka | 4.1% | 1.7%(+2.39)#81 | 1.9%(+2.20)#2,133 |
| 82. | Ridgewood | 4.1% | 1.7%(+2.38)#82 | 1.9%(+2.19)#2,143 |
| 83. | Perry | 4.0% | 1.7%(+2.33)#83 | 1.9%(+2.13)#2,196 |
| 84. | Astoria | 4.0% | 1.7%(+2.29)#84 | 1.9%(+2.10)#2,217 |
| 85. | Spring Grove | 4.0% | 1.7%(+2.27)#85 | 1.9%(+2.08)#2,245 |
| 86. | Richview | 4.0% | 1.7%(+2.25)#86 | 1.9%(+2.06)#2,268 |
| 87. | Bunker Hill | 3.9% | 1.7%(+2.21)#87 | 1.9%(+2.02)#2,313 |
| 88. | River Grove | 3.9% | 1.7%(+2.20)#88 | 1.9%(+2.01)#2,331 |
| 89. | West Dundee | 3.8% | 1.7%(+2.14)#89 | 1.9%(+1.95)#2,403 |
| 90. | Leland Grove | 3.8% | 1.7%(+2.07)#90 | 1.9%(+1.88)#2,492 |
| 91. | Warrensburg | 3.7% | 1.7%(+2.00)#91 | 1.9%(+1.81)#2,573 |
| 92. | Inverness | 3.7% | 1.7%(+1.96)#92 | 1.9%(+1.76)#2,633 |
| 93. | Tolono | 3.6% | 1.7%(+1.93)#93 | 1.9%(+1.74)#2,663 |
| 94. | Elwood | 3.6% | 1.7%(+1.93)#94 | 1.9%(+1.74)#2,668 |
| 95. | Dana | 3.6% | 1.7%(+1.93)#95 | 1.9%(+1.74)#2,673 |
| 96. | Gays | 3.6% | 1.7%(+1.91)#96 | 1.9%(+1.72)#2,695 |
| 97. | Cantrall | 3.6% | 1.7%(+1.91)#97 | 1.9%(+1.72)#2,697 |
| 98. | Maeystown | 3.6% | 1.7%(+1.86)#98 | 1.9%(+1.67)#2,751 |
| 99. | Stockton | 3.5% | 1.7%(+1.82)#99 | 1.9%(+1.63)#2,797 |
| 100. | Glen Ellyn | 3.5% | 1.7%(+1.82)#100 | 1.9%(+1.62)#2,804 |
Common Questions
What are the Top 10 Cities with the Highest Percentage of Population Employed in Information in Illinois?
Top 10 Cities with the Highest Percentage of Population Employed in Information in Illinois are:
#1
23.3%
#2
22.5%
#3
20.0%
#4
14.0%
#5
11.1%
#6
10.3%
#7
9.3%
#8
9.1%
#9
9.1%
#10
8.7%
What city has the Highest Percentage of Population Employed in Information in Illinois?
Scott AFB has the Highest Percentage of Population Employed in Information in Illinois with 23.3%.
What is the Percentage of Population Employed in Information in the State of Illinois?
Percentage of Population Employed in Information in Illinois is 1.7%.
What is the Percentage of Population Employed in Information in the United States?
Percentage of Population Employed in Information in the United States is 1.9%.