Cities with the Highest Percentage of Population Employed in Finance & Insurance in Illinois
RELATED REPORTS & OPTIONS
Finance & Insurance
Illinois
Compare Cities
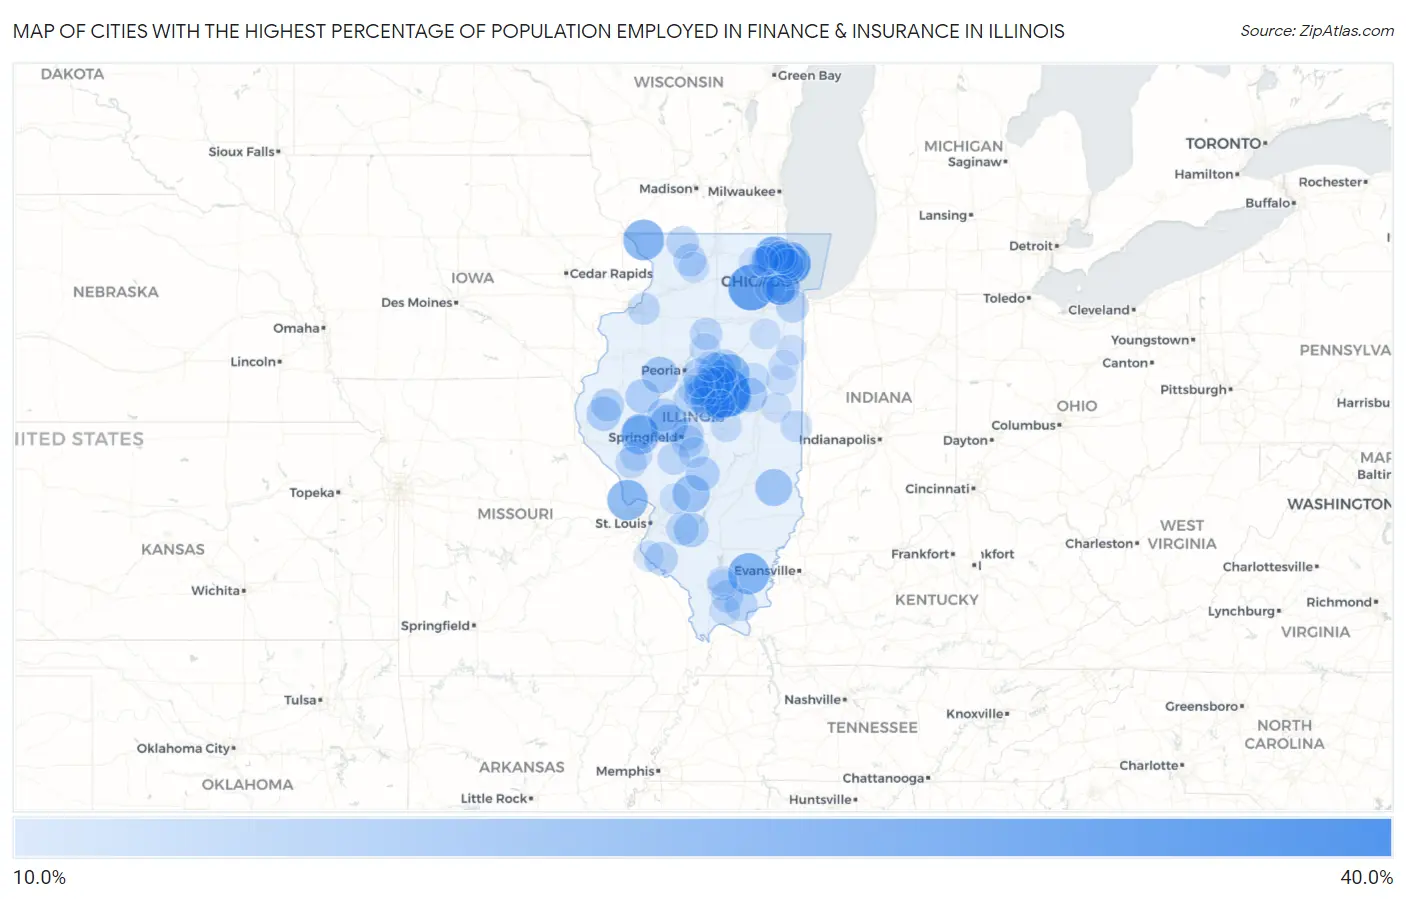
Map of Cities with the Highest Percentage of Population Employed in Finance & Insurance in Illinois
0.0%
40.0%
Cities with the Highest Percentage of Population Employed in Finance & Insurance in Illinois
| City | % Employed | vs State | vs National | |
| 1. | Trilla | 34.2% | 5.7%(+28.5)#1 | 4.8%(+29.4)#111 |
| 2. | Downs | 34.0% | 5.7%(+28.3)#2 | 4.8%(+29.2)#113 |
| 3. | Prestbury | 29.3% | 5.7%(+23.7)#3 | 4.8%(+24.6)#165 |
| 4. | Winnetka | 23.8% | 5.7%(+18.1)#4 | 4.8%(+19.0)#242 |
| 5. | Broughton | 23.5% | 5.7%(+17.9)#5 | 4.8%(+18.8)#246 |
| 6. | The Galena Territory | 23.1% | 5.7%(+17.4)#6 | 4.8%(+18.3)#261 |
| 7. | Brussels | 22.6% | 5.7%(+16.9)#7 | 4.8%(+17.8)#274 |
| 8. | Le Roy | 21.9% | 5.7%(+16.2)#8 | 4.8%(+17.1)#292 |
| 9. | Long Grove | 21.7% | 5.7%(+16.0)#9 | 4.8%(+16.9)#303 |
| 10. | Lexington | 21.0% | 5.7%(+15.3)#10 | 4.8%(+16.2)#327 |
| 11. | Kenilworth | 20.8% | 5.7%(+15.2)#11 | 4.8%(+16.1)#331 |
| 12. | Heyworth | 20.8% | 5.7%(+15.2)#12 | 4.8%(+16.1)#332 |
| 13. | Bloomington | 20.7% | 5.7%(+15.0)#13 | 4.8%(+15.9)#336 |
| 14. | Concord | 20.5% | 5.7%(+14.8)#14 | 4.8%(+15.7)#345 |
| 15. | Lake Petersburg | 19.7% | 5.7%(+14.0)#15 | 4.8%(+14.9)#387 |
| 16. | Western Springs | 19.3% | 5.7%(+13.7)#16 | 4.8%(+14.6)#405 |
| 17. | Kappa | 19.0% | 5.7%(+13.3)#17 | 4.8%(+14.2)#418 |
| 18. | Waynesville | 18.8% | 5.7%(+13.2)#18 | 4.8%(+14.1)#425 |
| 19. | Donnellson | 18.8% | 5.7%(+13.1)#19 | 4.8%(+14.0)#427 |
| 20. | Yale | 18.4% | 5.7%(+12.7)#20 | 4.8%(+13.7)#441 |
| 21. | Glencoe | 18.1% | 5.7%(+12.4)#21 | 4.8%(+13.3)#466 |
| 22. | Twin Grove | 17.9% | 5.7%(+12.2)#22 | 4.8%(+13.1)#472 |
| 23. | Blairsville | 17.9% | 5.7%(+12.2)#23 | 4.8%(+13.1)#473 |
| 24. | Preemption | 17.7% | 5.7%(+12.1)#24 | 4.8%(+13.0)#485 |
| 25. | Norris | 17.5% | 5.7%(+11.8)#25 | 4.8%(+12.7)#496 |
| 26. | Lane | 17.2% | 5.7%(+11.5)#26 | 4.8%(+12.4)#509 |
| 27. | Lowpoint | 16.7% | 5.7%(+11.0)#27 | 4.8%(+11.9)#542 |
| 28. | Hudson | 16.4% | 5.7%(+10.7)#28 | 4.8%(+11.6)#562 |
| 29. | Arenzville | 16.3% | 5.7%(+10.6)#29 | 4.8%(+11.5)#572 |
| 30. | Inverness | 15.6% | 5.7%(+9.91)#30 | 4.8%(+10.8)#632 |
| 31. | Bartelso | 15.4% | 5.7%(+9.77)#31 | 4.8%(+10.7)#648 |
| 32. | Golden | 15.4% | 5.7%(+9.71)#32 | 4.8%(+10.6)#654 |
| 33. | Foosland | 15.4% | 5.7%(+9.71)#33 | 4.8%(+10.6)#660 |
| 34. | Ipava | 15.2% | 5.7%(+9.47)#34 | 4.8%(+10.4)#680 |
| 35. | Nokomis | 15.1% | 5.7%(+9.43)#35 | 4.8%(+10.3)#686 |
| 36. | Hinsdale | 15.1% | 5.7%(+9.39)#36 | 4.8%(+10.3)#692 |
| 37. | Golf | 14.8% | 5.7%(+9.09)#37 | 4.8%(+10.0)#722 |
| 38. | Gridley | 14.3% | 5.7%(+8.63)#38 | 4.8%(+9.54)#773 |
| 39. | Deer Creek | 14.0% | 5.7%(+8.30)#39 | 4.8%(+9.21)#841 |
| 40. | Ruma | 14.0% | 5.7%(+8.30)#40 | 4.8%(+9.21)#843 |
| 41. | Augusta | 13.9% | 5.7%(+8.21)#41 | 4.8%(+9.12)#849 |
| 42. | Emden | 13.9% | 5.7%(+8.19)#42 | 4.8%(+9.11)#851 |
| 43. | Oakford | 13.9% | 5.7%(+8.18)#43 | 4.8%(+9.09)#853 |
| 44. | Adeline | 13.6% | 5.7%(+7.96)#44 | 4.8%(+8.87)#881 |
| 45. | Flossmoor | 13.6% | 5.7%(+7.91)#45 | 4.8%(+8.83)#888 |
| 46. | Albers | 13.6% | 5.7%(+7.90)#46 | 4.8%(+8.81)#893 |
| 47. | Stanford | 13.5% | 5.7%(+7.84)#47 | 4.8%(+8.76)#906 |
| 48. | Cedarville | 13.5% | 5.7%(+7.83)#48 | 4.8%(+8.74)#908 |
| 49. | Kildeer | 13.4% | 5.7%(+7.74)#49 | 4.8%(+8.65)#919 |
| 50. | La Grange | 13.4% | 5.7%(+7.73)#50 | 4.8%(+8.64)#923 |
| 51. | Northbrook | 13.4% | 5.7%(+7.69)#51 | 4.8%(+8.60)#928 |
| 52. | Riverwoods | 13.4% | 5.7%(+7.69)#52 | 4.8%(+8.60)#932 |
| 53. | Riverton | 13.3% | 5.7%(+7.65)#53 | 4.8%(+8.56)#941 |
| 54. | Armington | 13.2% | 5.7%(+7.52)#54 | 4.8%(+8.43)#960 |
| 55. | Rochester | 13.1% | 5.7%(+7.42)#55 | 4.8%(+8.33)#979 |
| 56. | Alexander | 13.1% | 5.7%(+7.39)#56 | 4.8%(+8.30)#983 |
| 57. | Eddyville | 13.0% | 5.7%(+7.37)#57 | 4.8%(+8.28)#991 |
| 58. | Wilmette | 13.0% | 5.7%(+7.33)#58 | 4.8%(+8.24)#993 |
| 59. | Creal Springs | 13.0% | 5.7%(+7.31)#59 | 4.8%(+8.22)#998 |
| 60. | Mcnabb | 12.9% | 5.7%(+7.25)#60 | 4.8%(+8.16)#1,005 |
| 61. | Argyle | 12.7% | 5.7%(+7.05)#61 | 4.8%(+7.96)#1,047 |
| 62. | Cleveland | 12.7% | 5.7%(+6.98)#62 | 4.8%(+7.89)#1,062 |
| 63. | Virden | 12.7% | 5.7%(+6.98)#63 | 4.8%(+7.89)#1,063 |
| 64. | Deer Park | 12.6% | 5.7%(+6.97)#64 | 4.8%(+7.88)#1,067 |
| 65. | Alsey | 12.5% | 5.7%(+6.82)#65 | 4.8%(+7.73)#1,093 |
| 66. | Normal | 12.3% | 5.7%(+6.65)#66 | 4.8%(+7.56)#1,148 |
| 67. | Olivet | 12.2% | 5.7%(+6.48)#67 | 4.8%(+7.39)#1,184 |
| 68. | Hawthorn Woods | 12.1% | 5.7%(+6.46)#68 | 4.8%(+7.37)#1,190 |
| 69. | Hillview | 12.1% | 5.7%(+6.39)#69 | 4.8%(+7.30)#1,213 |
| 70. | Sibley | 12.0% | 5.7%(+6.37)#70 | 4.8%(+7.28)#1,220 |
| 71. | Oreana | 11.8% | 5.7%(+6.15)#71 | 4.8%(+7.06)#1,284 |
| 72. | Minier | 11.8% | 5.7%(+6.14)#72 | 4.8%(+7.05)#1,285 |
| 73. | Bulpitt | 11.4% | 5.7%(+5.70)#73 | 4.8%(+6.61)#1,404 |
| 74. | Spillertown | 11.3% | 5.7%(+5.64)#74 | 4.8%(+6.55)#1,421 |
| 75. | La Rose | 11.3% | 5.7%(+5.64)#75 | 4.8%(+6.55)#1,426 |
| 76. | Lake Carroll | 11.3% | 5.7%(+5.63)#76 | 4.8%(+6.54)#1,429 |
| 77. | Mount Morris | 11.3% | 5.7%(+5.62)#77 | 4.8%(+6.53)#1,436 |
| 78. | Livingston | 11.3% | 5.7%(+5.57)#78 | 4.8%(+6.48)#1,448 |
| 79. | Vienna | 11.1% | 5.7%(+5.46)#79 | 4.8%(+6.37)#1,477 |
| 80. | Fults | 11.1% | 5.7%(+5.43)#80 | 4.8%(+6.34)#1,497 |
| 81. | Hopedale | 11.0% | 5.7%(+5.33)#81 | 4.8%(+6.24)#1,529 |
| 82. | Danvers | 10.9% | 5.7%(+5.25)#82 | 4.8%(+6.16)#1,552 |
| 83. | Essex | 10.9% | 5.7%(+5.24)#83 | 4.8%(+6.15)#1,556 |
| 84. | Cissna Park | 10.9% | 5.7%(+5.17)#84 | 4.8%(+6.08)#1,587 |
| 85. | Papineau | 10.7% | 5.7%(+5.04)#85 | 4.8%(+5.95)#1,633 |
| 86. | Lisle | 10.7% | 5.7%(+5.00)#86 | 4.8%(+5.91)#1,642 |
| 87. | Royal | 10.7% | 5.7%(+5.00)#87 | 4.8%(+5.91)#1,643 |
| 88. | Northfield | 10.7% | 5.7%(+4.98)#88 | 4.8%(+5.89)#1,649 |
| 89. | Atlanta | 10.6% | 5.7%(+4.96)#89 | 4.8%(+5.87)#1,656 |
| 90. | Deerfield | 10.6% | 5.7%(+4.95)#90 | 4.8%(+5.86)#1,658 |
| 91. | Barrington | 10.6% | 5.7%(+4.95)#91 | 4.8%(+5.86)#1,659 |
| 92. | Mackinaw | 10.6% | 5.7%(+4.94)#92 | 4.8%(+5.85)#1,662 |
| 93. | Lincolnshire | 10.6% | 5.7%(+4.90)#93 | 4.8%(+5.81)#1,675 |
| 94. | Johnston City | 10.6% | 5.7%(+4.89)#94 | 4.8%(+5.81)#1,676 |
| 95. | Gilberts | 10.6% | 5.7%(+4.88)#95 | 4.8%(+5.79)#1,680 |
| 96. | Wapella | 10.5% | 5.7%(+4.83)#96 | 4.8%(+5.74)#1,705 |
| 97. | Secor | 10.5% | 5.7%(+4.81)#97 | 4.8%(+5.72)#1,711 |
| 98. | Crescent City | 10.5% | 5.7%(+4.78)#98 | 4.8%(+5.69)#1,719 |
| 99. | Burr Ridge | 10.3% | 5.7%(+4.60)#99 | 4.8%(+5.51)#1,787 |
| 100. | Barrington Hills | 10.3% | 5.7%(+4.58)#100 | 4.8%(+5.49)#1,792 |
Common Questions
What are the Top 10 Cities with the Highest Percentage of Population Employed in Finance & Insurance in Illinois?
Top 10 Cities with the Highest Percentage of Population Employed in Finance & Insurance in Illinois are:
#1
34.0%
#2
29.3%
#3
23.8%
#4
23.5%
#5
23.1%
#6
22.6%
#7
21.9%
#8
21.7%
#9
21.0%
#10
20.8%
What city has the Highest Percentage of Population Employed in Finance & Insurance in Illinois?
Downs has the Highest Percentage of Population Employed in Finance & Insurance in Illinois with 34.0%.
What is the Percentage of Population Employed in Finance & Insurance in the State of Illinois?
Percentage of Population Employed in Finance & Insurance in Illinois is 5.7%.
What is the Percentage of Population Employed in Finance & Insurance in the United States?
Percentage of Population Employed in Finance & Insurance in the United States is 4.8%.