Cities with the Highest Percentage of Population Driving Alone to Work in Illinois
RELATED REPORTS & OPTIONS
Drive | Alone
Illinois
Compare Cities
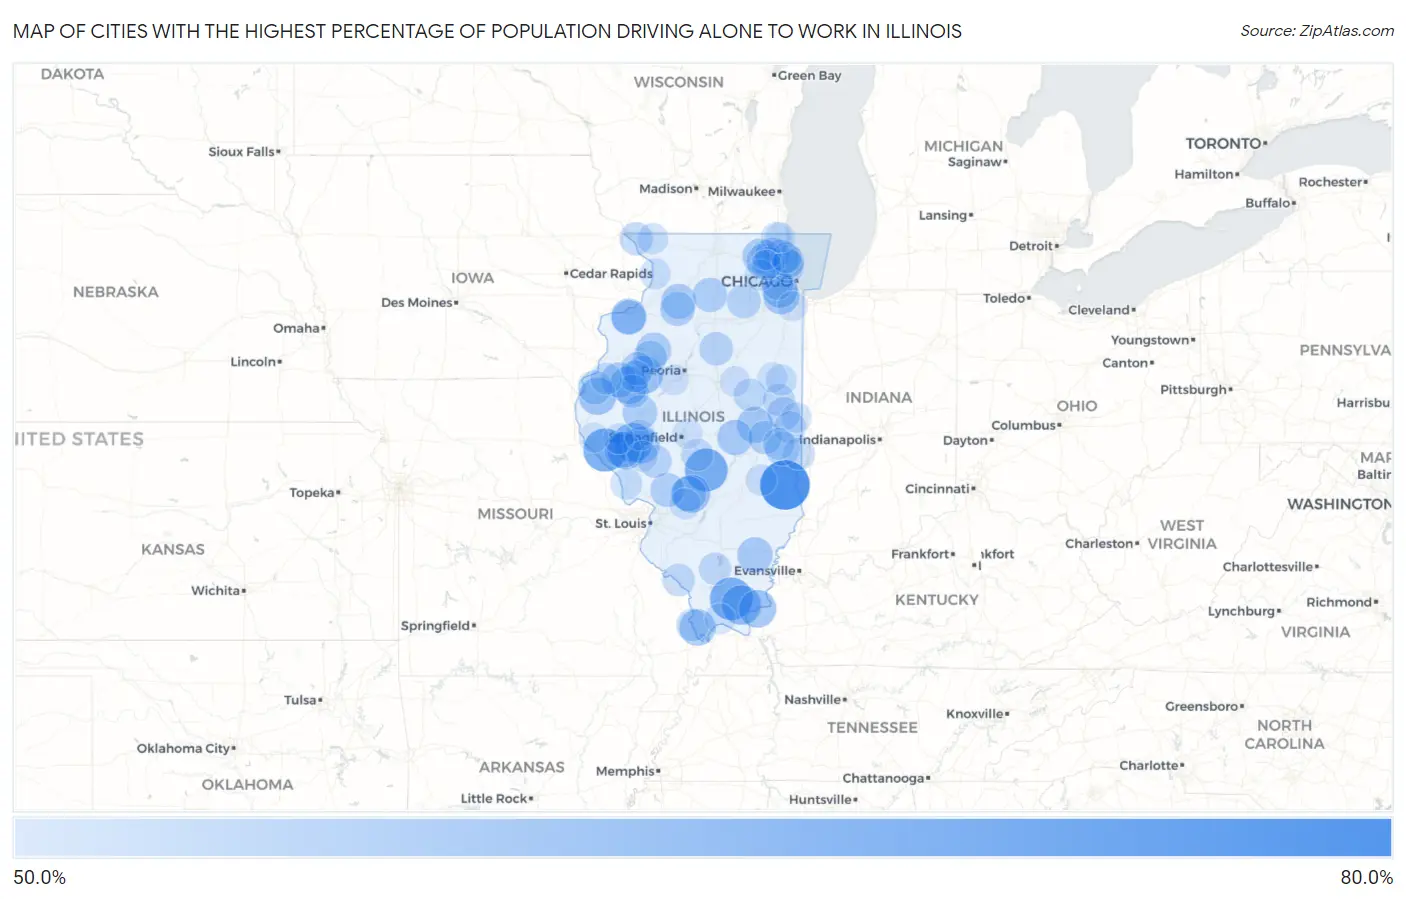
Map of Cities with the Highest Percentage of Population Driving Alone to Work in Illinois
0.0%
80.0%
Cities with the Highest Percentage of Population Driving Alone to Work in Illinois
| City | % Drive Alone | vs State | vs National | |
| 1. | Annapolis | 71.3% | 42.8%(+28.5)#1 | 42.1%(+29.2)#29 |
| 2. | Taylor Ridge | 70.1% | 42.8%(+27.3)#2 | 42.1%(+28.0)#40 |
| 3. | Shirley | 65.3% | 42.8%(+22.5)#3 | 42.1%(+23.2)#143 |
| 4. | El Dara | 64.6% | 42.8%(+21.8)#4 | 42.1%(+22.5)#170 |
| 5. | Ohlman | 64.3% | 42.8%(+21.5)#5 | 42.1%(+22.2)#193 |
| 6. | New Burnside | 64.0% | 42.8%(+21.2)#6 | 42.1%(+21.9)#216 |
| 7. | Burtons Bridge | 63.2% | 42.8%(+20.4)#7 | 42.1%(+21.1)#266 |
| 8. | Carman | 62.9% | 42.8%(+20.1)#8 | 42.1%(+20.8)#291 |
| 9. | East Lynn | 62.4% | 42.8%(+19.6)#9 | 42.1%(+20.3)#325 |
| 10. | Exeter | 60.8% | 42.8%(+18.0)#10 | 42.1%(+18.7)#508 |
| 11. | Eddyville | 60.8% | 42.8%(+18.0)#11 | 42.1%(+18.7)#511 |
| 12. | Florence | 59.5% | 42.8%(+16.7)#12 | 42.1%(+17.4)#713 |
| 13. | Donnellson | 59.3% | 42.8%(+16.5)#13 | 42.1%(+17.2)#756 |
| 14. | Ellisville | 59.3% | 42.8%(+16.5)#14 | 42.1%(+17.2)#763 |
| 15. | Argyle | 59.2% | 42.8%(+16.4)#15 | 42.1%(+17.1)#781 |
| 16. | Bardolph | 59.0% | 42.8%(+16.2)#16 | 42.1%(+16.9)#823 |
| 17. | Elizabethtown | 58.8% | 42.8%(+16.0)#17 | 42.1%(+16.7)#856 |
| 18. | Bentley | 58.5% | 42.8%(+15.7)#18 | 42.1%(+16.4)#926 |
| 19. | Lynnville | 58.1% | 42.8%(+15.3)#19 | 42.1%(+16.0)#1,024 |
| 20. | Detroit | 57.7% | 42.8%(+14.9)#20 | 42.1%(+15.6)#1,105 |
| 21. | Olive Branch | 57.6% | 42.8%(+14.8)#21 | 42.1%(+15.5)#1,112 |
| 22. | Sadorus | 57.5% | 42.8%(+14.7)#22 | 42.1%(+15.4)#1,148 |
| 23. | Palos Park | 57.4% | 42.8%(+14.6)#23 | 42.1%(+15.3)#1,170 |
| 24. | Burr Ridge | 56.9% | 42.8%(+14.1)#24 | 42.1%(+14.8)#1,314 |
| 25. | Oak Grove | 56.7% | 42.8%(+13.9)#25 | 42.1%(+14.6)#1,362 |
| 26. | Laplace | 56.6% | 42.8%(+13.8)#26 | 42.1%(+14.5)#1,387 |
| 27. | Springerton | 56.6% | 42.8%(+13.8)#27 | 42.1%(+14.5)#1,391 |
| 28. | Riverwoods | 56.5% | 42.8%(+13.7)#28 | 42.1%(+14.4)#1,394 |
| 29. | Gulfport | 56.5% | 42.8%(+13.7)#29 | 42.1%(+14.4)#1,437 |
| 30. | Sciota | 56.5% | 42.8%(+13.7)#30 | 42.1%(+14.4)#1,439 |
| 31. | Willow Lake | 56.4% | 42.8%(+13.6)#31 | 42.1%(+14.3)#1,456 |
| 32. | Lake Carroll | 56.4% | 42.8%(+13.6)#32 | 42.1%(+14.3)#1,461 |
| 33. | Trout Valley | 56.3% | 42.8%(+13.5)#33 | 42.1%(+14.2)#1,498 |
| 34. | Panama | 56.3% | 42.8%(+13.5)#34 | 42.1%(+14.2)#1,508 |
| 35. | Oak Run | 56.2% | 42.8%(+13.4)#35 | 42.1%(+14.1)#1,542 |
| 36. | Deer Grove | 56.2% | 42.8%(+13.4)#36 | 42.1%(+14.1)#1,564 |
| 37. | Barrington Hills | 56.1% | 42.8%(+13.3)#37 | 42.1%(+14.0)#1,566 |
| 38. | Browning | 56.0% | 42.8%(+13.2)#38 | 42.1%(+13.9)#1,618 |
| 39. | Coyne Center | 55.8% | 42.8%(+13.0)#39 | 42.1%(+13.7)#1,643 |
| 40. | New Bedford | 55.8% | 42.8%(+13.0)#40 | 42.1%(+13.7)#1,663 |
| 41. | Forest Lake | 55.7% | 42.8%(+12.9)#41 | 42.1%(+13.6)#1,671 |
| 42. | West Brooklyn | 55.6% | 42.8%(+12.8)#42 | 42.1%(+13.5)#1,709 |
| 43. | Adams | 55.6% | 42.8%(+12.8)#43 | 42.1%(+13.5)#1,713 |
| 44. | Dorchester | 55.4% | 42.8%(+12.6)#44 | 42.1%(+13.3)#1,786 |
| 45. | Holcomb | 55.3% | 42.8%(+12.5)#45 | 42.1%(+13.2)#1,819 |
| 46. | Redmon | 55.3% | 42.8%(+12.5)#46 | 42.1%(+13.2)#1,820 |
| 47. | Ferris | 55.2% | 42.8%(+12.4)#47 | 42.1%(+13.1)#1,860 |
| 48. | Millbrook | 55.1% | 42.8%(+12.3)#48 | 42.1%(+13.0)#1,899 |
| 49. | Gilson | 55.0% | 42.8%(+12.2)#49 | 42.1%(+12.9)#1,939 |
| 50. | Golf | 54.8% | 42.8%(+12.0)#50 | 42.1%(+12.7)#1,974 |
| 51. | Camargo | 54.8% | 42.8%(+12.0)#51 | 42.1%(+12.7)#1,975 |
| 52. | Rutland | 54.8% | 42.8%(+12.0)#52 | 42.1%(+12.7)#1,983 |
| 53. | St Augustine | 54.6% | 42.8%(+11.8)#53 | 42.1%(+12.5)#2,064 |
| 54. | Prairietown | 54.5% | 42.8%(+11.7)#54 | 42.1%(+12.4)#2,102 |
| 55. | Galena | 54.4% | 42.8%(+11.6)#55 | 42.1%(+12.3)#2,136 |
| 56. | Adair | 54.4% | 42.8%(+11.6)#56 | 42.1%(+12.3)#2,156 |
| 57. | Muncie | 54.4% | 42.8%(+11.6)#57 | 42.1%(+12.3)#2,163 |
| 58. | Scottville | 54.3% | 42.8%(+11.5)#58 | 42.1%(+12.2)#2,221 |
| 59. | Foosland | 53.8% | 42.8%(+11.0)#59 | 42.1%(+11.7)#2,416 |
| 60. | Rockwood | 53.8% | 42.8%(+11.0)#60 | 42.1%(+11.7)#2,417 |
| 61. | Campbell's Island | 53.6% | 42.8%(+10.8)#61 | 42.1%(+11.5)#2,480 |
| 62. | Thebes | 53.6% | 42.8%(+10.8)#62 | 42.1%(+11.5)#2,481 |
| 63. | Westlake | 53.5% | 42.8%(+10.7)#63 | 42.1%(+11.4)#2,503 |
| 64. | Penfield | 53.5% | 42.8%(+10.7)#64 | 42.1%(+11.4)#2,546 |
| 65. | Indianola | 53.5% | 42.8%(+10.7)#65 | 42.1%(+11.4)#2,547 |
| 66. | Oak Brook | 53.4% | 42.8%(+10.6)#66 | 42.1%(+11.3)#2,581 |
| 67. | North City | 53.4% | 42.8%(+10.6)#67 | 42.1%(+11.3)#2,605 |
| 68. | Vermilion | 53.4% | 42.8%(+10.6)#68 | 42.1%(+11.3)#2,628 |
| 69. | Langleyville | 53.3% | 42.8%(+10.5)#69 | 42.1%(+11.2)#2,679 |
| 70. | Brocton | 53.3% | 42.8%(+10.5)#70 | 42.1%(+11.2)#2,687 |
| 71. | Glencoe | 53.2% | 42.8%(+10.4)#71 | 42.1%(+11.1)#2,702 |
| 72. | Prairie City | 53.2% | 42.8%(+10.4)#72 | 42.1%(+11.1)#2,728 |
| 73. | La Harpe | 53.1% | 42.8%(+10.3)#73 | 42.1%(+11.0)#2,758 |
| 74. | Hardin | 52.8% | 42.8%(+10.0)#74 | 42.1%(+10.7)#2,898 |
| 75. | Inverness | 52.7% | 42.8%(+9.90)#75 | 42.1%(+10.6)#2,930 |
| 76. | Northfield | 52.7% | 42.8%(+9.90)#76 | 42.1%(+10.6)#2,932 |
| 77. | Wayne | 52.4% | 42.8%(+9.60)#77 | 42.1%(+10.3)#3,108 |
| 78. | Cissna Park | 52.4% | 42.8%(+9.60)#78 | 42.1%(+10.3)#3,124 |
| 79. | Apple Canyon Lake | 52.4% | 42.8%(+9.60)#79 | 42.1%(+10.3)#3,127 |
| 80. | Jewett | 52.4% | 42.8%(+9.60)#80 | 42.1%(+10.3)#3,147 |
| 81. | Highland Park | 52.3% | 42.8%(+9.50)#81 | 42.1%(+10.2)#3,161 |
| 82. | Thomson | 52.3% | 42.8%(+9.50)#82 | 42.1%(+10.2)#3,176 |
| 83. | Old Ripley | 52.3% | 42.8%(+9.50)#83 | 42.1%(+10.2)#3,222 |
| 84. | Alvan | 52.2% | 42.8%(+9.40)#84 | 42.1%(+10.1)#3,284 |
| 85. | Concord | 52.2% | 42.8%(+9.40)#85 | 42.1%(+10.1)#3,285 |
| 86. | Manchester | 52.1% | 42.8%(+9.30)#86 | 42.1%(+10.00)#3,346 |
| 87. | Old Mill Creek | 52.1% | 42.8%(+9.30)#87 | 42.1%(+10.00)#3,352 |
| 88. | Karnak | 52.0% | 42.8%(+9.20)#88 | 42.1%(+9.90)#3,392 |
| 89. | Perry | 52.0% | 42.8%(+9.20)#89 | 42.1%(+9.90)#3,397 |
| 90. | Belgium | 51.8% | 42.8%(+9.00)#90 | 42.1%(+9.70)#3,493 |
| 91. | Kingston Mines | 51.8% | 42.8%(+9.00)#91 | 42.1%(+9.70)#3,500 |
| 92. | Literberry | 51.8% | 42.8%(+9.00)#92 | 42.1%(+9.70)#3,506 |
| 93. | Lake Barrington | 51.7% | 42.8%(+8.90)#93 | 42.1%(+9.60)#3,522 |
| 94. | Wadsworth | 51.7% | 42.8%(+8.90)#94 | 42.1%(+9.60)#3,526 |
| 95. | South Barrington | 51.6% | 42.8%(+8.80)#95 | 42.1%(+9.50)#3,579 |
| 96. | Cooksville | 51.6% | 42.8%(+8.80)#96 | 42.1%(+9.50)#3,623 |
| 97. | Flossmoor | 51.5% | 42.8%(+8.70)#97 | 42.1%(+9.40)#3,634 |
| 98. | Buckley | 51.5% | 42.8%(+8.70)#98 | 42.1%(+9.40)#3,671 |
| 99. | Plainville | 51.5% | 42.8%(+8.70)#99 | 42.1%(+9.40)#3,683 |
| 100. | Riverton | 51.4% | 42.8%(+8.60)#100 | 42.1%(+9.30)#3,724 |
Common Questions
What are the Top 10 Cities with the Highest Percentage of Population Driving Alone to Work in Illinois?
Top 10 Cities with the Highest Percentage of Population Driving Alone to Work in Illinois are:
#1
71.3%
#2
64.6%
#3
64.3%
#4
64.0%
#5
60.8%
#6
60.8%
#7
59.5%
#8
59.3%
#9
59.3%
#10
59.0%
What city has the Highest Percentage of Population Driving Alone to Work in Illinois?
Annapolis has the Highest Percentage of Population Driving Alone to Work in Illinois with 71.3%.
What is the Percentage of Population Driving Alone to Work in the State of Illinois?
Percentage of Population Driving Alone to Work in Illinois is 42.8%.
What is the Percentage of Population Driving Alone to Work in the United States?
Percentage of Population Driving Alone to Work in the United States is 42.1%.