Zip Codes with the Highest Percentage of Hispanic or Latino Population in Belleville, IL
RELATED REPORTS & OPTIONS
Hispanic or Latino
Belleville
Compare Zip Codes
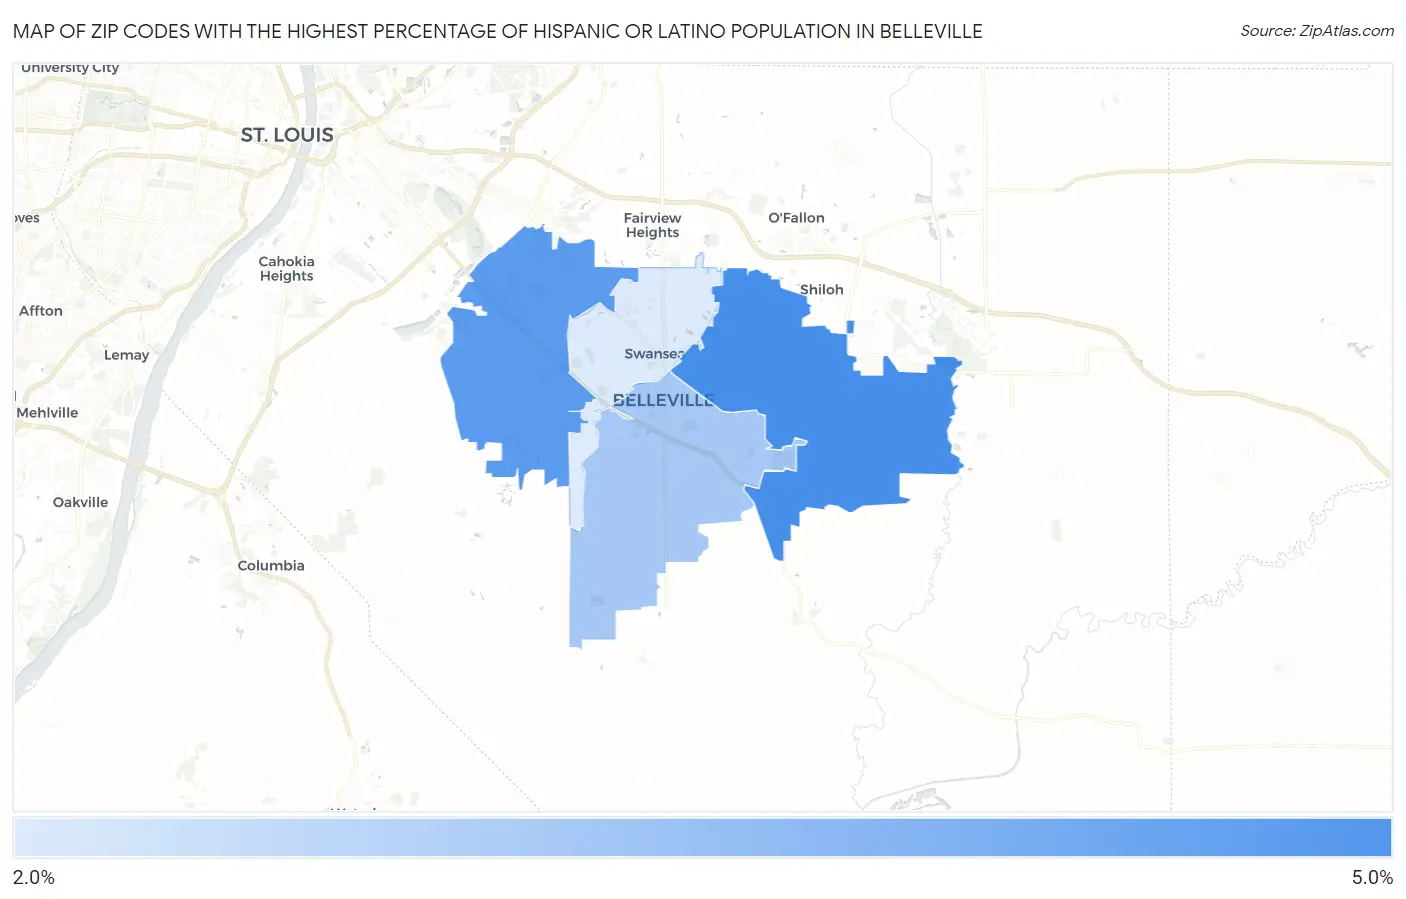
Map of Zip Codes with the Highest Percentage of Hispanic or Latino Population in Belleville
2.9%
4.7%
Zip Codes with the Highest Percentage of Hispanic or Latino Population in Belleville, IL
| Zip Code | Hispanic or Latino | vs State | vs National | |
| 1. | 62221 | 4.7% | 17.8%(-13.1)#529 | 18.7%(-13.9)#14,741 |
| 2. | 62223 | 4.5% | 17.8%(-13.4)#540 | 18.7%(-14.2)#15,194 |
| 3. | 62220 | 3.6% | 17.8%(-14.3)#610 | 18.7%(-15.1)#16,973 |
| 4. | 62226 | 2.9% | 17.8%(-14.9)#691 | 18.7%(-15.7)#18,569 |
1
Common Questions
What are the Top 3 Zip Codes with the Highest Percentage of Hispanic or Latino Population in Belleville, IL?
Top 3 Zip Codes with the Highest Percentage of Hispanic or Latino Population in Belleville, IL are:
What zip code has the Highest Percentage of Hispanic or Latino Population in Belleville, IL?
62221 has the Highest Percentage of Hispanic or Latino Population in Belleville, IL with 4.7%.
What is the Percentage of Hispanic or Latino Population in Belleville, IL?
Percentage of Hispanic or Latino Population in Belleville is 4.2%.
What is the Percentage of Hispanic or Latino Population in Illinois?
Percentage of Hispanic or Latino Population in Illinois is 17.8%.
What is the Percentage of Hispanic or Latino Population in the United States?
Percentage of Hispanic or Latino Population in the United States is 18.7%.