Zip Codes with the Highest Percentage of Population Employed in Transportation & Warehousing in Idaho
RELATED REPORTS & OPTIONS
Transportation & Warehousing
Idaho
Compare Zip Codes
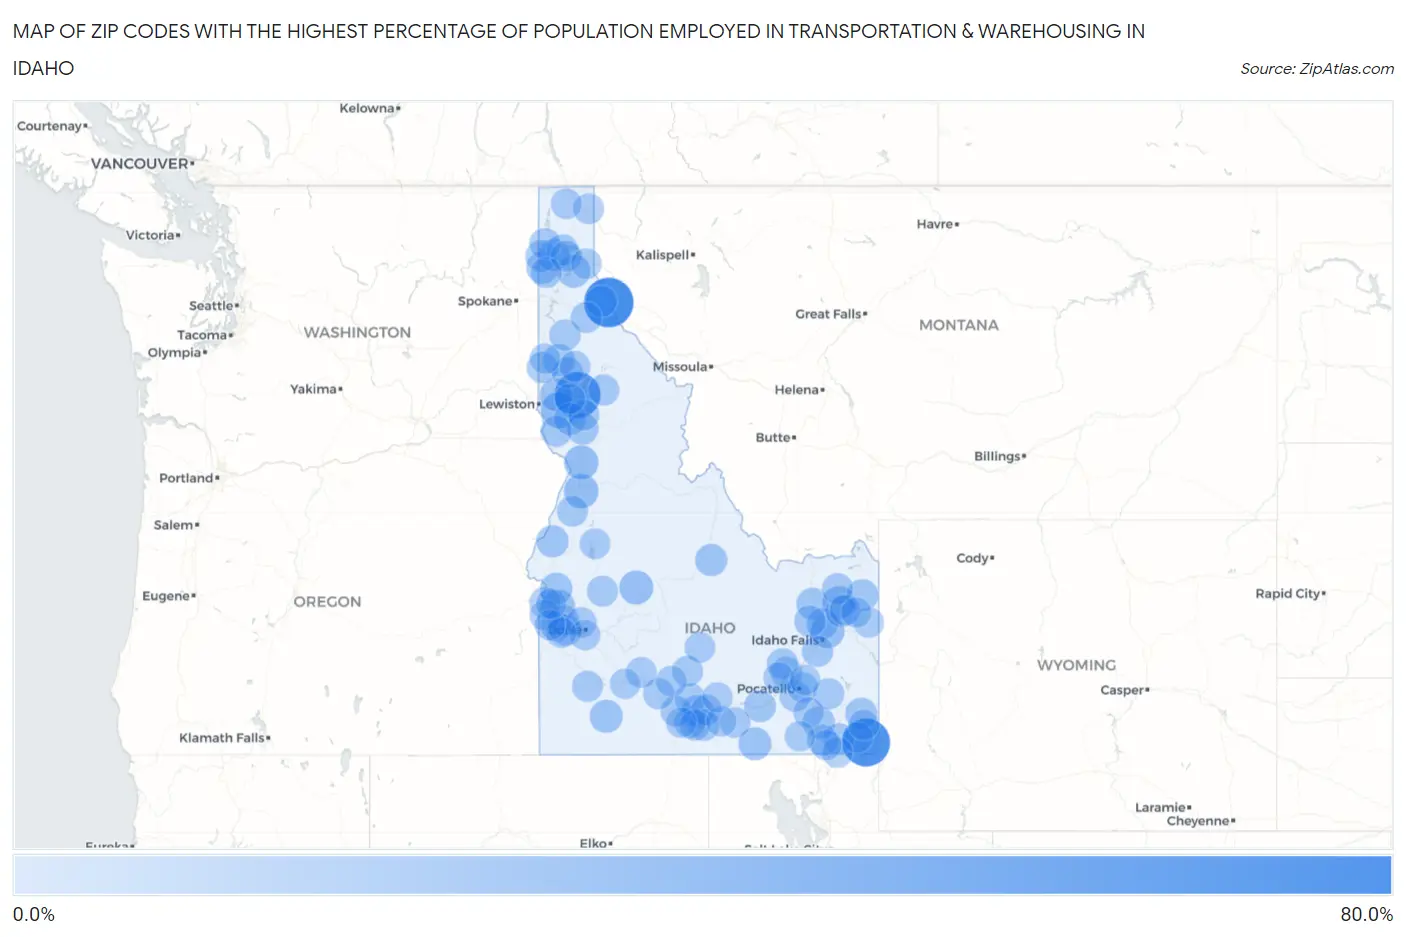
Map of Zip Codes with the Highest Percentage of Population Employed in Transportation & Warehousing in Idaho
0.0%
80.0%
Zip Codes with the Highest Percentage of Population Employed in Transportation & Warehousing in Idaho
| Zip Code | % Employed | vs State | vs National | |
| 1. | 83874 | 66.7% | 4.0%(+62.7)#1 | 4.9%(+61.7)#38 |
| 2. | 83233 | 60.6% | 4.0%(+56.6)#2 | 4.9%(+55.6)#51 |
| 3. | 83520 | 54.8% | 4.0%(+50.9)#3 | 4.9%(+49.9)#63 |
| 4. | 83524 | 21.6% | 4.0%(+17.6)#4 | 4.9%(+16.6)#451 |
| 5. | 83549 | 17.3% | 4.0%(+13.3)#5 | 4.9%(+12.3)#748 |
| 6. | 83554 | 16.8% | 4.0%(+12.9)#6 | 4.9%(+11.9)#793 |
| 7. | 83637 | 15.5% | 4.0%(+11.6)#7 | 4.9%(+10.6)#973 |
| 8. | 83454 | 15.0% | 4.0%(+11.1)#8 | 4.9%(+10.1)#1,058 |
| 9. | 83604 | 12.8% | 4.0%(+8.82)#9 | 4.9%(+7.84)#1,597 |
| 10. | 83342 | 12.4% | 4.0%(+8.42)#10 | 4.9%(+7.44)#1,716 |
| 11. | 83803 | 12.3% | 4.0%(+8.35)#11 | 4.9%(+7.37)#1,747 |
| 12. | 83535 | 12.0% | 4.0%(+8.08)#12 | 4.9%(+7.10)#1,836 |
| 13. | 83636 | 11.8% | 4.0%(+7.84)#13 | 4.9%(+6.86)#1,942 |
| 14. | 83438 | 11.4% | 4.0%(+7.46)#14 | 4.9%(+6.48)#2,106 |
| 15. | 83234 | 11.1% | 4.0%(+7.14)#15 | 4.9%(+6.16)#2,266 |
| 16. | 83325 | 10.8% | 4.0%(+6.87)#16 | 4.9%(+5.89)#2,403 |
| 17. | 83804 | 10.6% | 4.0%(+6.67)#17 | 4.9%(+5.69)#2,503 |
| 18. | 83610 | 10.4% | 4.0%(+6.47)#18 | 4.9%(+5.49)#2,620 |
| 19. | 83661 | 10.4% | 4.0%(+6.44)#19 | 4.9%(+5.46)#2,634 |
| 20. | 83226 | 10.1% | 4.0%(+6.14)#20 | 4.9%(+5.16)#2,820 |
| 21. | 83425 | 9.6% | 4.0%(+5.67)#21 | 4.9%(+4.69)#3,126 |
| 22. | 83841 | 9.6% | 4.0%(+5.67)#22 | 4.9%(+4.69)#3,127 |
| 23. | 83834 | 9.3% | 4.0%(+5.29)#23 | 4.9%(+4.31)#3,433 |
| 24. | 83239 | 9.2% | 4.0%(+5.25)#24 | 4.9%(+4.27)#3,465 |
| 25. | 83523 | 9.2% | 4.0%(+5.23)#25 | 4.9%(+4.25)#3,489 |
| 26. | 83211 | 8.9% | 4.0%(+4.91)#26 | 4.9%(+3.93)#3,841 |
| 27. | 83533 | 8.8% | 4.0%(+4.82)#27 | 4.9%(+3.84)#3,938 |
| 28. | 83420 | 8.7% | 4.0%(+4.78)#28 | 4.9%(+3.80)#3,991 |
| 29. | 83822 | 8.6% | 4.0%(+4.60)#29 | 4.9%(+3.62)#4,193 |
| 30. | 83431 | 8.4% | 4.0%(+4.46)#30 | 4.9%(+3.48)#4,361 |
| 31. | 83448 | 8.4% | 4.0%(+4.40)#31 | 4.9%(+3.42)#4,427 |
| 32. | 83344 | 8.2% | 4.0%(+4.24)#32 | 4.9%(+3.26)#4,634 |
| 33. | 83873 | 8.1% | 4.0%(+4.11)#33 | 4.9%(+3.13)#4,798 |
| 34. | 83444 | 7.7% | 4.0%(+3.74)#34 | 4.9%(+2.76)#5,311 |
| 35. | 83825 | 7.7% | 4.0%(+3.73)#35 | 4.9%(+2.75)#5,345 |
| 36. | 83277 | 7.6% | 4.0%(+3.63)#36 | 4.9%(+2.65)#5,498 |
| 37. | 83274 | 7.5% | 4.0%(+3.57)#37 | 4.9%(+2.59)#5,586 |
| 38. | 83872 | 7.4% | 4.0%(+3.46)#38 | 4.9%(+2.48)#5,777 |
| 39. | 83861 | 7.3% | 4.0%(+3.34)#39 | 4.9%(+2.36)#5,993 |
| 40. | 83555 | 7.3% | 4.0%(+3.33)#40 | 4.9%(+2.35)#6,007 |
| 41. | 83543 | 7.2% | 4.0%(+3.24)#41 | 4.9%(+2.26)#6,176 |
| 42. | 83687 | 7.1% | 4.0%(+3.14)#42 | 4.9%(+2.16)#6,346 |
| 43. | 83619 | 7.0% | 4.0%(+3.08)#43 | 4.9%(+2.10)#6,456 |
| 44. | 83856 | 6.8% | 4.0%(+2.84)#44 | 4.9%(+1.86)#6,946 |
| 45. | 83341 | 6.7% | 4.0%(+2.71)#45 | 4.9%(+1.73)#7,218 |
| 46. | 83262 | 6.7% | 4.0%(+2.70)#46 | 4.9%(+1.72)#7,232 |
| 47. | 83263 | 6.6% | 4.0%(+2.67)#47 | 4.9%(+1.69)#7,300 |
| 48. | 83546 | 6.6% | 4.0%(+2.66)#48 | 4.9%(+1.68)#7,328 |
| 49. | 83860 | 6.5% | 4.0%(+2.57)#49 | 4.9%(+1.59)#7,501 |
| 50. | 83850 | 6.5% | 4.0%(+2.55)#50 | 4.9%(+1.57)#7,535 |
| 51. | 83445 | 6.4% | 4.0%(+2.47)#51 | 4.9%(+1.49)#7,711 |
| 52. | 83654 | 6.4% | 4.0%(+2.45)#52 | 4.9%(+1.47)#7,773 |
| 53. | 83328 | 6.4% | 4.0%(+2.43)#53 | 4.9%(+1.45)#7,827 |
| 54. | 83204 | 6.3% | 4.0%(+2.36)#54 | 4.9%(+1.38)#7,983 |
| 55. | 83332 | 6.3% | 4.0%(+2.36)#55 | 4.9%(+1.38)#7,987 |
| 56. | 83624 | 6.3% | 4.0%(+2.31)#56 | 4.9%(+1.33)#8,092 |
| 57. | 83338 | 6.3% | 4.0%(+2.30)#57 | 4.9%(+1.32)#8,117 |
| 58. | 83869 | 6.2% | 4.0%(+2.28)#58 | 4.9%(+1.30)#8,159 |
| 59. | 83228 | 6.2% | 4.0%(+2.26)#59 | 4.9%(+1.28)#8,233 |
| 60. | 83823 | 6.2% | 4.0%(+2.23)#60 | 4.9%(+1.25)#8,304 |
| 61. | 83622 | 6.2% | 4.0%(+2.22)#61 | 4.9%(+1.24)#8,335 |
| 62. | 83217 | 6.2% | 4.0%(+2.20)#62 | 4.9%(+1.22)#8,370 |
| 63. | 83352 | 6.2% | 4.0%(+2.19)#63 | 4.9%(+1.21)#8,394 |
| 64. | 83335 | 6.0% | 4.0%(+2.04)#64 | 4.9%(+1.06)#8,774 |
| 65. | 83330 | 6.0% | 4.0%(+2.01)#65 | 4.9%(+1.03)#8,853 |
| 66. | 83334 | 5.9% | 4.0%(+1.90)#66 | 4.9%(+0.925)#9,133 |
| 67. | 83644 | 5.8% | 4.0%(+1.85)#67 | 4.9%(+0.874)#9,286 |
| 68. | 83633 | 5.7% | 4.0%(+1.78)#68 | 4.9%(+0.801)#9,516 |
| 69. | 83806 | 5.7% | 4.0%(+1.78)#69 | 4.9%(+0.801)#9,517 |
| 70. | 83845 | 5.7% | 4.0%(+1.78)#70 | 4.9%(+0.799)#9,524 |
| 71. | 83607 | 5.7% | 4.0%(+1.69)#71 | 4.9%(+0.708)#9,801 |
| 72. | 83660 | 5.6% | 4.0%(+1.65)#72 | 4.9%(+0.667)#9,925 |
| 73. | 83261 | 5.6% | 4.0%(+1.59)#73 | 4.9%(+0.609)#10,084 |
| 74. | 83451 | 5.5% | 4.0%(+1.58)#74 | 4.9%(+0.596)#10,124 |
| 75. | 83805 | 5.5% | 4.0%(+1.49)#75 | 4.9%(+0.513)#10,374 |
| 76. | 83311 | 5.4% | 4.0%(+1.45)#76 | 4.9%(+0.469)#10,522 |
| 77. | 83210 | 5.4% | 4.0%(+1.43)#77 | 4.9%(+0.452)#10,577 |
| 78. | 83237 | 5.4% | 4.0%(+1.42)#78 | 4.9%(+0.439)#10,623 |
| 79. | 83615 | 5.4% | 4.0%(+1.42)#79 | 4.9%(+0.438)#10,625 |
| 80. | 83714 | 5.3% | 4.0%(+1.36)#80 | 4.9%(+0.382)#10,827 |
| 81. | 83201 | 5.3% | 4.0%(+1.35)#81 | 4.9%(+0.369)#10,871 |
| 82. | 83254 | 5.3% | 4.0%(+1.29)#82 | 4.9%(+0.306)#11,063 |
| 83. | 83705 | 5.2% | 4.0%(+1.23)#83 | 4.9%(+0.248)#11,262 |
| 84. | 83651 | 5.1% | 4.0%(+1.17)#84 | 4.9%(+0.190)#11,482 |
| 85. | 83214 | 5.1% | 4.0%(+1.15)#85 | 4.9%(+0.166)#11,577 |
| 86. | 83626 | 5.1% | 4.0%(+1.14)#86 | 4.9%(+0.161)#11,597 |
| 87. | 83811 | 5.0% | 4.0%(+1.07)#87 | 4.9%(+0.086)#11,846 |
| 88. | 83313 | 5.0% | 4.0%(+1.05)#88 | 4.9%(+0.072)#11,876 |
| 89. | 83232 | 5.0% | 4.0%(+1.01)#89 | 4.9%(+0.033)#12,009 |
| 90. | 83318 | 4.8% | 4.0%(+0.851)#90 | 4.9%(-0.129)#12,570 |
| 91. | 83655 | 4.8% | 4.0%(+0.838)#91 | 4.9%(-0.142)#12,620 |
| 92. | 83301 | 4.8% | 4.0%(+0.814)#92 | 4.9%(-0.166)#12,711 |
| 93. | 83855 | 4.7% | 4.0%(+0.759)#93 | 4.9%(-0.221)#12,937 |
| 94. | 83541 | 4.6% | 4.0%(+0.653)#94 | 4.9%(-0.327)#13,323 |
| 95. | 83422 | 4.5% | 4.0%(+0.570)#95 | 4.9%(-0.410)#13,674 |
| 96. | 83202 | 4.5% | 4.0%(+0.497)#96 | 4.9%(-0.483)#13,921 |
| 97. | 83252 | 4.4% | 4.0%(+0.477)#97 | 4.9%(-0.503)#13,994 |
| 98. | 83627 | 4.3% | 4.0%(+0.382)#98 | 4.9%(-0.598)#14,397 |
| 99. | 83347 | 4.3% | 4.0%(+0.369)#99 | 4.9%(-0.611)#14,457 |
| 100. | 83436 | 4.3% | 4.0%(+0.303)#100 | 4.9%(-0.677)#14,718 |
Common Questions
What are the Top 10 Zip Codes with the Highest Percentage of Population Employed in Transportation & Warehousing in Idaho?
Top 10 Zip Codes with the Highest Percentage of Population Employed in Transportation & Warehousing in Idaho are:
What zip code has the Highest Percentage of Population Employed in Transportation & Warehousing in Idaho?
83874 has the Highest Percentage of Population Employed in Transportation & Warehousing in Idaho with 66.7%.
What is the Percentage of Population Employed in Transportation & Warehousing in the State of Idaho?
Percentage of Population Employed in Transportation & Warehousing in Idaho is 4.0%.
What is the Percentage of Population Employed in Transportation & Warehousing in the United States?
Percentage of Population Employed in Transportation & Warehousing in the United States is 4.9%.