Malad City, ID Map & Demographics
Malad City Map
Malad City Overview
$28,874
PER CAPITA INCOME
$75,714
AVG FAMILY INCOME
$68,594
AVG HOUSEHOLD INCOME
54.1%
WAGE / INCOME GAP [ % ]
45.9¢/ $1
WAGE / INCOME GAP [ $ ]
0.37
INEQUALITY / GINI INDEX
2,219
TOTAL POPULATION
1,104
MALE POPULATION
1,115
FEMALE POPULATION
99.01
MALES / 100 FEMALES
101.00
FEMALES / 100 MALES
39.8
MEDIAN AGE
3.3
AVG FAMILY SIZE
2.4
AVG HOUSEHOLD SIZE
997
LABOR FORCE [ PEOPLE ]
59.3%
PERCENT IN LABOR FORCE
0.4%
UNEMPLOYMENT RATE
Malad City Zip Codes
Malad City Area Codes
Income in Malad City
Income Overview in Malad City
Per Capita Income in Malad City is $28,874, while median incomes of families and households are $75,714 and $68,594 respectively.
| Characteristic | Number | Measure |
| Per Capita Income | 2,219 | $28,874 |
| Median Family Income | 540 | $75,714 |
| Mean Family Income | 540 | $79,447 |
| Median Household Income | 897 | $68,594 |
| Mean Household Income | 897 | $72,780 |
| Income Deficit | 540 | $0 |
| Wage / Income Gap (%) | 2,219 | 54.07% |
| Wage / Income Gap ($) | 2,219 | 45.93¢ per $1 |
| Gini / Inequality Index | 2,219 | 0.37 |
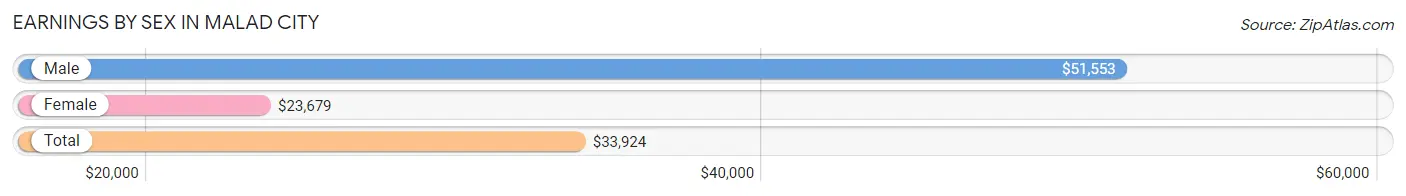
Earnings by Sex in Malad City
Average Earnings in Malad City are $33,924, $51,553 for men and $23,679 for women, a difference of 54.1%.
| Sex | Number | Average Earnings |
| Male | 571 (53.6%) | $51,553 |
| Female | 494 (46.4%) | $23,679 |
| Total | 1,065 (100.0%) | $33,924 |
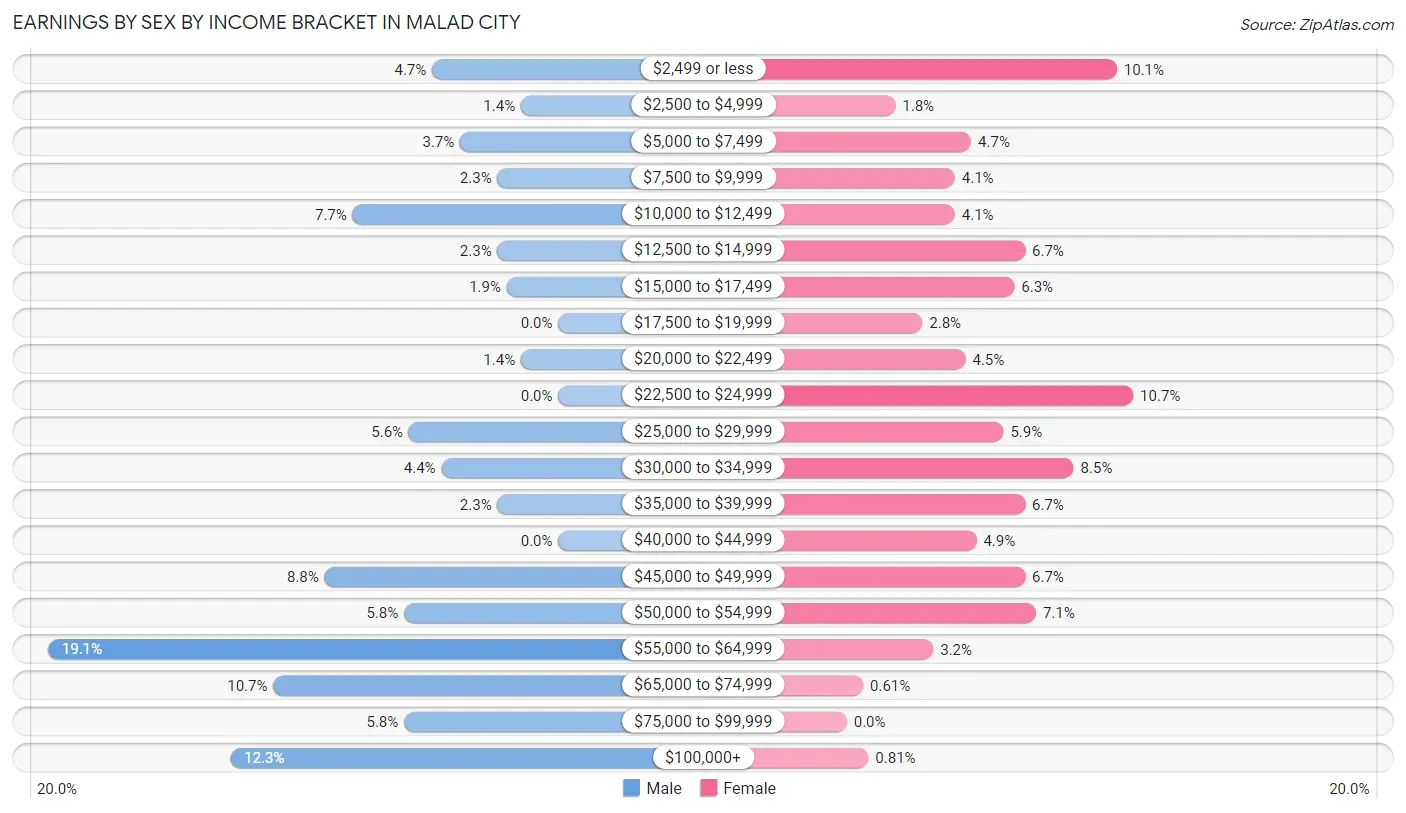
Earnings by Sex by Income Bracket in Malad City
The most common earnings brackets in Malad City are $55,000 to $64,999 for men (109 | 19.1%) and $22,500 to $24,999 for women (53 | 10.7%).
| Income | Male | Female |
| $2,499 or less | 27 (4.7%) | 50 (10.1%) |
| $2,500 to $4,999 | 8 (1.4%) | 9 (1.8%) |
| $5,000 to $7,499 | 21 (3.7%) | 23 (4.7%) |
| $7,500 to $9,999 | 13 (2.3%) | 20 (4.1%) |
| $10,000 to $12,499 | 44 (7.7%) | 20 (4.1%) |
| $12,500 to $14,999 | 13 (2.3%) | 33 (6.7%) |
| $15,000 to $17,499 | 11 (1.9%) | 31 (6.3%) |
| $17,500 to $19,999 | 0 (0.0%) | 14 (2.8%) |
| $20,000 to $22,499 | 8 (1.4%) | 22 (4.4%) |
| $22,500 to $24,999 | 0 (0.0%) | 53 (10.7%) |
| $25,000 to $29,999 | 32 (5.6%) | 29 (5.9%) |
| $30,000 to $34,999 | 25 (4.4%) | 42 (8.5%) |
| $35,000 to $39,999 | 13 (2.3%) | 33 (6.7%) |
| $40,000 to $44,999 | 0 (0.0%) | 24 (4.9%) |
| $45,000 to $49,999 | 50 (8.8%) | 33 (6.7%) |
| $50,000 to $54,999 | 33 (5.8%) | 35 (7.1%) |
| $55,000 to $64,999 | 109 (19.1%) | 16 (3.2%) |
| $65,000 to $74,999 | 61 (10.7%) | 3 (0.6%) |
| $75,000 to $99,999 | 33 (5.8%) | 0 (0.0%) |
| $100,000+ | 70 (12.3%) | 4 (0.8%) |
| Total | 571 (100.0%) | 494 (100.0%) |
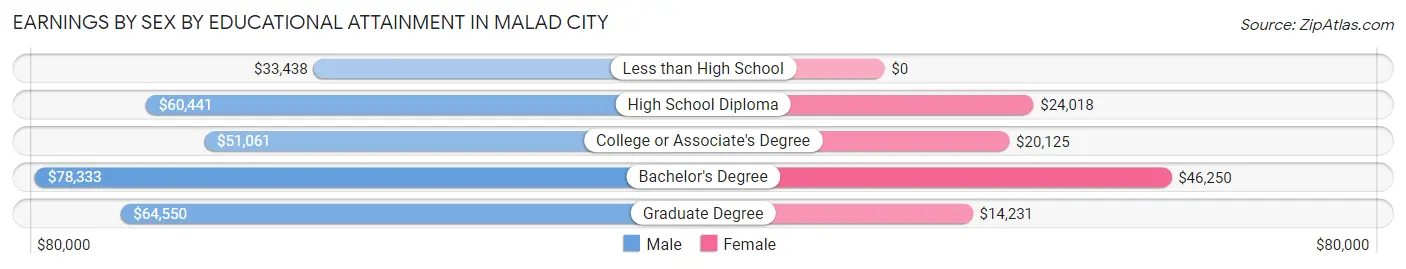
Earnings by Sex by Educational Attainment in Malad City
Average earnings in Malad City are $60,294 for men and $24,975 for women, a difference of 58.6%. Men with an educational attainment of bachelor's degree enjoy the highest average annual earnings of $78,333, while those with less than high school education earn the least with $33,438. Women with an educational attainment of bachelor's degree earn the most with the average annual earnings of $46,250, while those with graduate degree education have the smallest earnings of $14,231.
| Educational Attainment | Male Income | Female Income |
| Less than High School | $33,438 | $0 |
| High School Diploma | $60,441 | $24,018 |
| College or Associate's Degree | $51,061 | $20,125 |
| Bachelor's Degree | $78,333 | $46,250 |
| Graduate Degree | $64,550 | $14,231 |
| Total | $60,294 | $24,975 |
Family Income in Malad City
Family Income Brackets in Malad City
According to the Malad City family income data, there are 158 families falling into the $75,000 to $99,999 income range, which is the most common income bracket and makes up 29.3% of all families. Conversely, the $10,000 to $14,999 income bracket is the least frequent group with only 5 families (0.9%) belonging to this category.
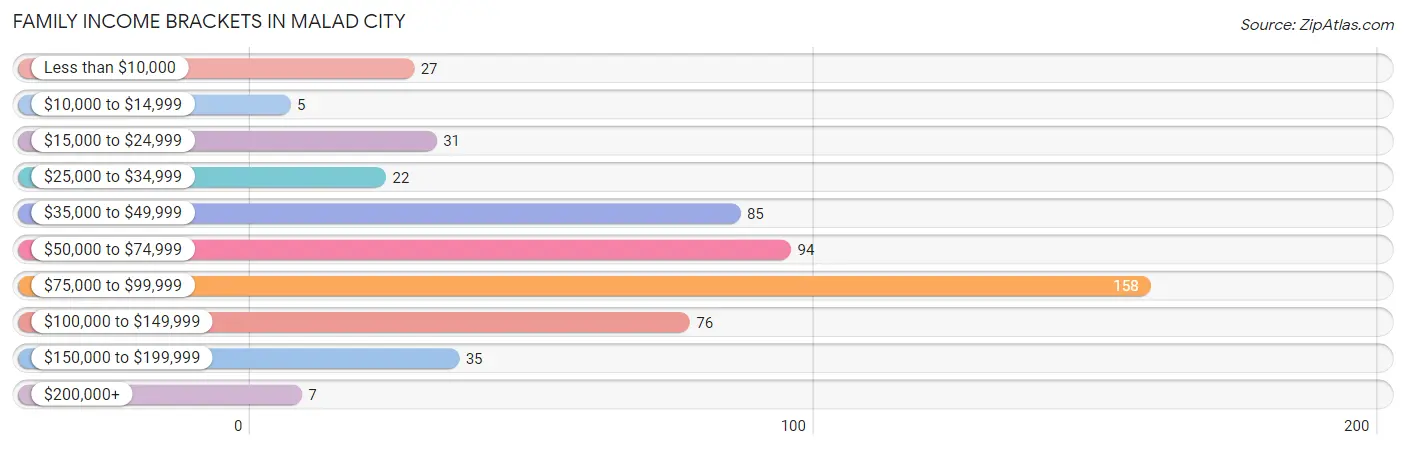
| Income Bracket | # Families | % Families |
| Less than $10,000 | 27 | 5.0% |
| $10,000 to $14,999 | 5 | 0.9% |
| $15,000 to $24,999 | 31 | 5.7% |
| $25,000 to $34,999 | 22 | 4.1% |
| $35,000 to $49,999 | 85 | 15.7% |
| $50,000 to $74,999 | 94 | 17.4% |
| $75,000 to $99,999 | 158 | 29.3% |
| $100,000 to $149,999 | 76 | 14.1% |
| $150,000 to $199,999 | 35 | 6.5% |
| $200,000+ | 7 | 1.3% |
Family Income by Famaliy Size in Malad City
7+ person families (51 | 9.4%) account for the highest median family income in Malad City with $137,802 per family, while 2-person families (223 | 41.3%) have the highest median income of $30,390 per family member.
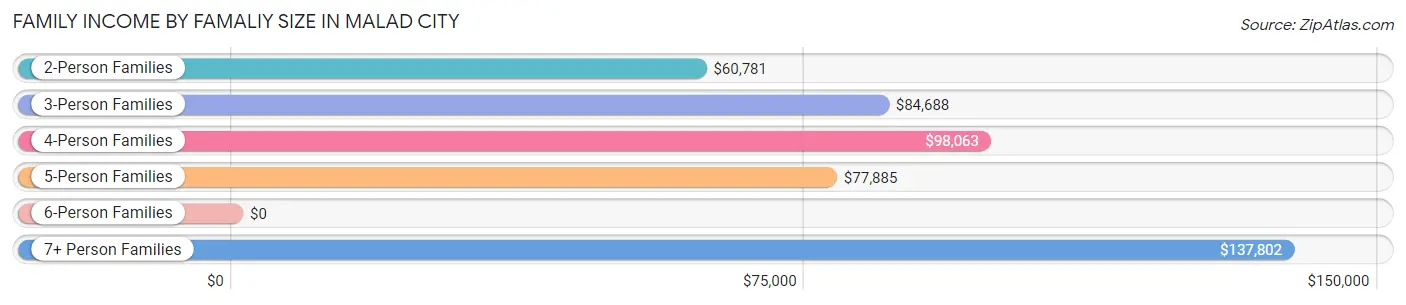
| Income Bracket | # Families | Median Income |
| 2-Person Families | 223 (41.3%) | $60,781 |
| 3-Person Families | 126 (23.3%) | $84,688 |
| 4-Person Families | 51 (9.4%) | $98,063 |
| 5-Person Families | 72 (13.3%) | $77,885 |
| 6-Person Families | 17 (3.2%) | $0 |
| 7+ Person Families | 51 (9.4%) | $137,802 |
| Total | 540 (100.0%) | $75,714 |
Family Income by Number of Earners in Malad City
The median family income in Malad City is $75,714, with families comprising 3+ earners (117) having the highest median family income of $99,583, while families with 1 earner (135) have the lowest median family income of $44,539, accounting for 21.7% and 25.0% of families, respectively.
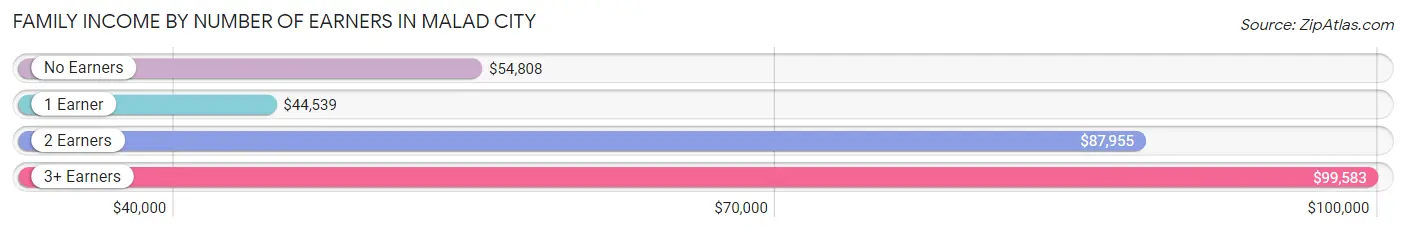
| Number of Earners | # Families | Median Income |
| No Earners | 96 (17.8%) | $54,808 |
| 1 Earner | 135 (25.0%) | $44,539 |
| 2 Earners | 192 (35.6%) | $87,955 |
| 3+ Earners | 117 (21.7%) | $99,583 |
| Total | 540 (100.0%) | $75,714 |
Household Income in Malad City
Household Income Brackets in Malad City
With 199 households falling in the category, the $75,000 to $99,999 income range is the most frequent in Malad City, accounting for 22.2% of all households. In contrast, only 7 households (0.8%) fall into the $200,000+ income bracket, making it the least populous group.
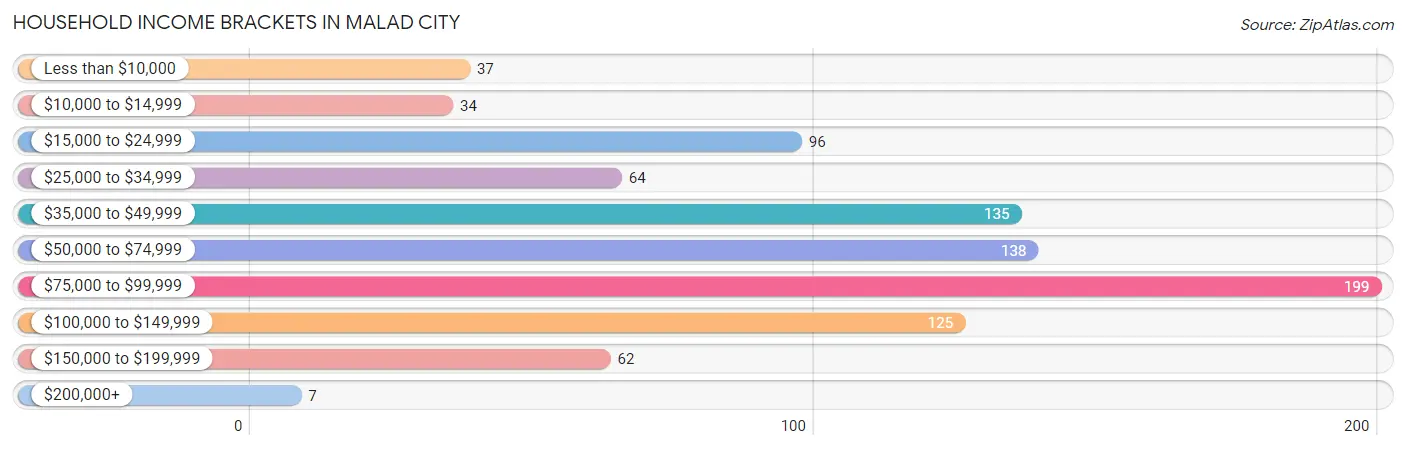
| Income Bracket | # Households | % Households |
| Less than $10,000 | 37 | 4.1% |
| $10,000 to $14,999 | 34 | 3.8% |
| $15,000 to $24,999 | 96 | 10.7% |
| $25,000 to $34,999 | 64 | 7.1% |
| $35,000 to $49,999 | 135 | 15.1% |
| $50,000 to $74,999 | 138 | 15.4% |
| $75,000 to $99,999 | 199 | 22.2% |
| $100,000 to $149,999 | 125 | 13.9% |
| $150,000 to $199,999 | 62 | 6.9% |
| $200,000+ | 7 | 0.8% |
Household Income by Householder Age in Malad City
The median household income in Malad City is $68,594, with the highest median household income of $88,295 found in the 25 to 44 years age bracket for the primary householder. A total of 284 households (31.7%) fall into this category. Meanwhile, the 15 to 24 years age bracket for the primary householder has the lowest median household income of $0, with 32 households (3.6%) in this group.
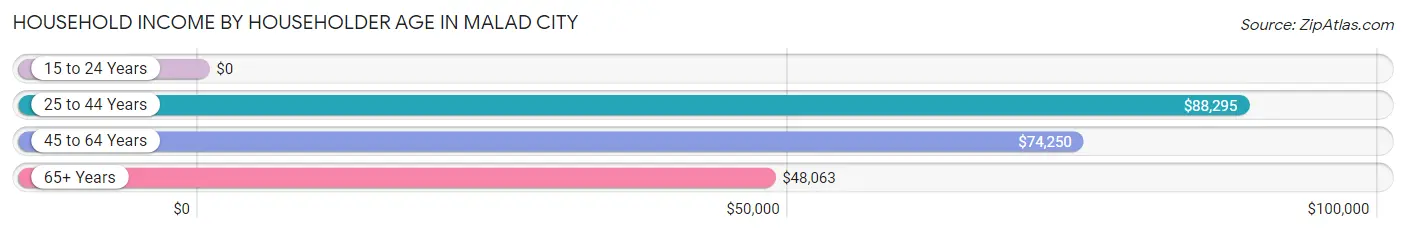
| Income Bracket | # Households | Median Income |
| 15 to 24 Years | 32 (3.6%) | $0 |
| 25 to 44 Years | 284 (31.7%) | $88,295 |
| 45 to 64 Years | 236 (26.3%) | $74,250 |
| 65+ Years | 345 (38.5%) | $48,063 |
| Total | 897 (100.0%) | $68,594 |
Poverty in Malad City
Income Below Poverty by Sex and Age in Malad City
With 9.6% poverty level for males and 13.4% for females among the residents of Malad City, under 5 year old males and under 5 year old females are the most vulnerable to poverty, with 25 males (42.4%) and 29 females (32.6%) in their respective age groups living below the poverty level.
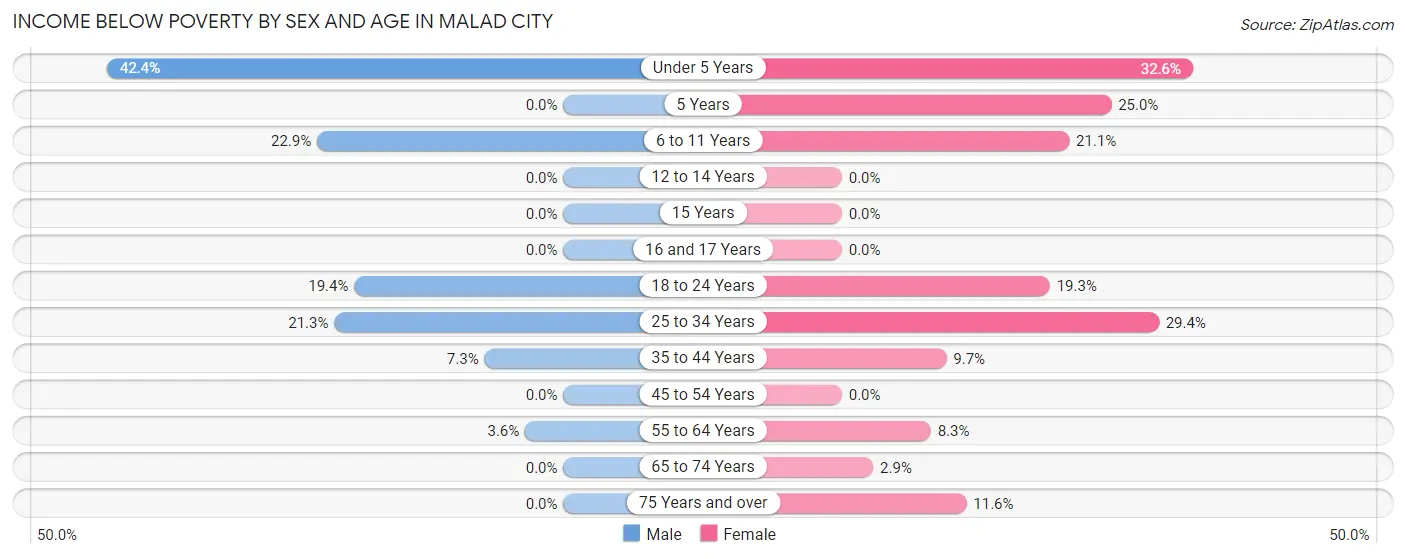
| Age Bracket | Male | Female |
| Under 5 Years | 25 (42.4%) | 29 (32.6%) |
| 5 Years | 0 (0.0%) | 8 (25.0%) |
| 6 to 11 Years | 24 (22.9%) | 23 (21.1%) |
| 12 to 14 Years | 0 (0.0%) | 0 (0.0%) |
| 15 Years | 0 (0.0%) | 0 (0.0%) |
| 16 and 17 Years | 0 (0.0%) | 0 (0.0%) |
| 18 to 24 Years | 13 (19.4%) | 11 (19.3%) |
| 25 to 34 Years | 27 (21.3%) | 35 (29.4%) |
| 35 to 44 Years | 9 (7.3%) | 13 (9.7%) |
| 45 to 54 Years | 0 (0.0%) | 0 (0.0%) |
| 55 to 64 Years | 5 (3.5%) | 8 (8.3%) |
| 65 to 74 Years | 0 (0.0%) | 3 (2.9%) |
| 75 Years and over | 0 (0.0%) | 17 (11.6%) |
| Total | 103 (9.6%) | 147 (13.4%) |
Income Above Poverty by Sex and Age in Malad City
According to the poverty statistics in Malad City, males aged 5 years and females aged 12 to 14 years are the age groups that are most secure financially, with 100.0% of males and 100.0% of females in these age groups living above the poverty line.
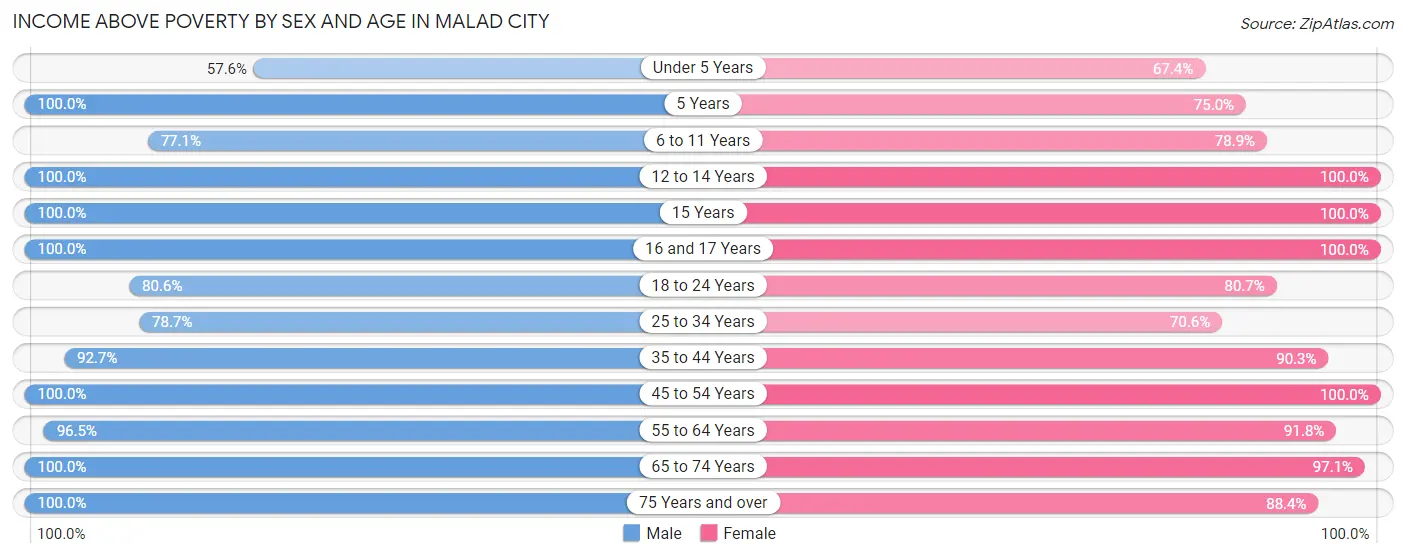
| Age Bracket | Male | Female |
| Under 5 Years | 34 (57.6%) | 60 (67.4%) |
| 5 Years | 8 (100.0%) | 24 (75.0%) |
| 6 to 11 Years | 81 (77.1%) | 86 (78.9%) |
| 12 to 14 Years | 70 (100.0%) | 46 (100.0%) |
| 15 Years | 8 (100.0%) | 11 (100.0%) |
| 16 and 17 Years | 34 (100.0%) | 50 (100.0%) |
| 18 to 24 Years | 54 (80.6%) | 46 (80.7%) |
| 25 to 34 Years | 100 (78.7%) | 84 (70.6%) |
| 35 to 44 Years | 114 (92.7%) | 121 (90.3%) |
| 45 to 54 Years | 101 (100.0%) | 104 (100.0%) |
| 55 to 64 Years | 136 (96.5%) | 89 (91.7%) |
| 65 to 74 Years | 109 (100.0%) | 100 (97.1%) |
| 75 Years and over | 126 (100.0%) | 130 (88.4%) |
| Total | 975 (90.4%) | 951 (86.6%) |
Income Below Poverty Among Married-Couple Families in Malad City
The poverty statistics for married-couple families in Malad City show that 6.4% or 28 of the total 441 families live below the poverty line. Families with 3 or 4 children have the highest poverty rate of 30.8%, comprising of 28 families. On the other hand, families with no children have the lowest poverty rate of 0.0%, which includes 0 families.
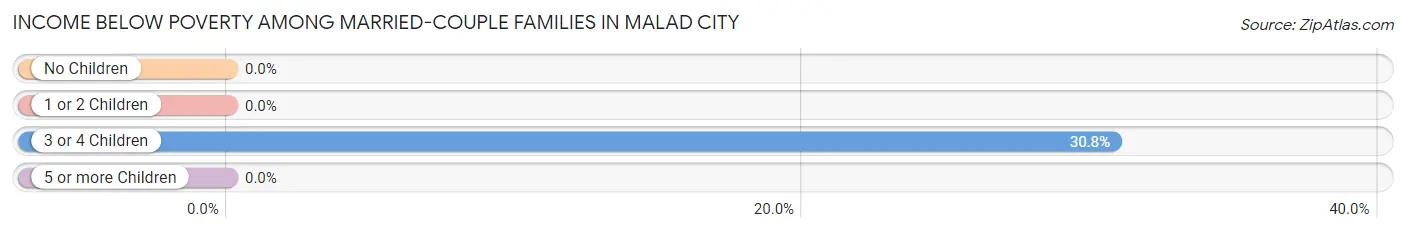
| Children | Above Poverty | Below Poverty |
| No Children | 164 (100.0%) | 0 (0.0%) |
| 1 or 2 Children | 175 (100.0%) | 0 (0.0%) |
| 3 or 4 Children | 63 (69.2%) | 28 (30.8%) |
| 5 or more Children | 11 (100.0%) | 0 (0.0%) |
| Total | 413 (93.6%) | 28 (6.4%) |
Income Below Poverty Among Single-Parent Households in Malad City
According to the poverty data in Malad City, 27.3% or 9 single-father households and 16.7% or 11 single-mother households are living below the poverty line. Among single-father households, those with 1 or 2 children have the highest poverty rate, with 9 households (40.9%) experiencing poverty. Likewise, among single-mother households, those with 1 or 2 children have the highest poverty rate, with 11 households (52.4%) falling below the poverty line.
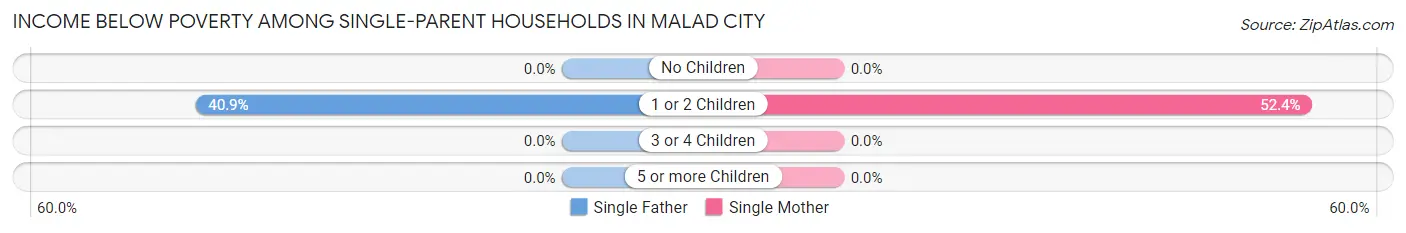
| Children | Single Father | Single Mother |
| No Children | 0 (0.0%) | 0 (0.0%) |
| 1 or 2 Children | 9 (40.9%) | 11 (52.4%) |
| 3 or 4 Children | 0 (0.0%) | 0 (0.0%) |
| 5 or more Children | 0 (0.0%) | 0 (0.0%) |
| Total | 9 (27.3%) | 11 (16.7%) |
Income Below Poverty Among Married-Couple vs Single-Parent Households in Malad City
The poverty data for Malad City shows that 28 of the married-couple family households (6.4%) and 20 of the single-parent households (20.2%) are living below the poverty level. Within the married-couple family households, those with 3 or 4 children have the highest poverty rate, with 28 households (30.8%) falling below the poverty line. Among the single-parent households, those with 1 or 2 children have the highest poverty rate, with 20 household (46.5%) living below poverty.
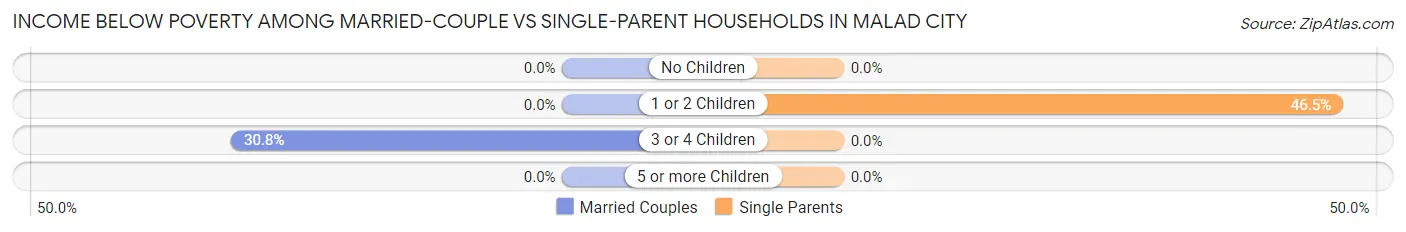
| Children | Married-Couple Families | Single-Parent Households |
| No Children | 0 (0.0%) | 0 (0.0%) |
| 1 or 2 Children | 0 (0.0%) | 20 (46.5%) |
| 3 or 4 Children | 28 (30.8%) | 0 (0.0%) |
| 5 or more Children | 0 (0.0%) | 0 (0.0%) |
| Total | 28 (6.4%) | 20 (20.2%) |
Race in Malad City
The most populous races in Malad City are White / Caucasian (2,177 | 98.1%), Hispanic or Latino (50 | 2.2%), and Native / Alaskan (19 | 0.9%).
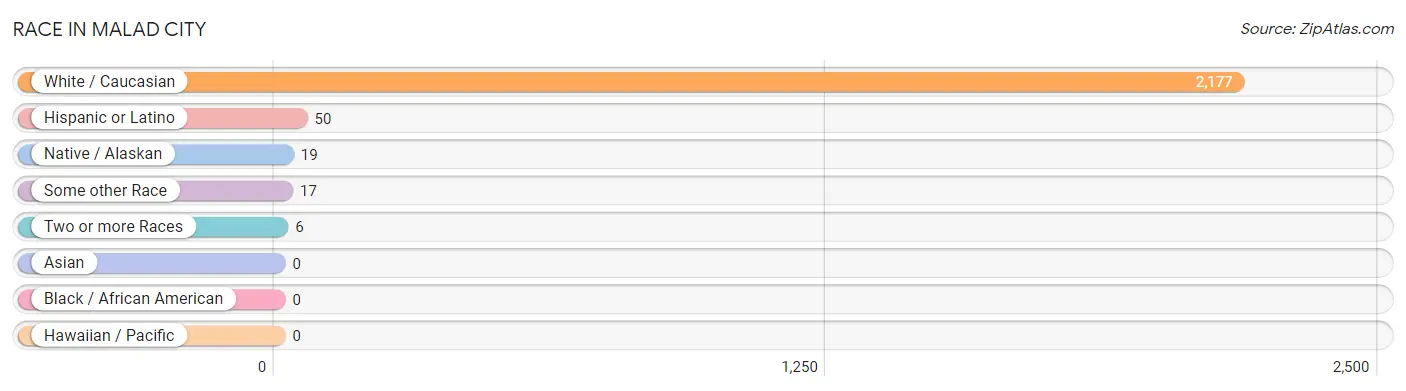
| Race | # Population | % Population |
| Asian | 0 | 0.0% |
| Black / African American | 0 | 0.0% |
| Hawaiian / Pacific | 0 | 0.0% |
| Hispanic or Latino | 50 | 2.2% |
| Native / Alaskan | 19 | 0.9% |
| White / Caucasian | 2,177 | 98.1% |
| Two or more Races | 6 | 0.3% |
| Some other Race | 17 | 0.8% |
| Total | 2,219 | 100.0% |
Ancestry in Malad City
The most populous ancestries reported in Malad City are English (679 | 30.6%), Welsh (499 | 22.5%), German (238 | 10.7%), Swedish (116 | 5.2%), and Irish (110 | 5.0%), together accounting for 74.0% of all Malad City residents.
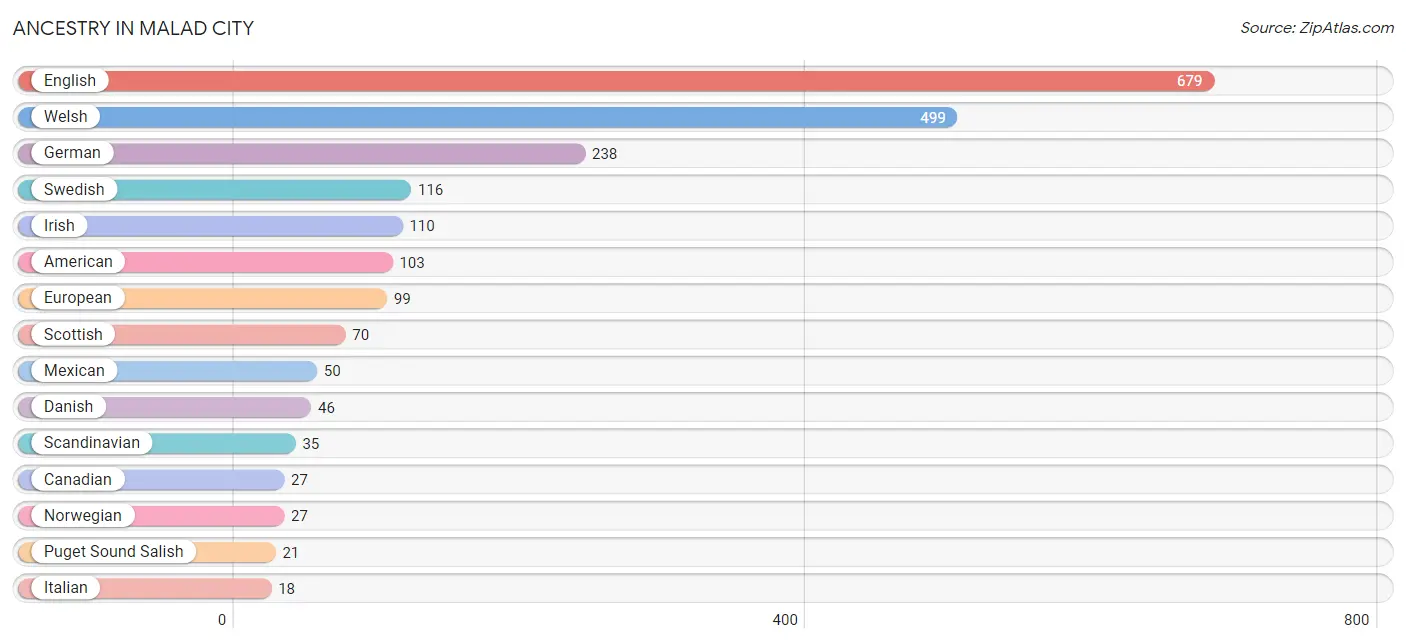
| Ancestry | # Population | % Population |
| American | 103 | 4.6% |
| British | 10 | 0.4% |
| Canadian | 27 | 1.2% |
| Cherokee | 4 | 0.2% |
| Danish | 46 | 2.1% |
| Dutch | 10 | 0.4% |
| English | 679 | 30.6% |
| European | 99 | 4.5% |
| French | 7 | 0.3% |
| German | 238 | 10.7% |
| Hungarian | 4 | 0.2% |
| Irish | 110 | 5.0% |
| Italian | 18 | 0.8% |
| Mexican | 50 | 2.2% |
| Norwegian | 27 | 1.2% |
| Polish | 13 | 0.6% |
| Puget Sound Salish | 21 | 0.9% |
| Scandinavian | 35 | 1.6% |
| Scotch-Irish | 7 | 0.3% |
| Scottish | 70 | 3.2% |
| Swedish | 116 | 5.2% |
| Swiss | 5 | 0.2% |
| Welsh | 499 | 22.5% | View All 23 Rows |
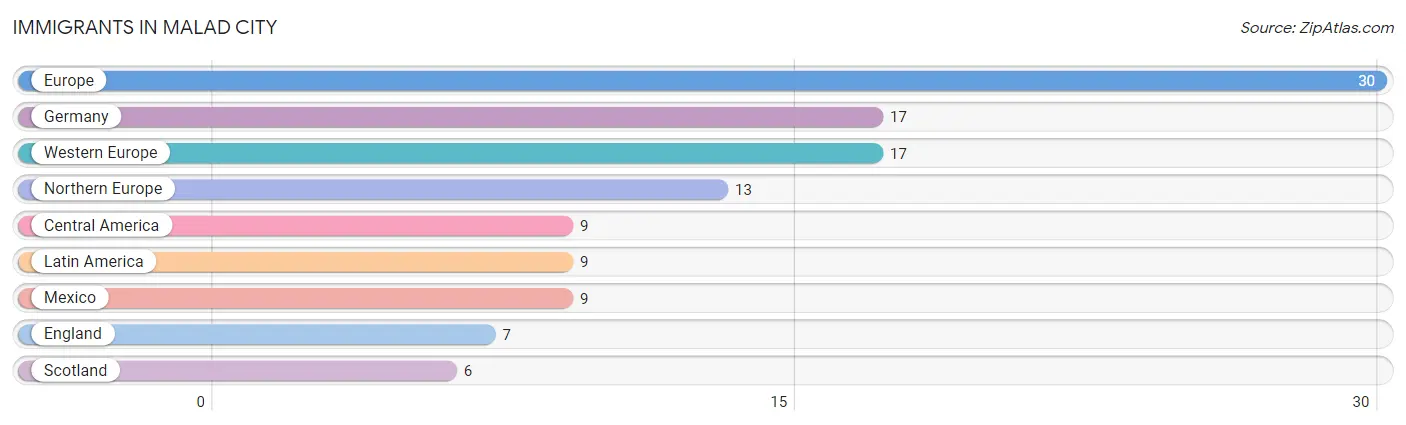
Immigrants in Malad City
The most numerous immigrant groups reported in Malad City came from Europe (30 | 1.3%), Germany (17 | 0.8%), Western Europe (17 | 0.8%), Northern Europe (13 | 0.6%), and Central America (9 | 0.4%), together accounting for 3.9% of all Malad City residents.
| Immigration Origin | # Population | % Population |
| Central America | 9 | 0.4% |
| England | 7 | 0.3% |
| Europe | 30 | 1.3% |
| Germany | 17 | 0.8% |
| Latin America | 9 | 0.4% |
| Mexico | 9 | 0.4% |
| Northern Europe | 13 | 0.6% |
| Scotland | 6 | 0.3% |
| Western Europe | 17 | 0.8% | View All 9 Rows |
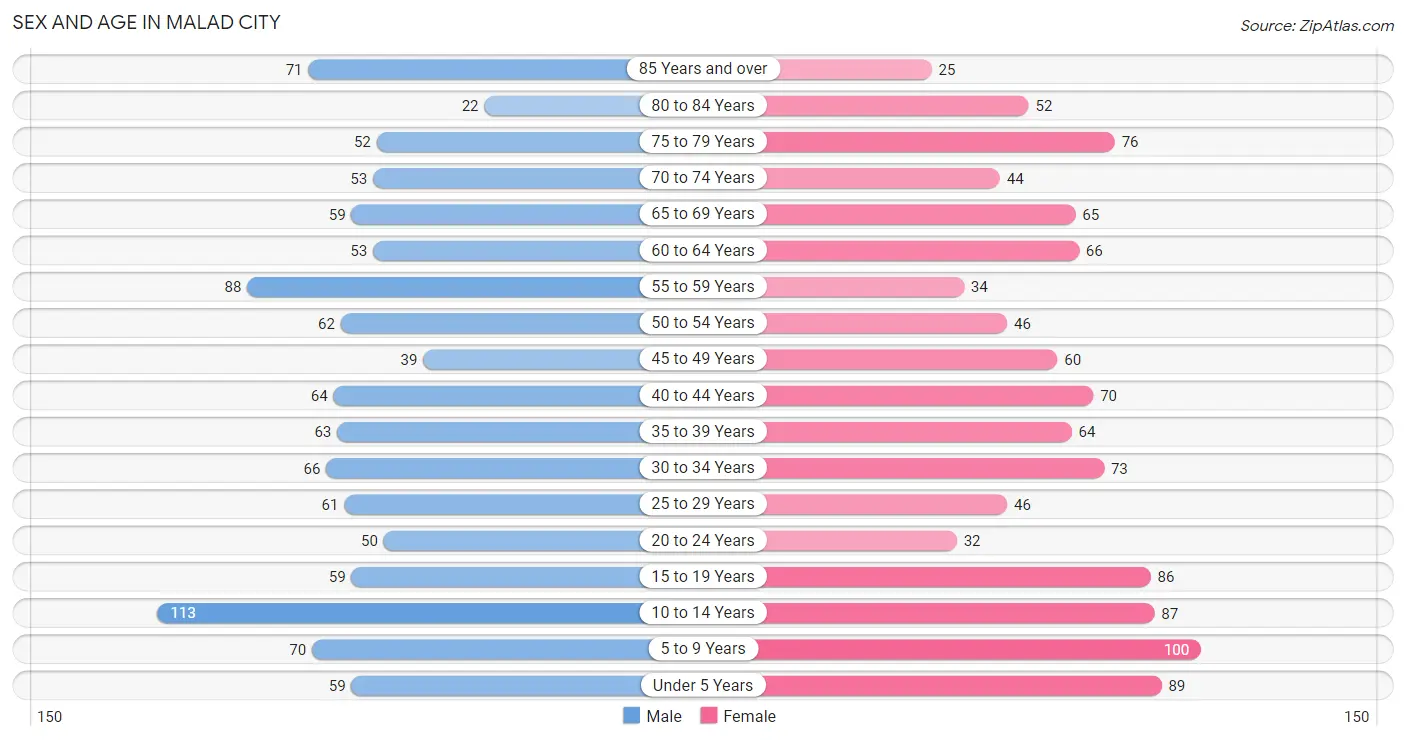
Sex and Age in Malad City
Sex and Age in Malad City
The most populous age groups in Malad City are 10 to 14 Years (113 | 10.2%) for men and 5 to 9 Years (100 | 9.0%) for women.
| Age Bracket | Male | Female |
| Under 5 Years | 59 (5.3%) | 89 (8.0%) |
| 5 to 9 Years | 70 (6.3%) | 100 (9.0%) |
| 10 to 14 Years | 113 (10.2%) | 87 (7.8%) |
| 15 to 19 Years | 59 (5.3%) | 86 (7.7%) |
| 20 to 24 Years | 50 (4.5%) | 32 (2.9%) |
| 25 to 29 Years | 61 (5.5%) | 46 (4.1%) |
| 30 to 34 Years | 66 (6.0%) | 73 (6.6%) |
| 35 to 39 Years | 63 (5.7%) | 64 (5.7%) |
| 40 to 44 Years | 64 (5.8%) | 70 (6.3%) |
| 45 to 49 Years | 39 (3.5%) | 60 (5.4%) |
| 50 to 54 Years | 62 (5.6%) | 46 (4.1%) |
| 55 to 59 Years | 88 (8.0%) | 34 (3.0%) |
| 60 to 64 Years | 53 (4.8%) | 66 (5.9%) |
| 65 to 69 Years | 59 (5.3%) | 65 (5.8%) |
| 70 to 74 Years | 53 (4.8%) | 44 (4.0%) |
| 75 to 79 Years | 52 (4.7%) | 76 (6.8%) |
| 80 to 84 Years | 22 (2.0%) | 52 (4.7%) |
| 85 Years and over | 71 (6.4%) | 25 (2.2%) |
| Total | 1,104 (100.0%) | 1,115 (100.0%) |
Families and Households in Malad City
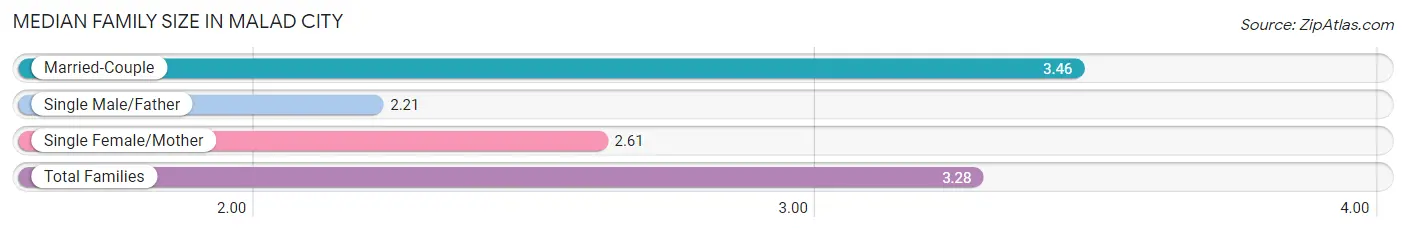
Median Family Size in Malad City
The median family size in Malad City is 3.28 persons per family, with married-couple families (441 | 81.7%) accounting for the largest median family size of 3.46 persons per family. On the other hand, single male/father families (33 | 6.1%) represent the smallest median family size with 2.21 persons per family.
| Family Type | # Families | Family Size |
| Married-Couple | 441 (81.7%) | 3.46 |
| Single Male/Father | 33 (6.1%) | 2.21 |
| Single Female/Mother | 66 (12.2%) | 2.61 |
| Total Families | 540 (100.0%) | 3.28 |
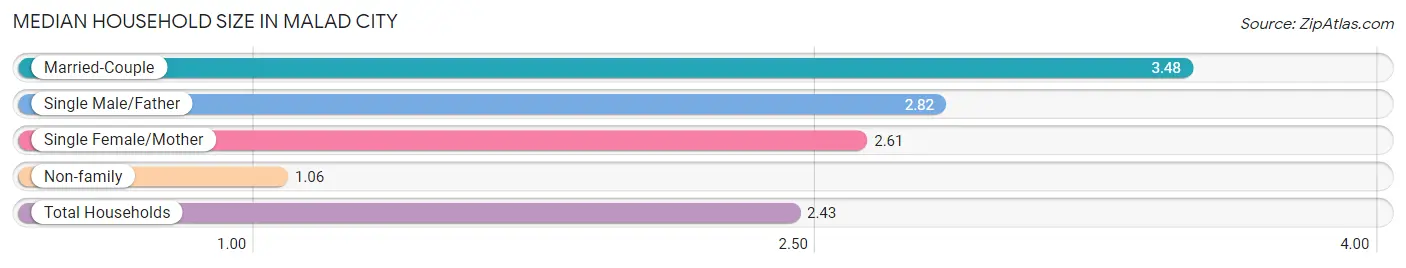
Median Household Size in Malad City
The median household size in Malad City is 2.43 persons per household, with married-couple households (441 | 49.2%) accounting for the largest median household size of 3.48 persons per household. non-family households (357 | 39.8%) represent the smallest median household size with 1.06 persons per household.
| Household Type | # Households | Household Size |
| Married-Couple | 441 (49.2%) | 3.48 |
| Single Male/Father | 33 (3.7%) | 2.82 |
| Single Female/Mother | 66 (7.4%) | 2.61 |
| Non-family | 357 (39.8%) | 1.06 |
| Total Households | 897 (100.0%) | 2.43 |
Household Size by Marriage Status in Malad City
Out of a total of 897 households in Malad City, 540 (60.2%) are family households, while 357 (39.8%) are nonfamily households. The most numerous type of family households are 2-person households, comprising 210, and the most common type of nonfamily households are 1-person households, comprising 318.
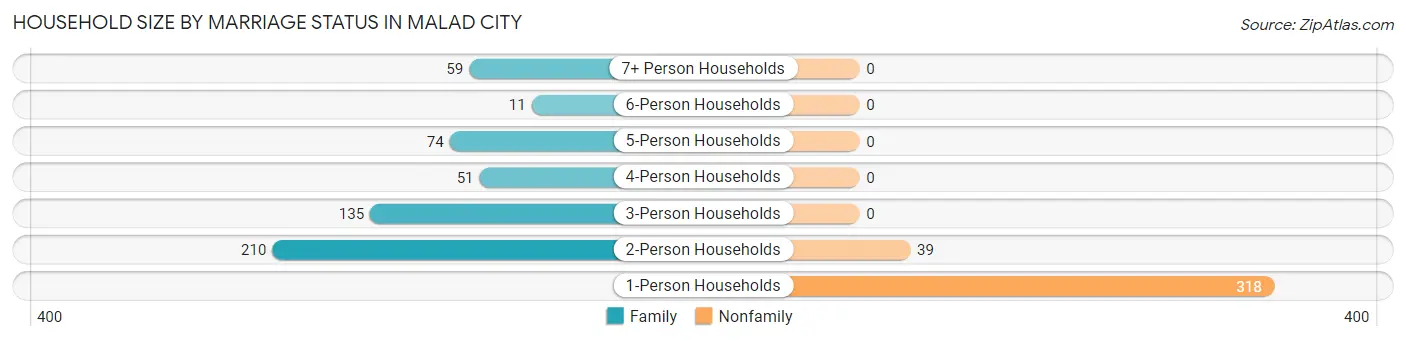
| Household Size | Family Households | Nonfamily Households |
| 1-Person Households | - | 318 (35.4%) |
| 2-Person Households | 210 (23.4%) | 39 (4.3%) |
| 3-Person Households | 135 (15.0%) | 0 (0.0%) |
| 4-Person Households | 51 (5.7%) | 0 (0.0%) |
| 5-Person Households | 74 (8.3%) | 0 (0.0%) |
| 6-Person Households | 11 (1.2%) | 0 (0.0%) |
| 7+ Person Households | 59 (6.6%) | 0 (0.0%) |
| Total | 540 (60.2%) | 357 (39.8%) |
Female Fertility in Malad City
Fertility by Age in Malad City
Average fertility rate in Malad City is 139.0 births per 1,000 women. Women in the age bracket of 20 to 34 years have the highest fertility rate with 364.0 births per 1,000 women. Women in the age bracket of 20 to 34 years acount for 90.2% of all women with births.
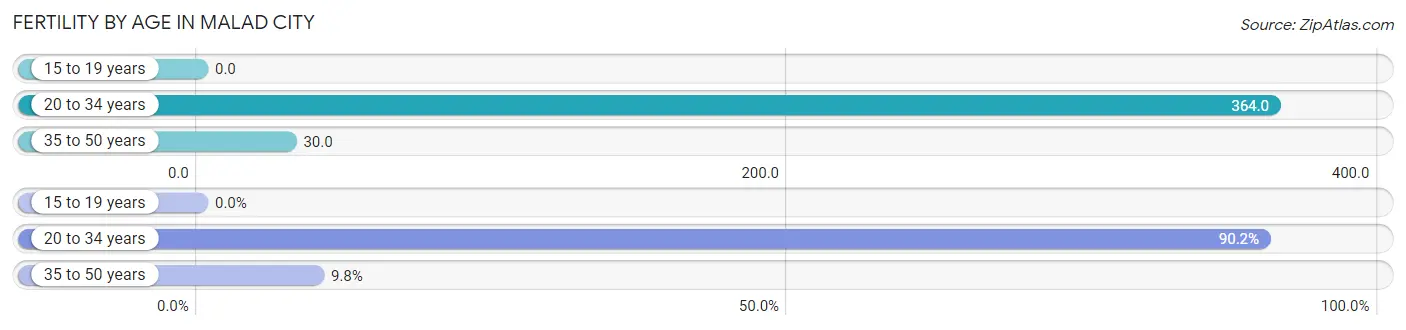
| Age Bracket | Women with Births | Births / 1,000 Women |
| 15 to 19 years | 0 (0.0%) | 0.0 |
| 20 to 34 years | 55 (90.2%) | 364.0 |
| 35 to 50 years | 6 (9.8%) | 30.0 |
| Total | 61 (100.0%) | 139.0 |
Fertility by Age by Marriage Status in Malad City
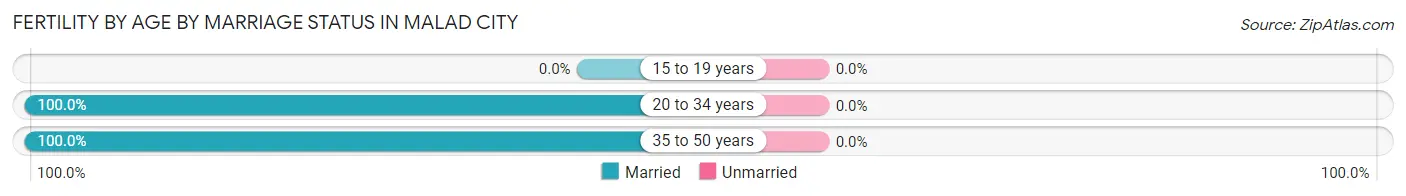
| Age Bracket | Married | Unmarried |
| 15 to 19 years | 0 (0.0%) | 0 (0.0%) |
| 20 to 34 years | 55 (100.0%) | 0 (0.0%) |
| 35 to 50 years | 6 (100.0%) | 0 (0.0%) |
| Total | 61 (100.0%) | 0 (0.0%) |
Fertility by Education in Malad City
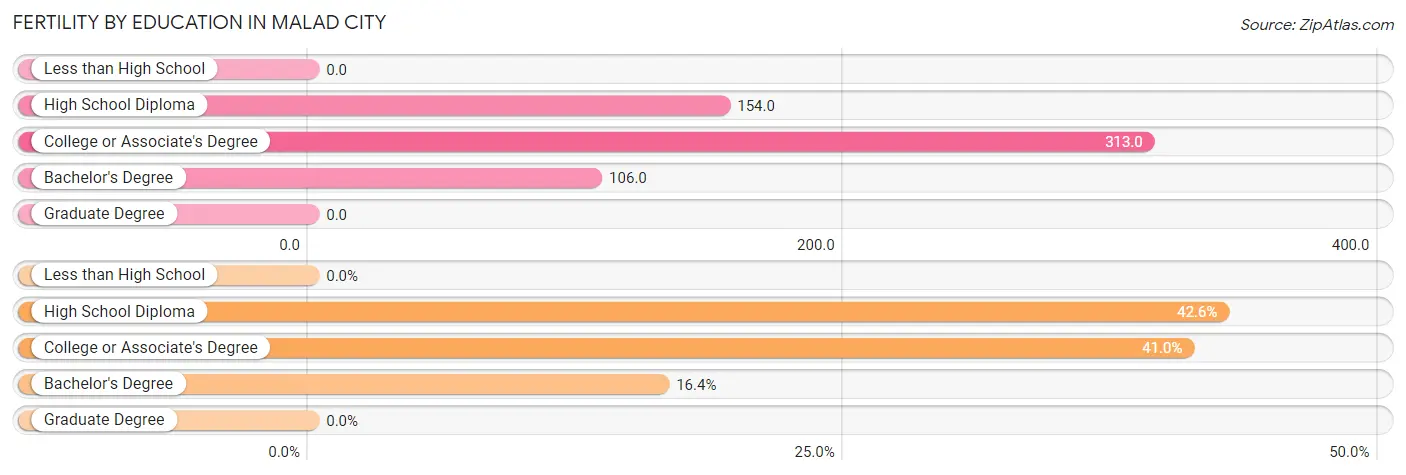
| Educational Attainment | Women with Births | Births / 1,000 Women |
| Less than High School | 0 (0.0%) | 0.0 |
| High School Diploma | 26 (42.6%) | 154.0 |
| College or Associate's Degree | 25 (41.0%) | 313.0 |
| Bachelor's Degree | 10 (16.4%) | 106.0 |
| Graduate Degree | 0 (0.0%) | 0.0 |
| Total | 61 (100.0%) | 139.0 |
Fertility by Education by Marriage Status in Malad City
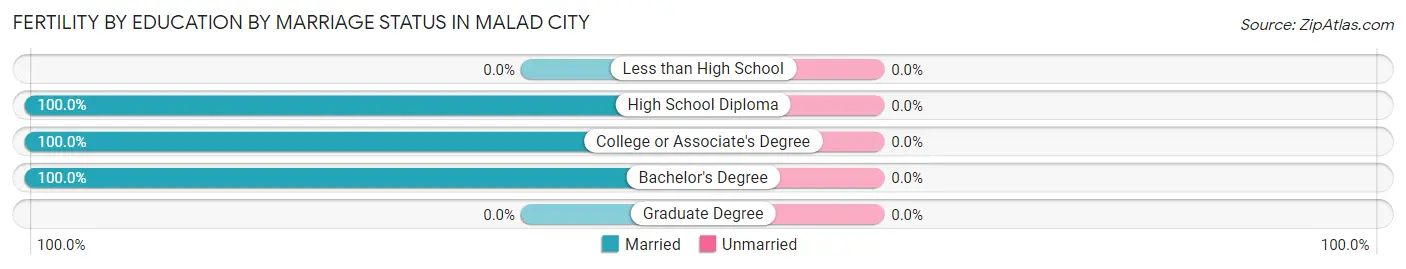
| Educational Attainment | Married | Unmarried |
| Less than High School | 0 (0.0%) | 0 (0.0%) |
| High School Diploma | 26 (100.0%) | 0 (0.0%) |
| College or Associate's Degree | 25 (100.0%) | 0 (0.0%) |
| Bachelor's Degree | 10 (100.0%) | 0 (0.0%) |
| Graduate Degree | 0 (0.0%) | 0 (0.0%) |
| Total | 61 (100.0%) | 0 (0.0%) |
Employment Characteristics in Malad City
Employment by Class of Employer in Malad City
Among the 993 employed individuals in Malad City, private company employees (646 | 65.1%), local government employees (130 | 13.1%), and self-employed (not incorporated) (64 | 6.5%) make up the most common classes of employment.
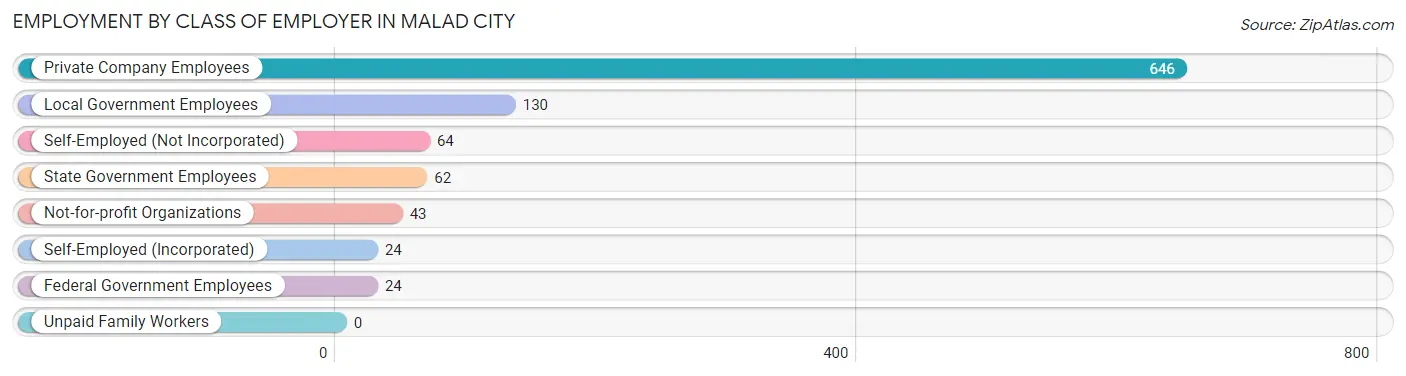
| Employer Class | # Employees | % Employees |
| Private Company Employees | 646 | 65.1% |
| Self-Employed (Incorporated) | 24 | 2.4% |
| Self-Employed (Not Incorporated) | 64 | 6.5% |
| Not-for-profit Organizations | 43 | 4.3% |
| Local Government Employees | 130 | 13.1% |
| State Government Employees | 62 | 6.2% |
| Federal Government Employees | 24 | 2.4% |
| Unpaid Family Workers | 0 | 0.0% |
| Total | 993 | 100.0% |
Employment Status by Age in Malad City
According to the labor force statistics for Malad City, out of the total population over 16 years of age (1,682), 59.3% or 997 individuals are in the labor force, with 0.4% or 4 of them unemployed. The age group with the highest labor force participation rate is 25 to 29 years, with 100.0% or 107 individuals in the labor force. Within the labor force, the 30 to 34 years age range has the highest percentage of unemployed individuals, with 3.9% or 4 of them being unemployed.
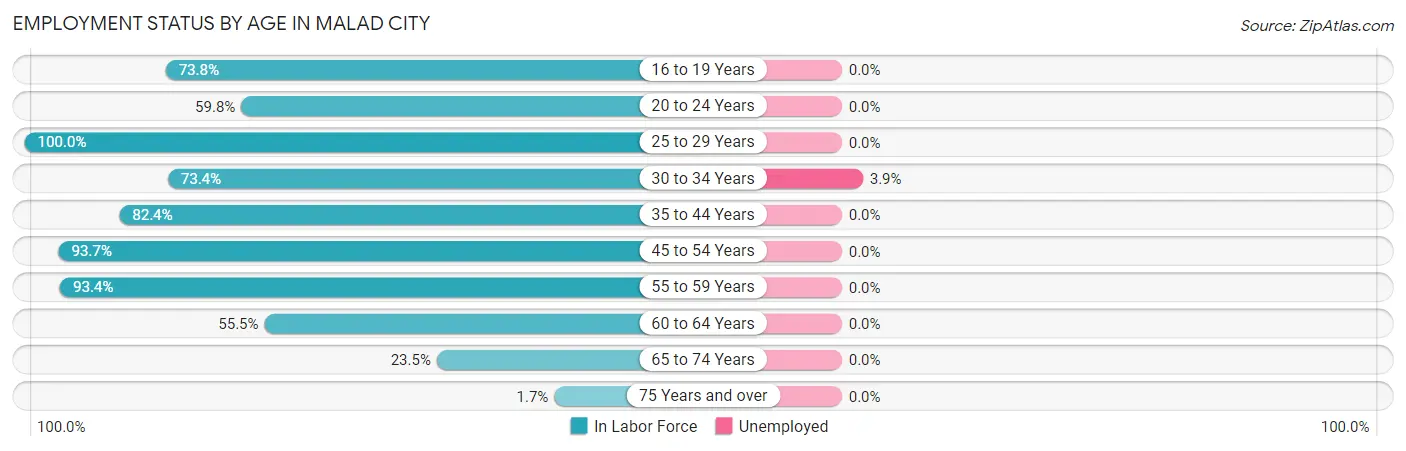
| Age Bracket | In Labor Force | Unemployed |
| 16 to 19 Years | 93 (73.8%) | 0 (0.0%) |
| 20 to 24 Years | 49 (59.8%) | 0 (0.0%) |
| 25 to 29 Years | 107 (100.0%) | 0 (0.0%) |
| 30 to 34 Years | 102 (73.4%) | 4 (3.9%) |
| 35 to 44 Years | 215 (82.4%) | 0 (0.0%) |
| 45 to 54 Years | 194 (93.7%) | 0 (0.0%) |
| 55 to 59 Years | 114 (93.4%) | 0 (0.0%) |
| 60 to 64 Years | 66 (55.5%) | 0 (0.0%) |
| 65 to 74 Years | 52 (23.5%) | 0 (0.0%) |
| 75 Years and over | 5 (1.7%) | 0 (0.0%) |
| Total | 997 (59.3%) | 4 (0.4%) |
Employment Status by Educational Attainment in Malad City
According to labor force statistics for Malad City, 83.6% of individuals (798) out of the total population between 25 and 64 years of age (955) are in the labor force, with 0.5% or 4 of them being unemployed. The group with the highest labor force participation rate are those with the educational attainment of bachelor's degree or higher, with 95.8% or 228 individuals in the labor force. Within the labor force, individuals with bachelor's degree or higher education have the highest percentage of unemployment, with 1.8% or 4 of them being unemployed.
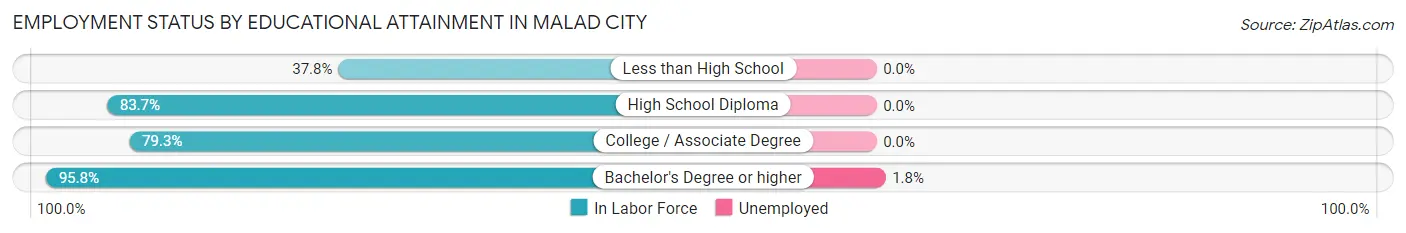
| Educational Attainment | In Labor Force | Unemployed |
| Less than High School | 14 (37.8%) | 0 (0.0%) |
| High School Diploma | 323 (83.7%) | 0 (0.0%) |
| College / Associate Degree | 233 (79.3%) | 0 (0.0%) |
| Bachelor's Degree or higher | 228 (95.8%) | 4 (1.8%) |
| Total | 798 (83.6%) | 5 (0.5%) |
Employment Occupations by Sex in Malad City
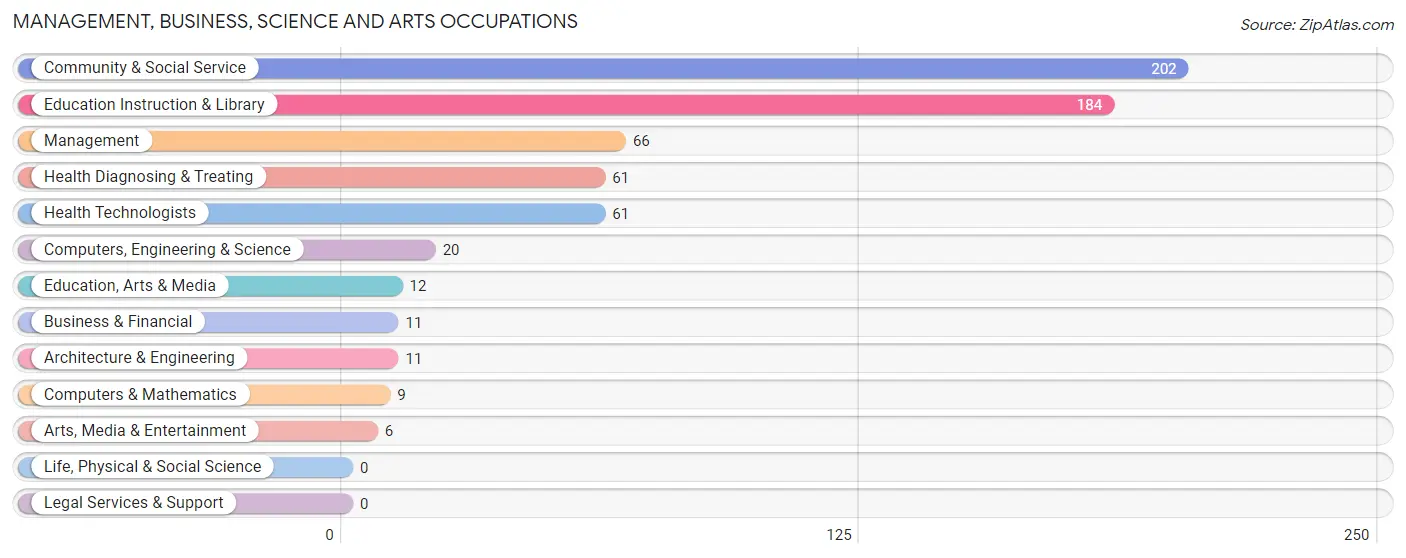
Management, Business, Science and Arts Occupations
The most common Management, Business, Science and Arts occupations in Malad City are Community & Social Service (202 | 20.5%), Education Instruction & Library (184 | 18.7%), Management (66 | 6.7%), Health Diagnosing & Treating (61 | 6.2%), and Health Technologists (61 | 6.2%).
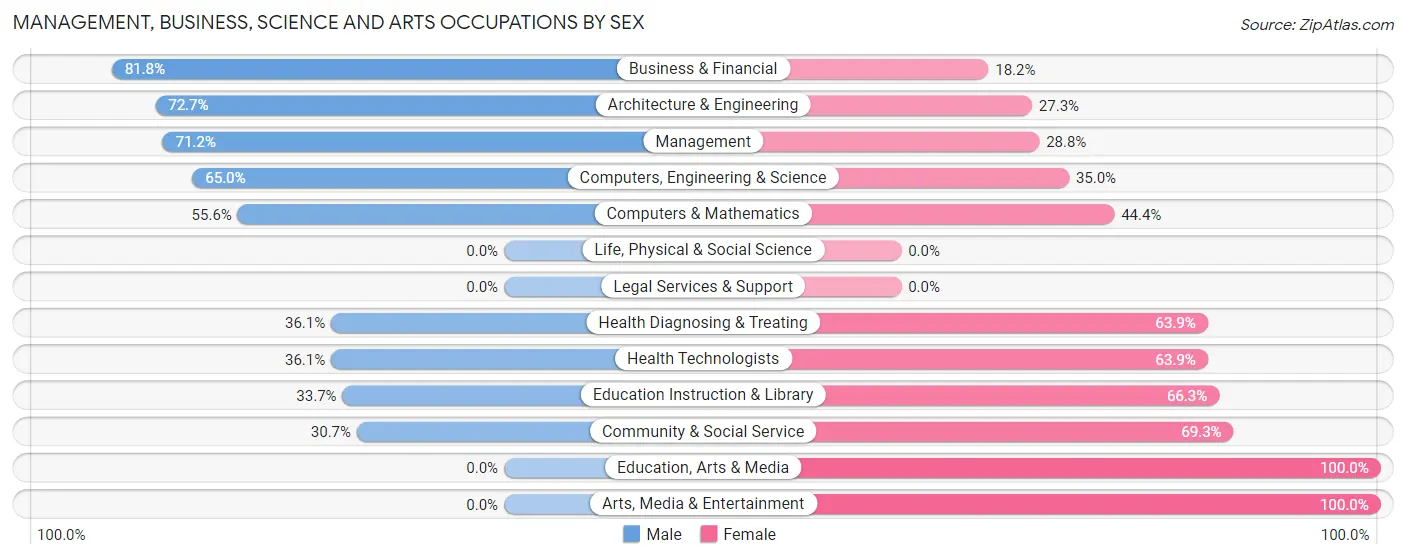
Management, Business, Science and Arts Occupations by Sex
Within the Management, Business, Science and Arts occupations in Malad City, the most male-oriented occupations are Business & Financial (81.8%), Architecture & Engineering (72.7%), and Management (71.2%), while the most female-oriented occupations are Education, Arts & Media (100.0%), Arts, Media & Entertainment (100.0%), and Community & Social Service (69.3%).
| Occupation | Male | Female |
| Management | 47 (71.2%) | 19 (28.8%) |
| Business & Financial | 9 (81.8%) | 2 (18.2%) |
| Computers, Engineering & Science | 13 (65.0%) | 7 (35.0%) |
| Computers & Mathematics | 5 (55.6%) | 4 (44.4%) |
| Architecture & Engineering | 8 (72.7%) | 3 (27.3%) |
| Life, Physical & Social Science | 0 (0.0%) | 0 (0.0%) |
| Community & Social Service | 62 (30.7%) | 140 (69.3%) |
| Education, Arts & Media | 0 (0.0%) | 12 (100.0%) |
| Legal Services & Support | 0 (0.0%) | 0 (0.0%) |
| Education Instruction & Library | 62 (33.7%) | 122 (66.3%) |
| Arts, Media & Entertainment | 0 (0.0%) | 6 (100.0%) |
| Health Diagnosing & Treating | 22 (36.1%) | 39 (63.9%) |
| Health Technologists | 22 (36.1%) | 39 (63.9%) |
| Total (Category) | 153 (42.5%) | 207 (57.5%) |
| Total (Overall) | 527 (53.4%) | 459 (46.6%) |
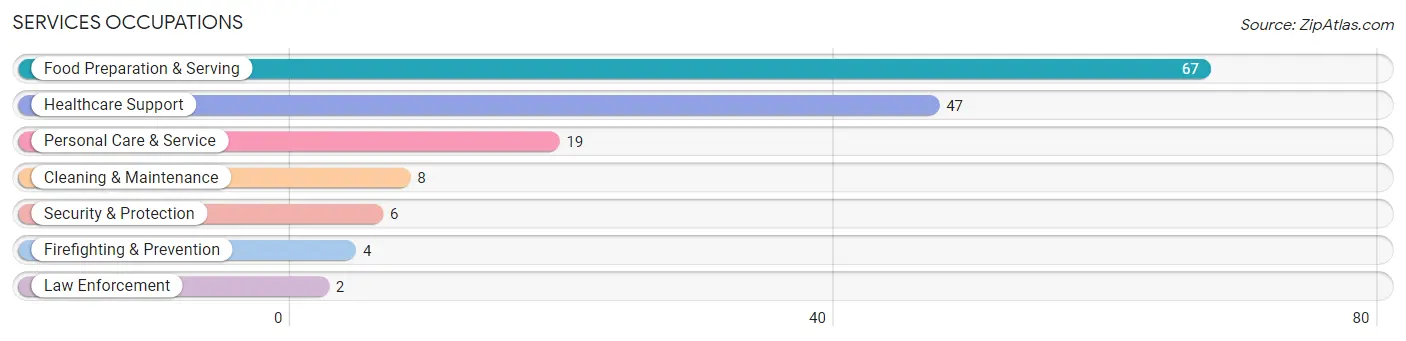
Services Occupations
The most common Services occupations in Malad City are Food Preparation & Serving (67 | 6.8%), Healthcare Support (47 | 4.8%), Personal Care & Service (19 | 1.9%), Cleaning & Maintenance (8 | 0.8%), and Security & Protection (6 | 0.6%).
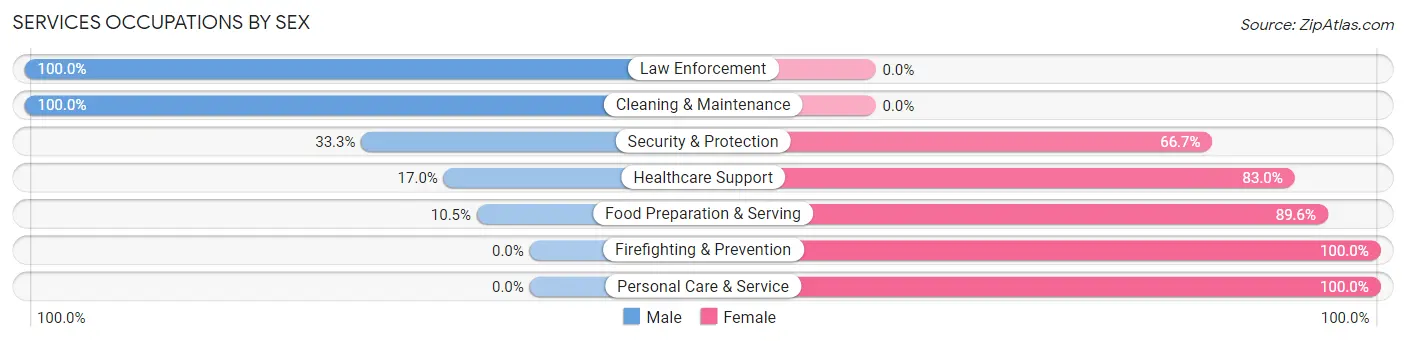
Services Occupations by Sex
Within the Services occupations in Malad City, the most male-oriented occupations are Law Enforcement (100.0%), Cleaning & Maintenance (100.0%), and Security & Protection (33.3%), while the most female-oriented occupations are Firefighting & Prevention (100.0%), Personal Care & Service (100.0%), and Food Preparation & Serving (89.5%).
| Occupation | Male | Female |
| Healthcare Support | 8 (17.0%) | 39 (83.0%) |
| Security & Protection | 2 (33.3%) | 4 (66.7%) |
| Firefighting & Prevention | 0 (0.0%) | 4 (100.0%) |
| Law Enforcement | 2 (100.0%) | 0 (0.0%) |
| Food Preparation & Serving | 7 (10.4%) | 60 (89.5%) |
| Cleaning & Maintenance | 8 (100.0%) | 0 (0.0%) |
| Personal Care & Service | 0 (0.0%) | 19 (100.0%) |
| Total (Category) | 25 (17.0%) | 122 (83.0%) |
| Total (Overall) | 527 (53.4%) | 459 (46.6%) |
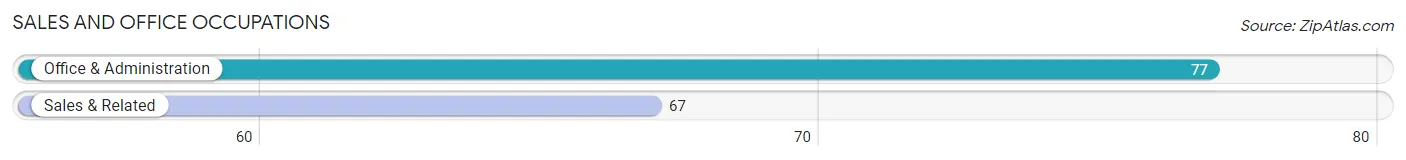
Sales and Office Occupations
The most common Sales and Office occupations in Malad City are Office & Administration (77 | 7.8%), and Sales & Related (67 | 6.8%).
Sales and Office Occupations by Sex
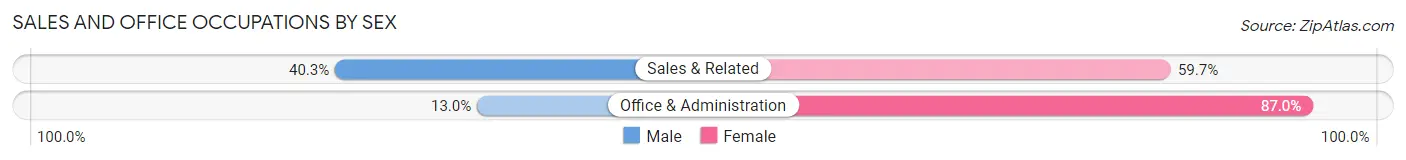
| Occupation | Male | Female |
| Sales & Related | 27 (40.3%) | 40 (59.7%) |
| Office & Administration | 10 (13.0%) | 67 (87.0%) |
| Total (Category) | 37 (25.7%) | 107 (74.3%) |
| Total (Overall) | 527 (53.4%) | 459 (46.6%) |
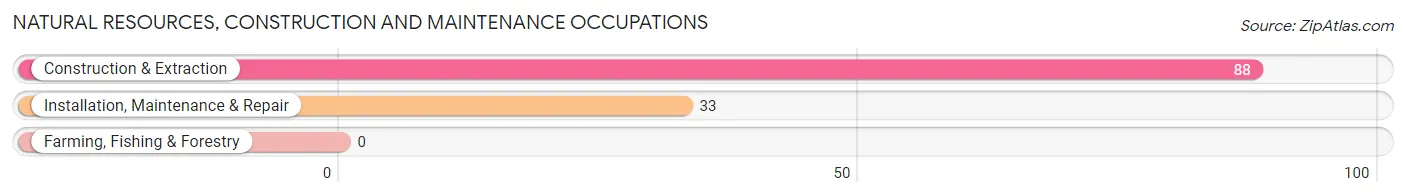
Natural Resources, Construction and Maintenance Occupations
The most common Natural Resources, Construction and Maintenance occupations in Malad City are Construction & Extraction (88 | 8.9%), and Installation, Maintenance & Repair (33 | 3.4%).
Natural Resources, Construction and Maintenance Occupations by Sex
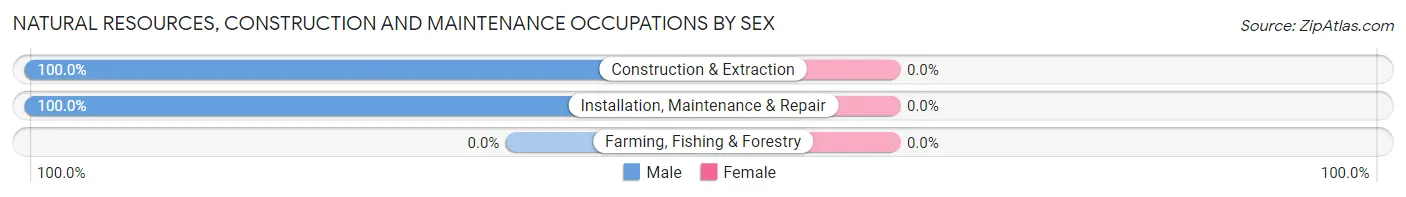
| Occupation | Male | Female |
| Farming, Fishing & Forestry | 0 (0.0%) | 0 (0.0%) |
| Construction & Extraction | 88 (100.0%) | 0 (0.0%) |
| Installation, Maintenance & Repair | 33 (100.0%) | 0 (0.0%) |
| Total (Category) | 121 (100.0%) | 0 (0.0%) |
| Total (Overall) | 527 (53.4%) | 459 (46.6%) |
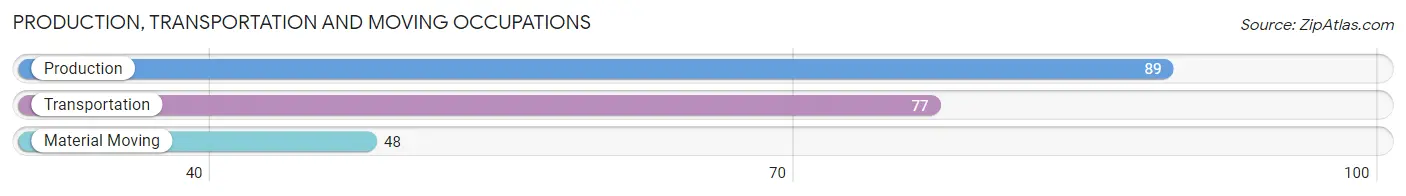
Production, Transportation and Moving Occupations
The most common Production, Transportation and Moving occupations in Malad City are Production (89 | 9.0%), Transportation (77 | 7.8%), and Material Moving (48 | 4.9%).
Production, Transportation and Moving Occupations by Sex
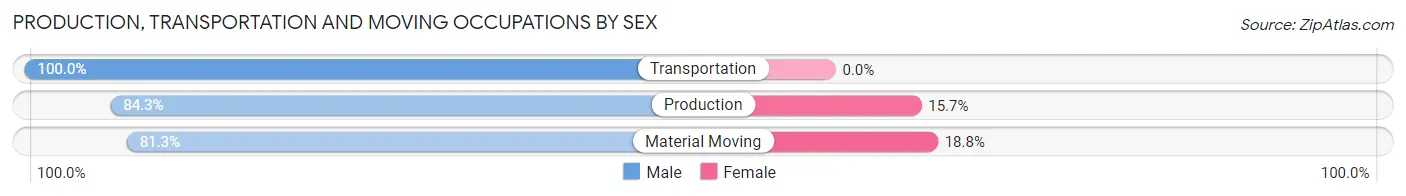
| Occupation | Male | Female |
| Production | 75 (84.3%) | 14 (15.7%) |
| Transportation | 77 (100.0%) | 0 (0.0%) |
| Material Moving | 39 (81.2%) | 9 (18.8%) |
| Total (Category) | 191 (89.2%) | 23 (10.7%) |
| Total (Overall) | 527 (53.4%) | 459 (46.6%) |
Employment Industries by Sex in Malad City
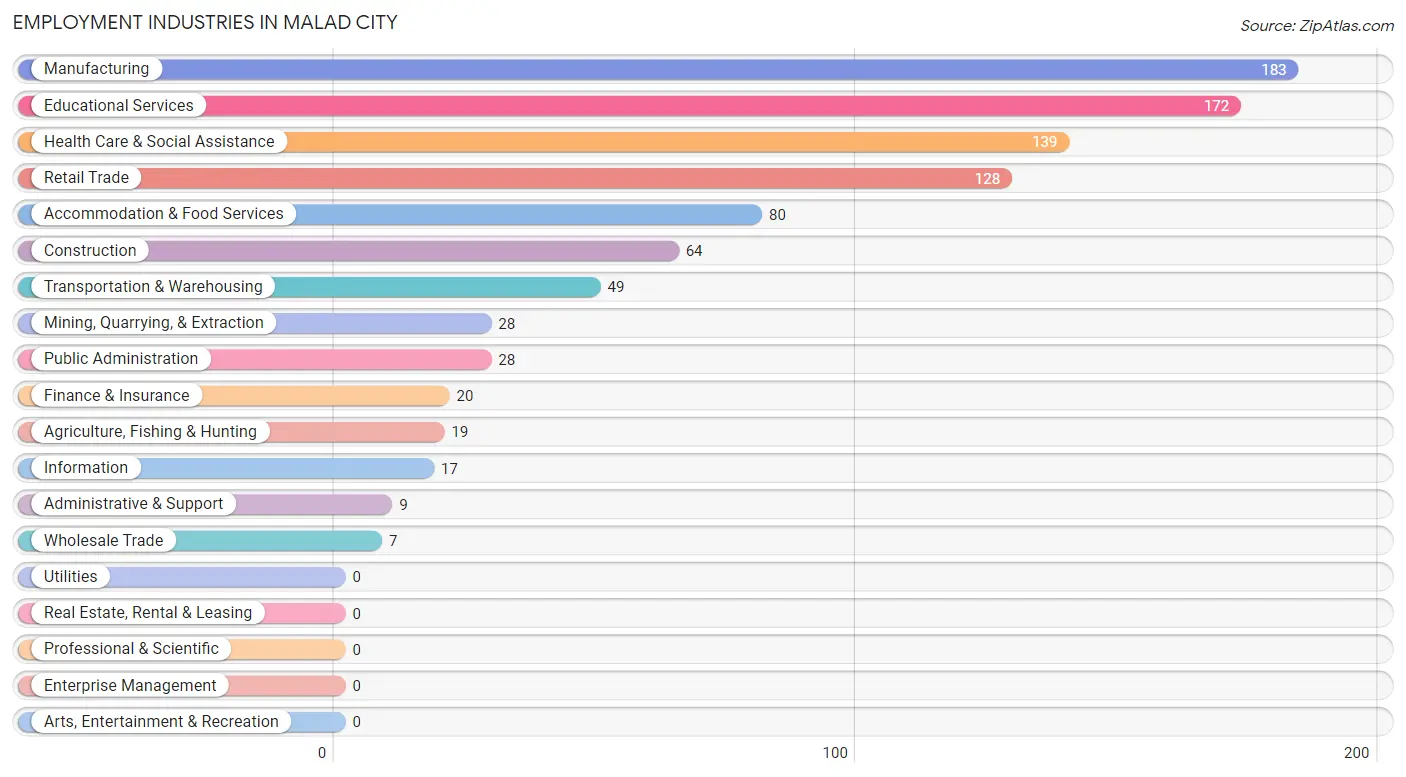
Employment Industries in Malad City
The major employment industries in Malad City include Manufacturing (183 | 18.6%), Educational Services (172 | 17.4%), Health Care & Social Assistance (139 | 14.1%), Retail Trade (128 | 13.0%), and Accommodation & Food Services (80 | 8.1%).
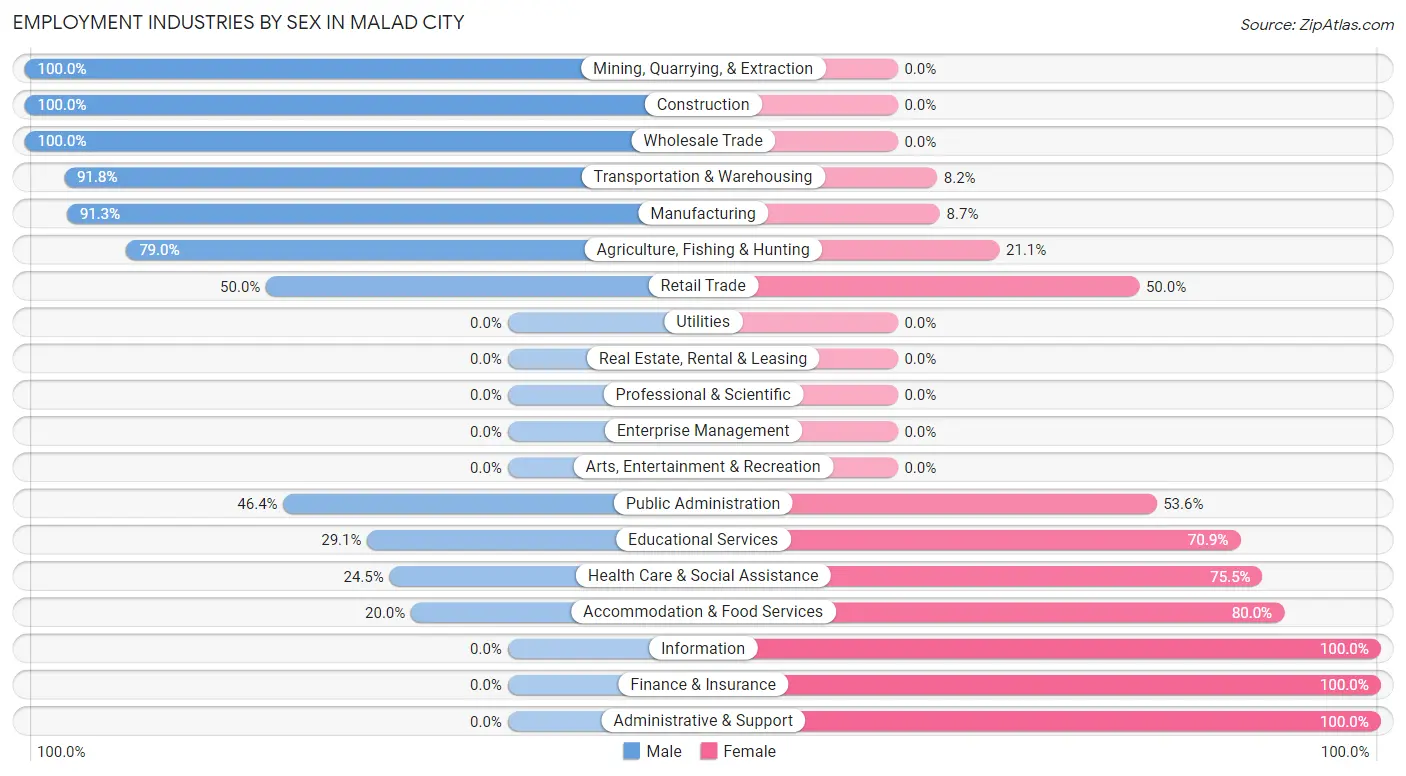
Employment Industries by Sex in Malad City
The Malad City industries that see more men than women are Mining, Quarrying, & Extraction (100.0%), Construction (100.0%), and Wholesale Trade (100.0%), whereas the industries that tend to have a higher number of women are Information (100.0%), Finance & Insurance (100.0%), and Administrative & Support (100.0%).
| Industry | Male | Female |
| Agriculture, Fishing & Hunting | 15 (78.9%) | 4 (21.0%) |
| Mining, Quarrying, & Extraction | 28 (100.0%) | 0 (0.0%) |
| Construction | 64 (100.0%) | 0 (0.0%) |
| Manufacturing | 167 (91.3%) | 16 (8.7%) |
| Wholesale Trade | 7 (100.0%) | 0 (0.0%) |
| Retail Trade | 64 (50.0%) | 64 (50.0%) |
| Transportation & Warehousing | 45 (91.8%) | 4 (8.2%) |
| Utilities | 0 (0.0%) | 0 (0.0%) |
| Information | 0 (0.0%) | 17 (100.0%) |
| Finance & Insurance | 0 (0.0%) | 20 (100.0%) |
| Real Estate, Rental & Leasing | 0 (0.0%) | 0 (0.0%) |
| Professional & Scientific | 0 (0.0%) | 0 (0.0%) |
| Enterprise Management | 0 (0.0%) | 0 (0.0%) |
| Administrative & Support | 0 (0.0%) | 9 (100.0%) |
| Educational Services | 50 (29.1%) | 122 (70.9%) |
| Health Care & Social Assistance | 34 (24.5%) | 105 (75.5%) |
| Arts, Entertainment & Recreation | 0 (0.0%) | 0 (0.0%) |
| Accommodation & Food Services | 16 (20.0%) | 64 (80.0%) |
| Public Administration | 13 (46.4%) | 15 (53.6%) |
| Total | 527 (53.4%) | 459 (46.6%) |
Education in Malad City
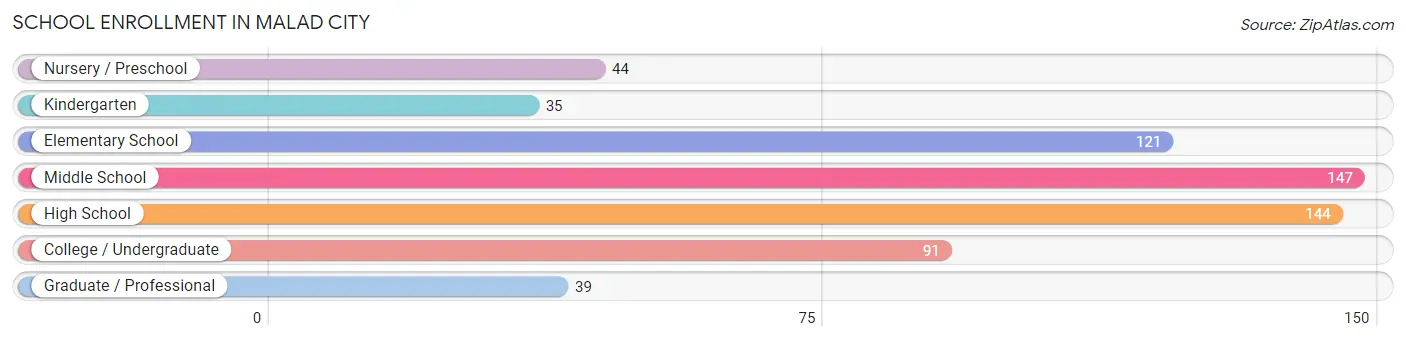
School Enrollment in Malad City
The most common levels of schooling among the 621 students in Malad City are middle school (147 | 23.7%), high school (144 | 23.2%), and elementary school (121 | 19.5%).
| School Level | # Students | % Students |
| Nursery / Preschool | 44 | 7.1% |
| Kindergarten | 35 | 5.6% |
| Elementary School | 121 | 19.5% |
| Middle School | 147 | 23.7% |
| High School | 144 | 23.2% |
| College / Undergraduate | 91 | 14.6% |
| Graduate / Professional | 39 | 6.3% |
| Total | 621 | 100.0% |
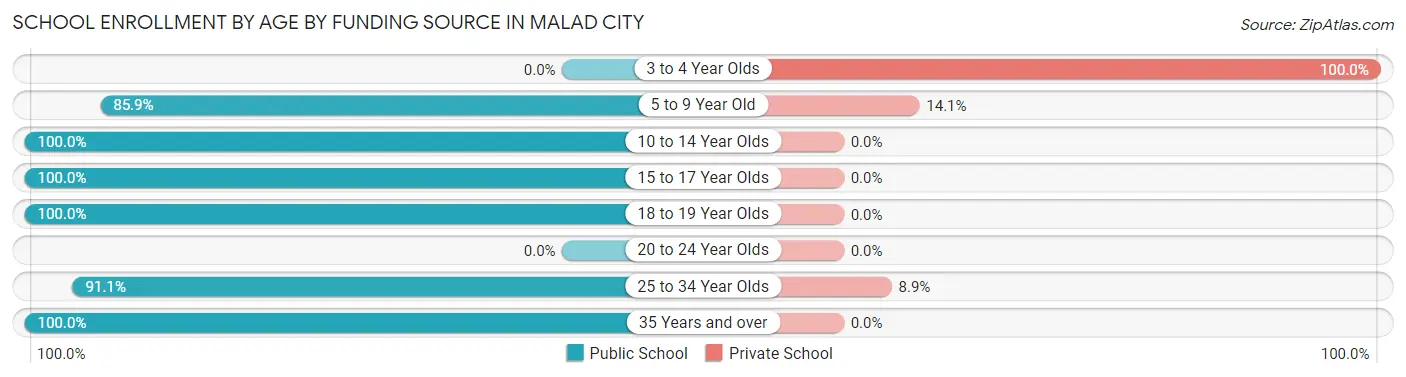
School Enrollment by Age by Funding Source in Malad City
Out of a total of 621 students who are enrolled in schools in Malad City, 53 (8.5%) attend a private institution, while the remaining 568 (91.5%) are enrolled in public schools. The age group of 3 to 4 year olds has the highest likelihood of being enrolled in private schools, with 26 (100.0% in the age bracket) enrolled. Conversely, the age group of 10 to 14 year olds has the lowest likelihood of being enrolled in a private school, with 200 (100.0% in the age bracket) attending a public institution.
| Age Bracket | Public School | Private School |
| 3 to 4 Year Olds | 0 (0.0%) | 26 (100.0%) |
| 5 to 9 Year Old | 134 (85.9%) | 22 (14.1%) |
| 10 to 14 Year Olds | 200 (100.0%) | 0 (0.0%) |
| 15 to 17 Year Olds | 97 (100.0%) | 0 (0.0%) |
| 18 to 19 Year Olds | 25 (100.0%) | 0 (0.0%) |
| 20 to 24 Year Olds | 0 (0.0%) | 0 (0.0%) |
| 25 to 34 Year Olds | 51 (91.1%) | 5 (8.9%) |
| 35 Years and over | 61 (100.0%) | 0 (0.0%) |
| Total | 568 (91.5%) | 53 (8.5%) |
Educational Attainment by Field of Study in Malad City
Education (104 | 28.0%), science & technology (71 | 19.1%), bio, nature & agricultural (61 | 16.4%), engineering (33 | 8.9%), and visual & performing arts (24 | 6.5%) are the most common fields of study among 371 individuals in Malad City who have obtained a bachelor's degree or higher.
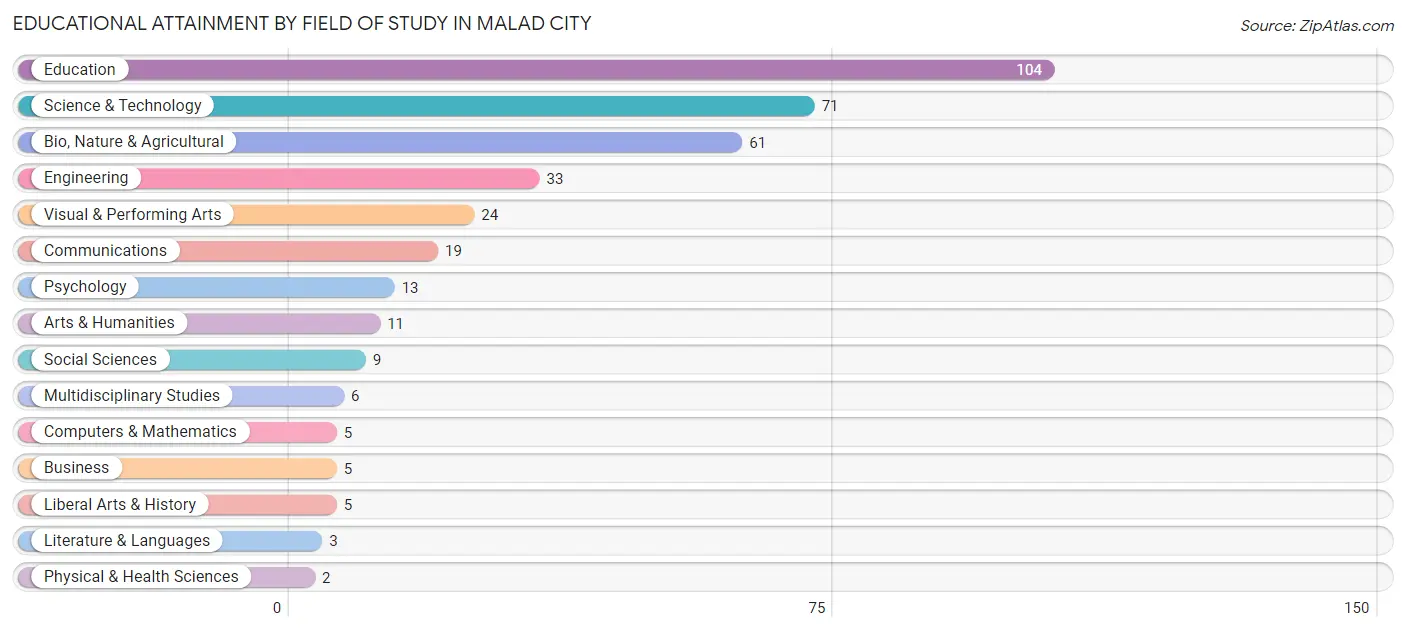
| Field of Study | # Graduates | % Graduates |
| Computers & Mathematics | 5 | 1.3% |
| Bio, Nature & Agricultural | 61 | 16.4% |
| Physical & Health Sciences | 2 | 0.5% |
| Psychology | 13 | 3.5% |
| Social Sciences | 9 | 2.4% |
| Engineering | 33 | 8.9% |
| Multidisciplinary Studies | 6 | 1.6% |
| Science & Technology | 71 | 19.1% |
| Business | 5 | 1.3% |
| Education | 104 | 28.0% |
| Literature & Languages | 3 | 0.8% |
| Liberal Arts & History | 5 | 1.3% |
| Visual & Performing Arts | 24 | 6.5% |
| Communications | 19 | 5.1% |
| Arts & Humanities | 11 | 3.0% |
| Total | 371 | 100.0% |
Transportation & Commute in Malad City
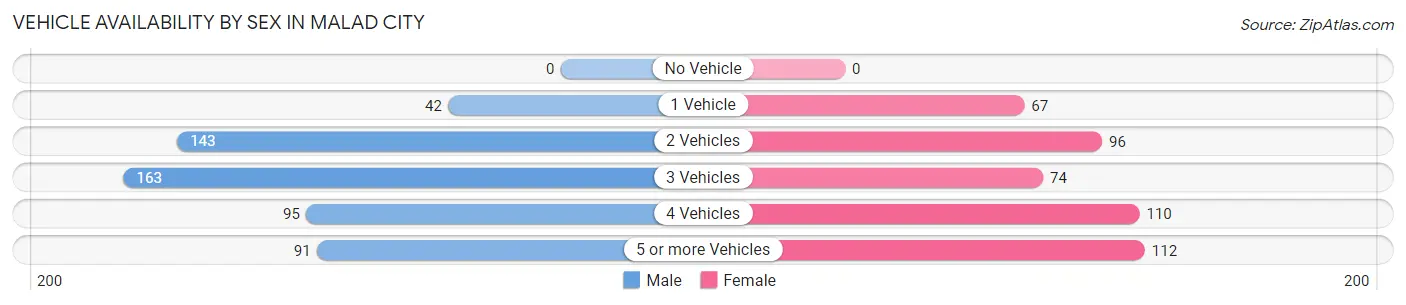
Vehicle Availability by Sex in Malad City
The most prevalent vehicle ownership categories in Malad City are males with 3 vehicles (163, accounting for 30.5%) and females with 3 vehicles (74, making up 35.5%).
| Vehicles Available | Male | Female |
| No Vehicle | 0 (0.0%) | 0 (0.0%) |
| 1 Vehicle | 42 (7.9%) | 67 (14.6%) |
| 2 Vehicles | 143 (26.8%) | 96 (20.9%) |
| 3 Vehicles | 163 (30.5%) | 74 (16.1%) |
| 4 Vehicles | 95 (17.8%) | 110 (24.0%) |
| 5 or more Vehicles | 91 (17.0%) | 112 (24.4%) |
| Total | 534 (100.0%) | 459 (100.0%) |
Commute Time in Malad City
The most frequently occuring commute durations in Malad City are less than 5 minutes (227 commuters, 24.6%), 5 to 9 minutes (214 commuters, 23.2%), and 10 to 14 minutes (121 commuters, 13.1%).
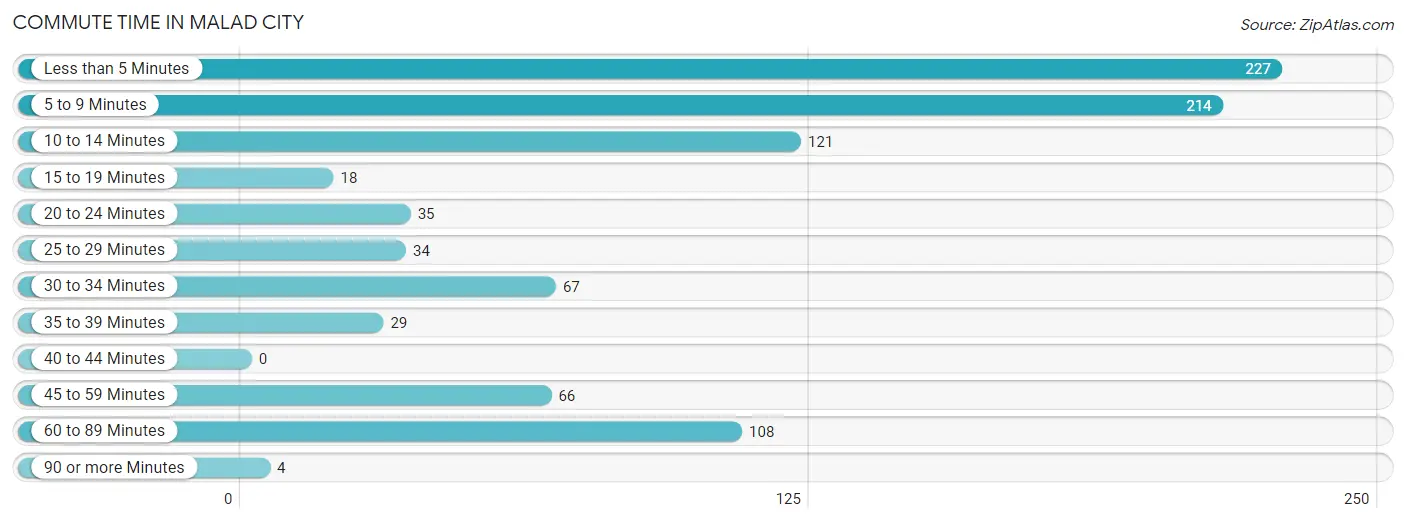
| Commute Time | # Commuters | % Commuters |
| Less than 5 Minutes | 227 | 24.6% |
| 5 to 9 Minutes | 214 | 23.2% |
| 10 to 14 Minutes | 121 | 13.1% |
| 15 to 19 Minutes | 18 | 1.9% |
| 20 to 24 Minutes | 35 | 3.8% |
| 25 to 29 Minutes | 34 | 3.7% |
| 30 to 34 Minutes | 67 | 7.3% |
| 35 to 39 Minutes | 29 | 3.1% |
| 40 to 44 Minutes | 0 | 0.0% |
| 45 to 59 Minutes | 66 | 7.1% |
| 60 to 89 Minutes | 108 | 11.7% |
| 90 or more Minutes | 4 | 0.4% |
Commute Time by Sex in Malad City
The most common commute times in Malad City are 60 to 89 minutes (98 commuters, 19.6%) for males and less than 5 minutes (138 commuters, 32.6%) for females.
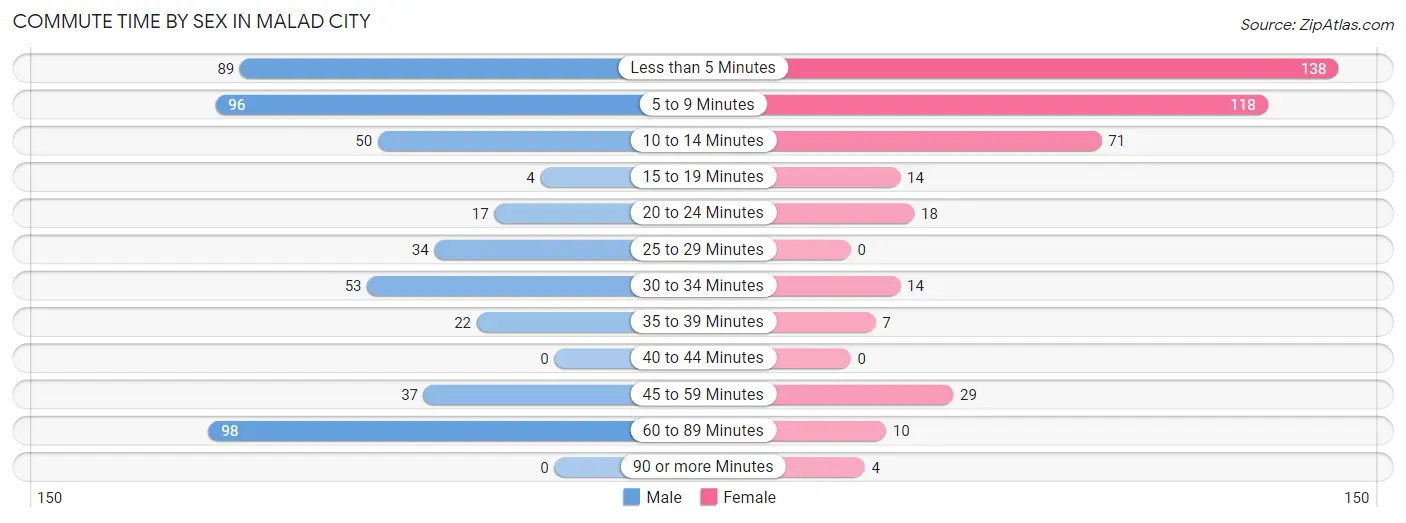
| Commute Time | Male | Female |
| Less than 5 Minutes | 89 (17.8%) | 138 (32.6%) |
| 5 to 9 Minutes | 96 (19.2%) | 118 (27.9%) |
| 10 to 14 Minutes | 50 (10.0%) | 71 (16.8%) |
| 15 to 19 Minutes | 4 (0.8%) | 14 (3.3%) |
| 20 to 24 Minutes | 17 (3.4%) | 18 (4.3%) |
| 25 to 29 Minutes | 34 (6.8%) | 0 (0.0%) |
| 30 to 34 Minutes | 53 (10.6%) | 14 (3.3%) |
| 35 to 39 Minutes | 22 (4.4%) | 7 (1.7%) |
| 40 to 44 Minutes | 0 (0.0%) | 0 (0.0%) |
| 45 to 59 Minutes | 37 (7.4%) | 29 (6.9%) |
| 60 to 89 Minutes | 98 (19.6%) | 10 (2.4%) |
| 90 or more Minutes | 0 (0.0%) | 4 (0.9%) |
Time of Departure to Work by Sex in Malad City
The most frequent times of departure to work in Malad City are 5:30 AM to 5:59 AM (76, 15.2%) for males and 7:00 AM to 7:29 AM (95, 22.5%) for females.
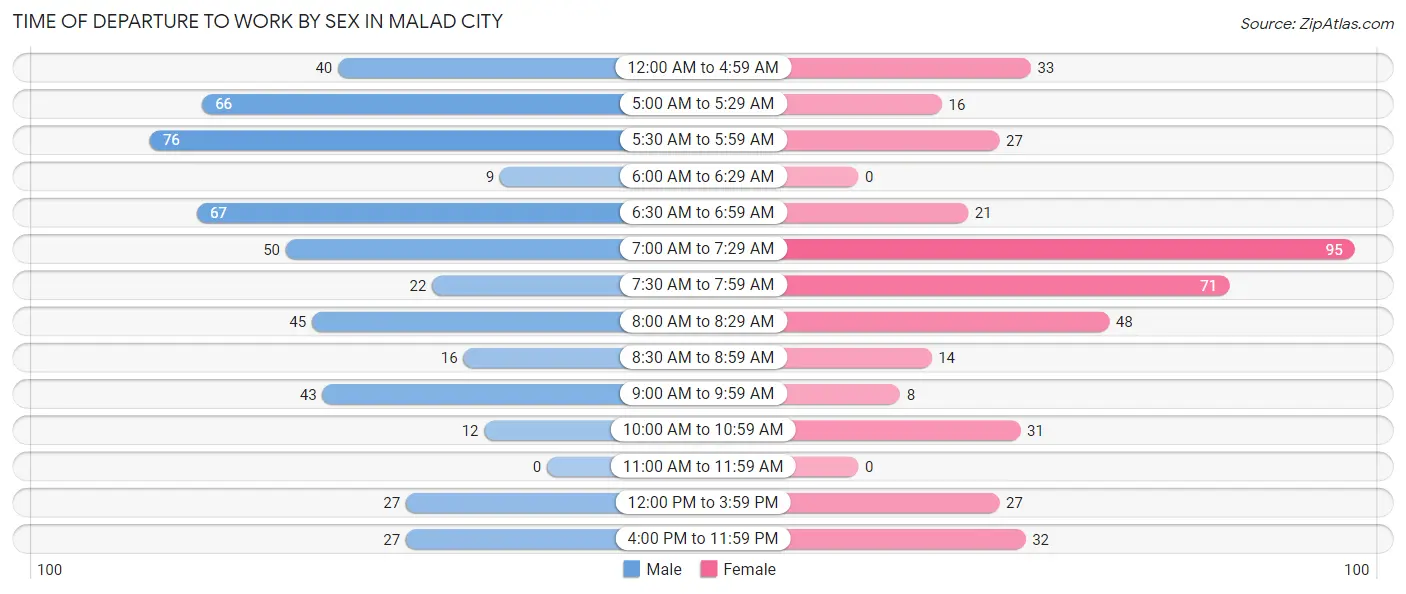
| Time of Departure | Male | Female |
| 12:00 AM to 4:59 AM | 40 (8.0%) | 33 (7.8%) |
| 5:00 AM to 5:29 AM | 66 (13.2%) | 16 (3.8%) |
| 5:30 AM to 5:59 AM | 76 (15.2%) | 27 (6.4%) |
| 6:00 AM to 6:29 AM | 9 (1.8%) | 0 (0.0%) |
| 6:30 AM to 6:59 AM | 67 (13.4%) | 21 (5.0%) |
| 7:00 AM to 7:29 AM | 50 (10.0%) | 95 (22.5%) |
| 7:30 AM to 7:59 AM | 22 (4.4%) | 71 (16.8%) |
| 8:00 AM to 8:29 AM | 45 (9.0%) | 48 (11.4%) |
| 8:30 AM to 8:59 AM | 16 (3.2%) | 14 (3.3%) |
| 9:00 AM to 9:59 AM | 43 (8.6%) | 8 (1.9%) |
| 10:00 AM to 10:59 AM | 12 (2.4%) | 31 (7.3%) |
| 11:00 AM to 11:59 AM | 0 (0.0%) | 0 (0.0%) |
| 12:00 PM to 3:59 PM | 27 (5.4%) | 27 (6.4%) |
| 4:00 PM to 11:59 PM | 27 (5.4%) | 32 (7.6%) |
| Total | 500 (100.0%) | 423 (100.0%) |
Housing Occupancy in Malad City
Occupancy by Ownership in Malad City
Of the total 897 dwellings in Malad City, owner-occupied units account for 807 (90.0%), while renter-occupied units make up 90 (10.0%).
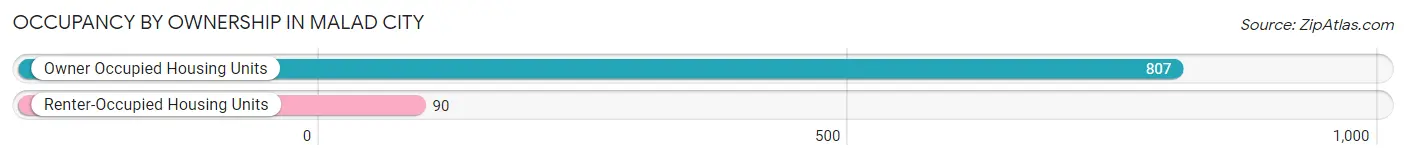
| Occupancy | # Housing Units | % Housing Units |
| Owner Occupied Housing Units | 807 | 90.0% |
| Renter-Occupied Housing Units | 90 | 10.0% |
| Total Occupied Housing Units | 897 | 100.0% |
Occupancy by Household Size in Malad City
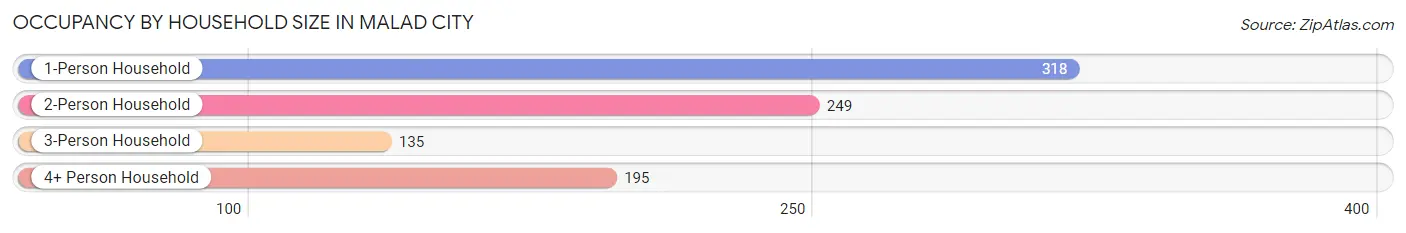
| Household Size | # Housing Units | % Housing Units |
| 1-Person Household | 318 | 35.4% |
| 2-Person Household | 249 | 27.8% |
| 3-Person Household | 135 | 15.0% |
| 4+ Person Household | 195 | 21.7% |
| Total Housing Units | 897 | 100.0% |
Occupancy by Ownership by Household Size in Malad City
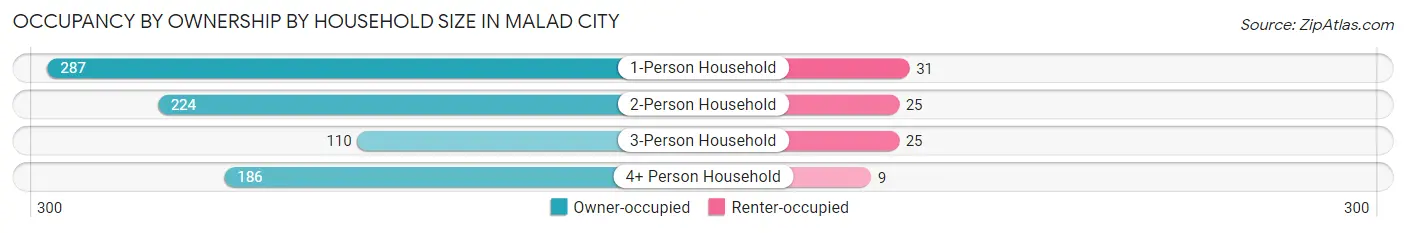
| Household Size | Owner-occupied | Renter-occupied |
| 1-Person Household | 287 (90.2%) | 31 (9.8%) |
| 2-Person Household | 224 (90.0%) | 25 (10.0%) |
| 3-Person Household | 110 (81.5%) | 25 (18.5%) |
| 4+ Person Household | 186 (95.4%) | 9 (4.6%) |
| Total Housing Units | 807 (90.0%) | 90 (10.0%) |
Occupancy by Educational Attainment in Malad City
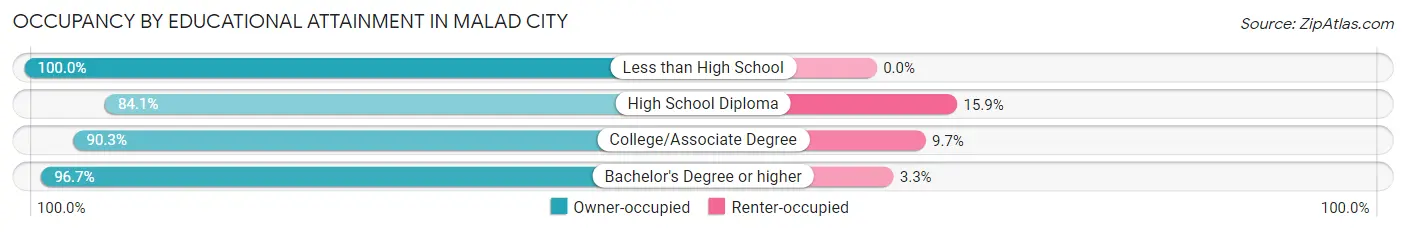
| Household Size | Owner-occupied | Renter-occupied |
| Less than High School | 71 (100.0%) | 0 (0.0%) |
| High School Diploma | 290 (84.1%) | 55 (15.9%) |
| College/Associate Degree | 270 (90.3%) | 29 (9.7%) |
| Bachelor's Degree or higher | 176 (96.7%) | 6 (3.3%) |
Occupancy by Age of Householder in Malad City
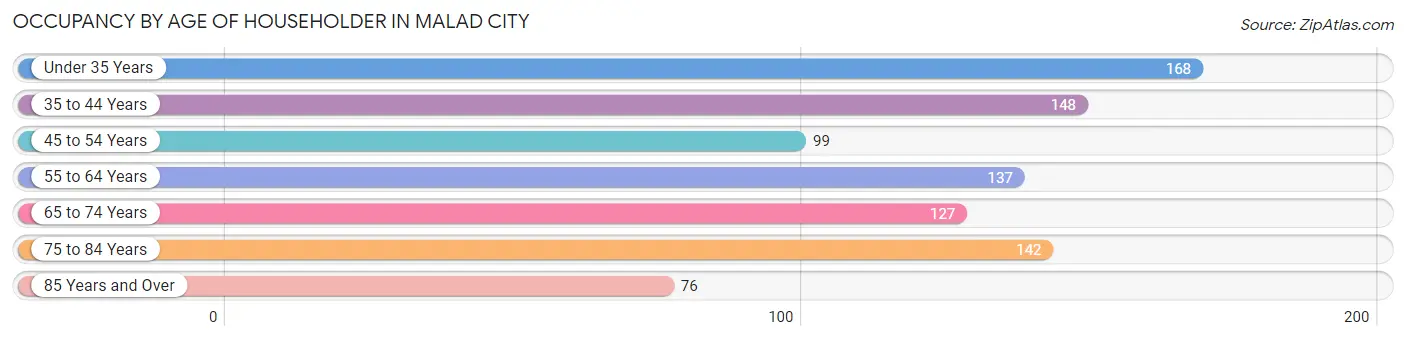
| Age Bracket | # Households | % Households |
| Under 35 Years | 168 | 18.7% |
| 35 to 44 Years | 148 | 16.5% |
| 45 to 54 Years | 99 | 11.0% |
| 55 to 64 Years | 137 | 15.3% |
| 65 to 74 Years | 127 | 14.2% |
| 75 to 84 Years | 142 | 15.8% |
| 85 Years and Over | 76 | 8.5% |
| Total | 897 | 100.0% |
Housing Finances in Malad City
Median Income by Occupancy in Malad City
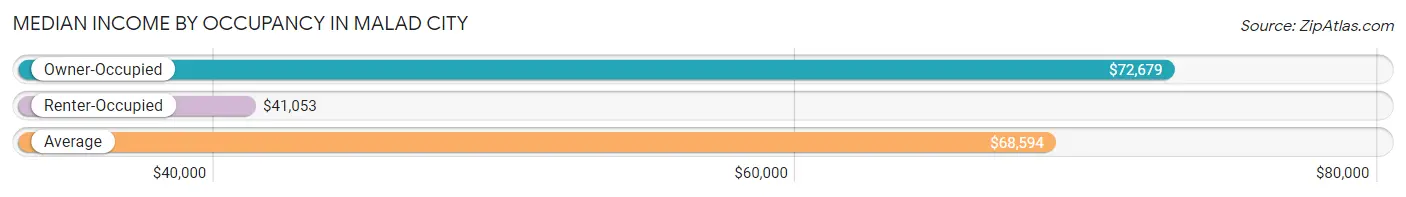
| Occupancy Type | # Households | Median Income |
| Owner-Occupied | 807 (90.0%) | $72,679 |
| Renter-Occupied | 90 (10.0%) | $41,053 |
| Average | 897 (100.0%) | $68,594 |
Occupancy by Householder Income Bracket in Malad City
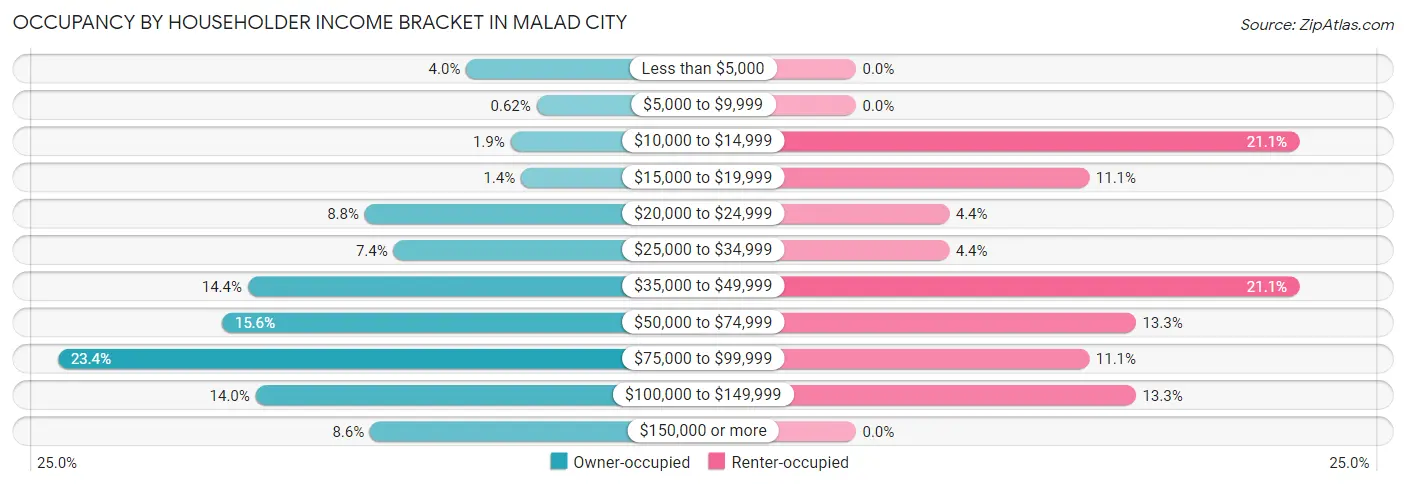
| Income Bracket | Owner-occupied | Renter-occupied |
| Less than $5,000 | 32 (4.0%) | 0 (0.0%) |
| $5,000 to $9,999 | 5 (0.6%) | 0 (0.0%) |
| $10,000 to $14,999 | 15 (1.9%) | 19 (21.1%) |
| $15,000 to $19,999 | 11 (1.4%) | 10 (11.1%) |
| $20,000 to $24,999 | 71 (8.8%) | 4 (4.4%) |
| $25,000 to $34,999 | 60 (7.4%) | 4 (4.4%) |
| $35,000 to $49,999 | 116 (14.4%) | 19 (21.1%) |
| $50,000 to $74,999 | 126 (15.6%) | 12 (13.3%) |
| $75,000 to $99,999 | 189 (23.4%) | 10 (11.1%) |
| $100,000 to $149,999 | 113 (14.0%) | 12 (13.3%) |
| $150,000 or more | 69 (8.6%) | 0 (0.0%) |
| Total | 807 (100.0%) | 90 (100.0%) |
Monthly Housing Cost Tiers in Malad City
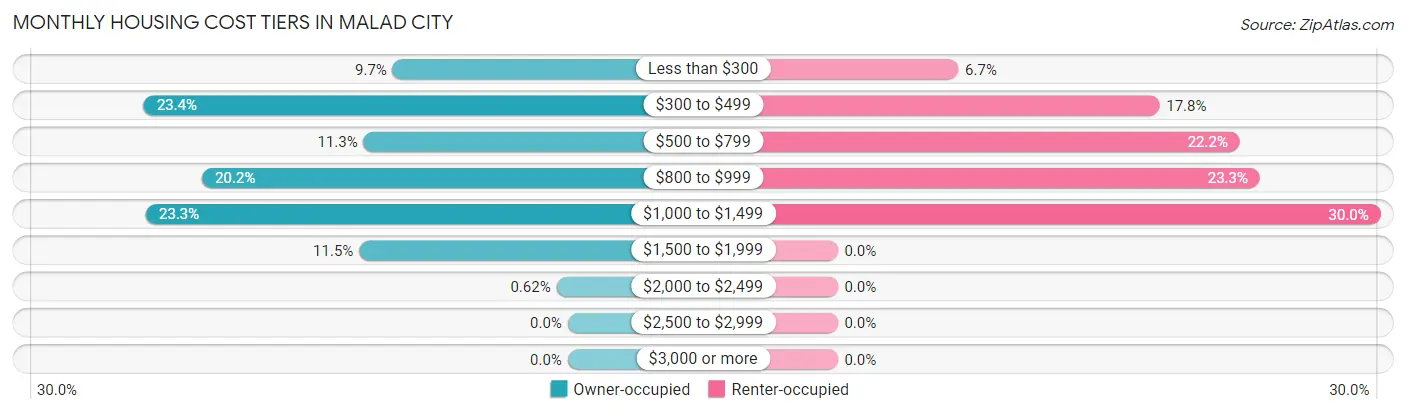
| Monthly Cost | Owner-occupied | Renter-occupied |
| Less than $300 | 78 (9.7%) | 6 (6.7%) |
| $300 to $499 | 189 (23.4%) | 16 (17.8%) |
| $500 to $799 | 91 (11.3%) | 20 (22.2%) |
| $800 to $999 | 163 (20.2%) | 21 (23.3%) |
| $1,000 to $1,499 | 188 (23.3%) | 27 (30.0%) |
| $1,500 to $1,999 | 93 (11.5%) | 0 (0.0%) |
| $2,000 to $2,499 | 5 (0.6%) | 0 (0.0%) |
| $2,500 to $2,999 | 0 (0.0%) | 0 (0.0%) |
| $3,000 or more | 0 (0.0%) | 0 (0.0%) |
| Total | 807 (100.0%) | 90 (100.0%) |
Physical Housing Characteristics in Malad City
Housing Structures in Malad City
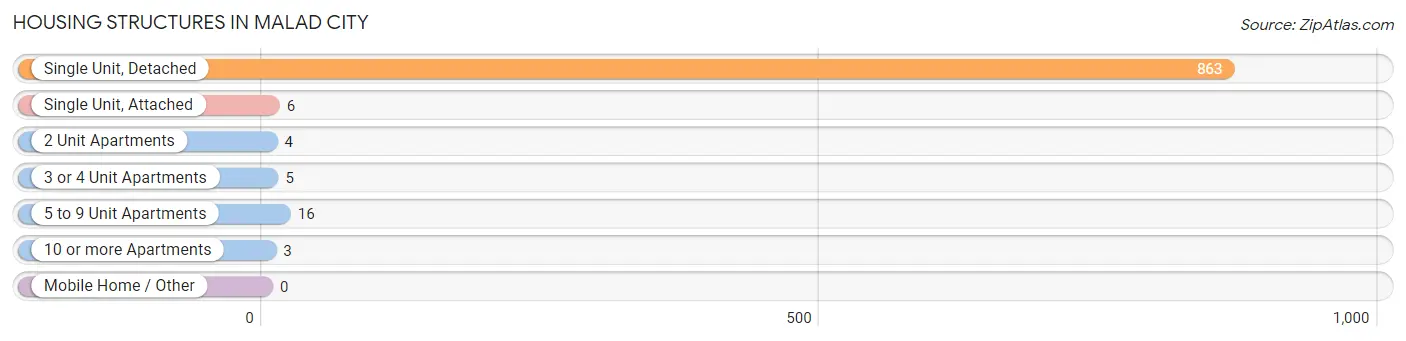
| Structure Type | # Housing Units | % Housing Units |
| Single Unit, Detached | 863 | 96.2% |
| Single Unit, Attached | 6 | 0.7% |
| 2 Unit Apartments | 4 | 0.4% |
| 3 or 4 Unit Apartments | 5 | 0.6% |
| 5 to 9 Unit Apartments | 16 | 1.8% |
| 10 or more Apartments | 3 | 0.3% |
| Mobile Home / Other | 0 | 0.0% |
| Total | 897 | 100.0% |
Housing Structures by Occupancy in Malad City
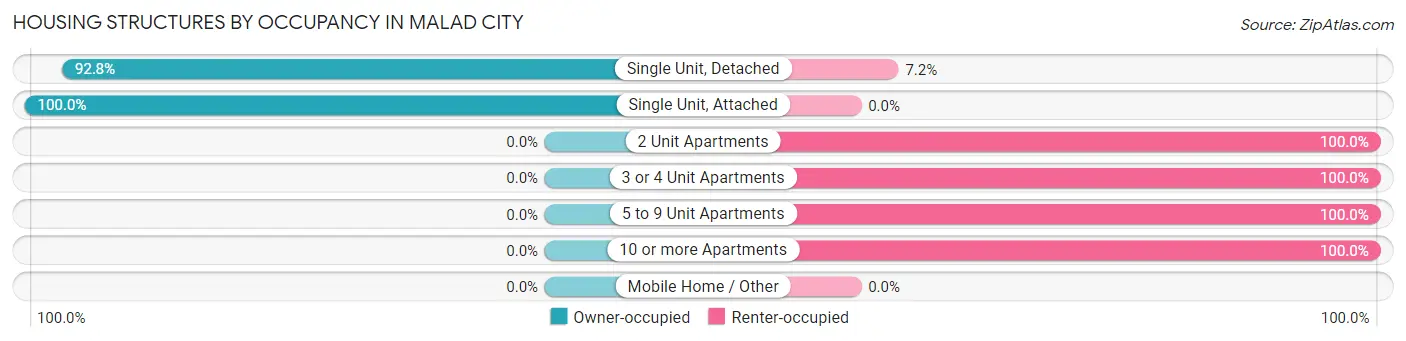
| Structure Type | Owner-occupied | Renter-occupied |
| Single Unit, Detached | 801 (92.8%) | 62 (7.2%) |
| Single Unit, Attached | 6 (100.0%) | 0 (0.0%) |
| 2 Unit Apartments | 0 (0.0%) | 4 (100.0%) |
| 3 or 4 Unit Apartments | 0 (0.0%) | 5 (100.0%) |
| 5 to 9 Unit Apartments | 0 (0.0%) | 16 (100.0%) |
| 10 or more Apartments | 0 (0.0%) | 3 (100.0%) |
| Mobile Home / Other | 0 (0.0%) | 0 (0.0%) |
| Total | 807 (90.0%) | 90 (10.0%) |
Housing Structures by Number of Rooms in Malad City
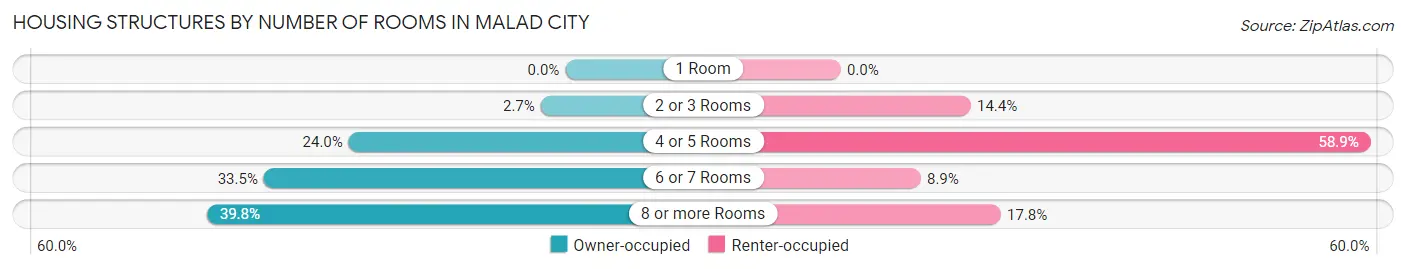
| Number of Rooms | Owner-occupied | Renter-occupied |
| 1 Room | 0 (0.0%) | 0 (0.0%) |
| 2 or 3 Rooms | 22 (2.7%) | 13 (14.4%) |
| 4 or 5 Rooms | 194 (24.0%) | 53 (58.9%) |
| 6 or 7 Rooms | 270 (33.5%) | 8 (8.9%) |
| 8 or more Rooms | 321 (39.8%) | 16 (17.8%) |
| Total | 807 (100.0%) | 90 (100.0%) |
Housing Structure by Heating Type in Malad City
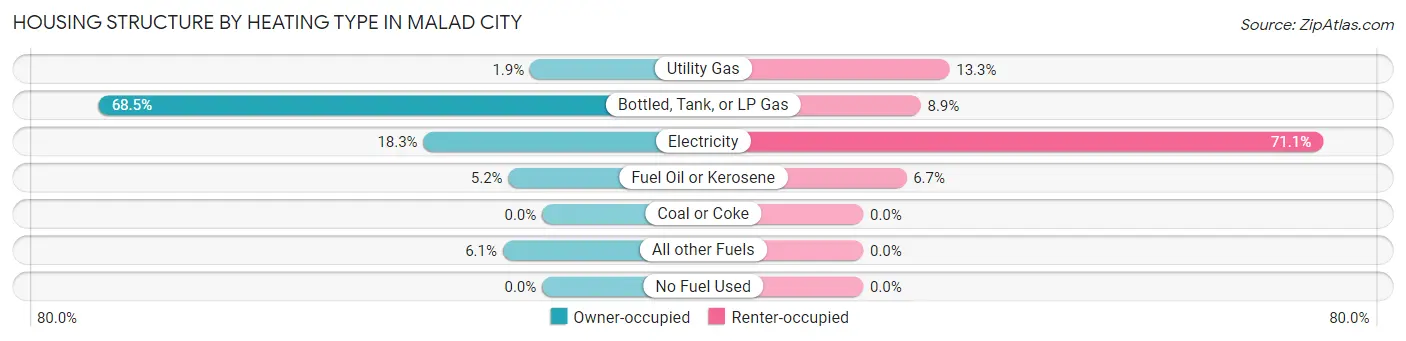
| Heating Type | Owner-occupied | Renter-occupied |
| Utility Gas | 15 (1.9%) | 12 (13.3%) |
| Bottled, Tank, or LP Gas | 553 (68.5%) | 8 (8.9%) |
| Electricity | 148 (18.3%) | 64 (71.1%) |
| Fuel Oil or Kerosene | 42 (5.2%) | 6 (6.7%) |
| Coal or Coke | 0 (0.0%) | 0 (0.0%) |
| All other Fuels | 49 (6.1%) | 0 (0.0%) |
| No Fuel Used | 0 (0.0%) | 0 (0.0%) |
| Total | 807 (100.0%) | 90 (100.0%) |
Household Vehicle Usage in Malad City
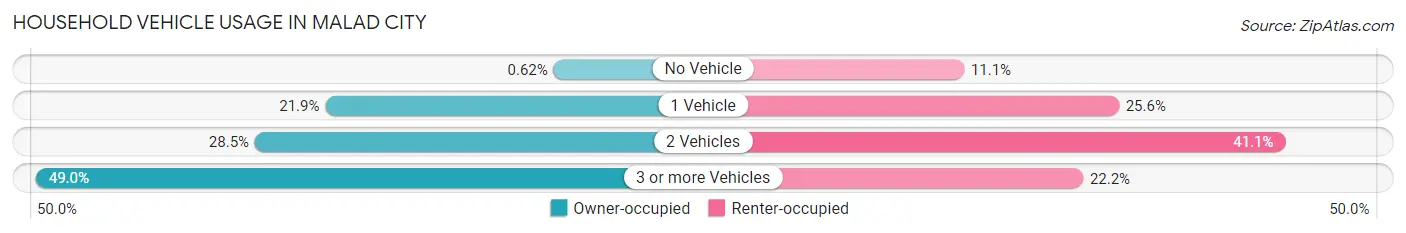
| Vehicles per Household | Owner-occupied | Renter-occupied |
| No Vehicle | 5 (0.6%) | 10 (11.1%) |
| 1 Vehicle | 177 (21.9%) | 23 (25.6%) |
| 2 Vehicles | 230 (28.5%) | 37 (41.1%) |
| 3 or more Vehicles | 395 (48.9%) | 20 (22.2%) |
| Total | 807 (100.0%) | 90 (100.0%) |
Real Estate & Mortgages in Malad City
Real Estate and Mortgage Overview in Malad City
| Characteristic | Without Mortgage | With Mortgage |
| Housing Units | 320 | 487 |
| Median Property Value | $216,700 | $178,000 |
| Median Household Income | $42,188 | $58 |
| Monthly Housing Costs | $385 | $0 |
| Real Estate Taxes | $1,193 | $3 |
Property Value by Mortgage Status in Malad City
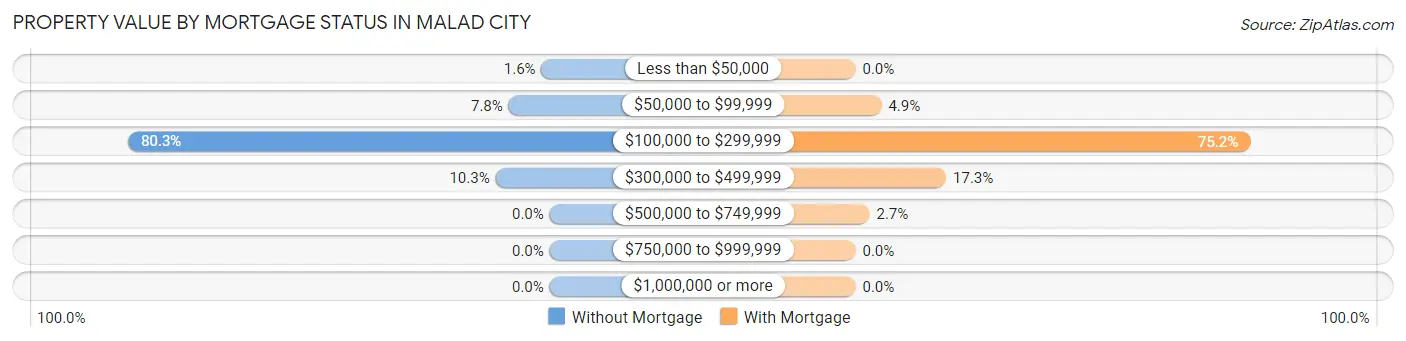
| Property Value | Without Mortgage | With Mortgage |
| Less than $50,000 | 5 (1.6%) | 0 (0.0%) |
| $50,000 to $99,999 | 25 (7.8%) | 24 (4.9%) |
| $100,000 to $299,999 | 257 (80.3%) | 366 (75.1%) |
| $300,000 to $499,999 | 33 (10.3%) | 84 (17.2%) |
| $500,000 to $749,999 | 0 (0.0%) | 13 (2.7%) |
| $750,000 to $999,999 | 0 (0.0%) | 0 (0.0%) |
| $1,000,000 or more | 0 (0.0%) | 0 (0.0%) |
| Total | 320 (100.0%) | 487 (100.0%) |
Household Income by Mortgage Status in Malad City
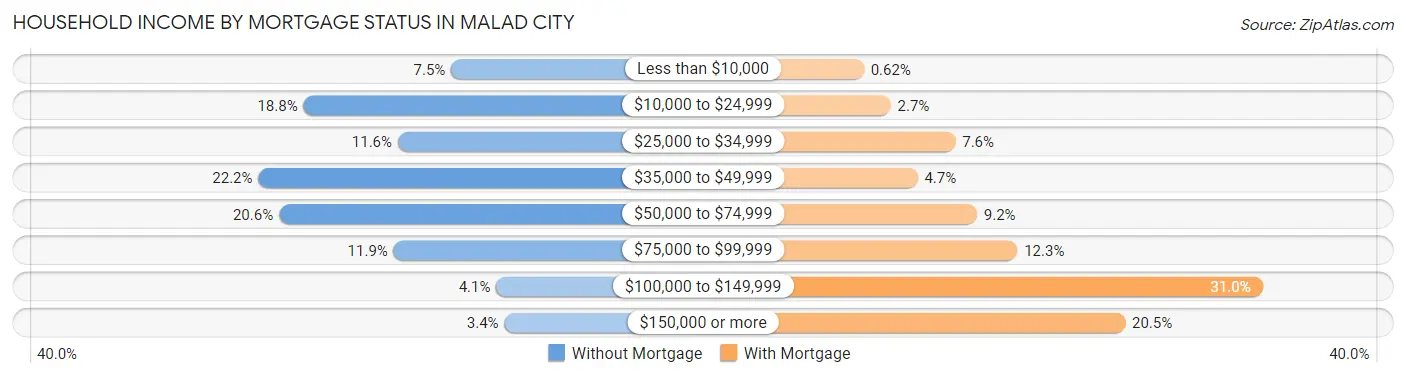
| Household Income | Without Mortgage | With Mortgage |
| Less than $10,000 | 24 (7.5%) | 3 (0.6%) |
| $10,000 to $24,999 | 60 (18.8%) | 13 (2.7%) |
| $25,000 to $34,999 | 37 (11.6%) | 37 (7.6%) |
| $35,000 to $49,999 | 71 (22.2%) | 23 (4.7%) |
| $50,000 to $74,999 | 66 (20.6%) | 45 (9.2%) |
| $75,000 to $99,999 | 38 (11.9%) | 60 (12.3%) |
| $100,000 to $149,999 | 13 (4.1%) | 151 (31.0%) |
| $150,000 or more | 11 (3.4%) | 100 (20.5%) |
| Total | 320 (100.0%) | 487 (100.0%) |
Property Value to Household Income Ratio in Malad City
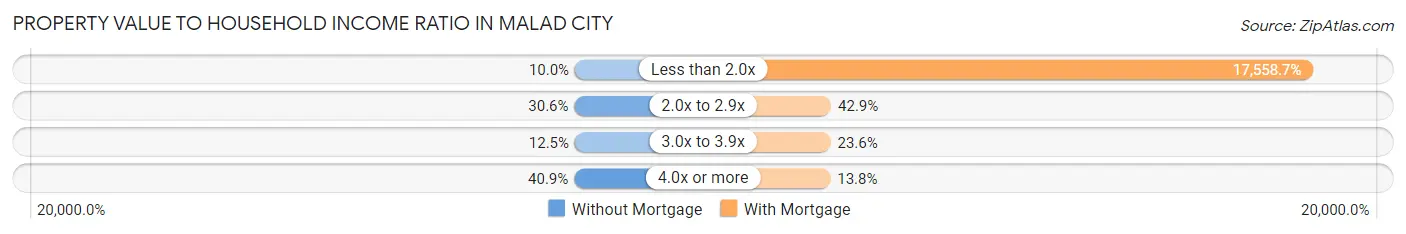
| Value-to-Income Ratio | Without Mortgage | With Mortgage |
| Less than 2.0x | 32 (10.0%) | 85,511 (17,558.7%) |
| 2.0x to 2.9x | 98 (30.6%) | 209 (42.9%) |
| 3.0x to 3.9x | 40 (12.5%) | 115 (23.6%) |
| 4.0x or more | 131 (40.9%) | 67 (13.8%) |
| Total | 320 (100.0%) | 487 (100.0%) |
Real Estate Taxes by Mortgage Status in Malad City
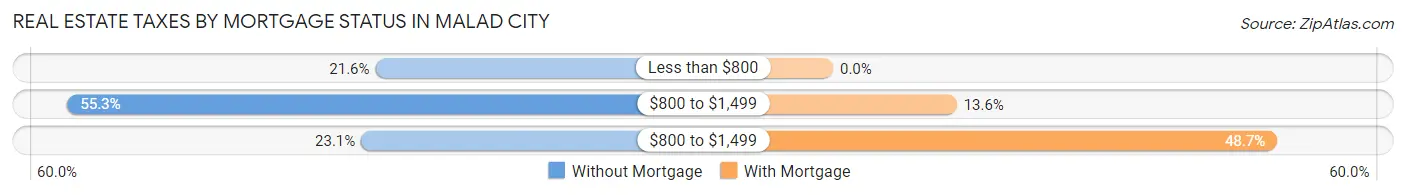
| Property Taxes | Without Mortgage | With Mortgage |
| Less than $800 | 69 (21.6%) | 0 (0.0%) |
| $800 to $1,499 | 177 (55.3%) | 66 (13.6%) |
| $800 to $1,499 | 74 (23.1%) | 237 (48.7%) |
| Total | 320 (100.0%) | 487 (100.0%) |
Health & Disability in Malad City
Health Insurance Coverage by Age in Malad City
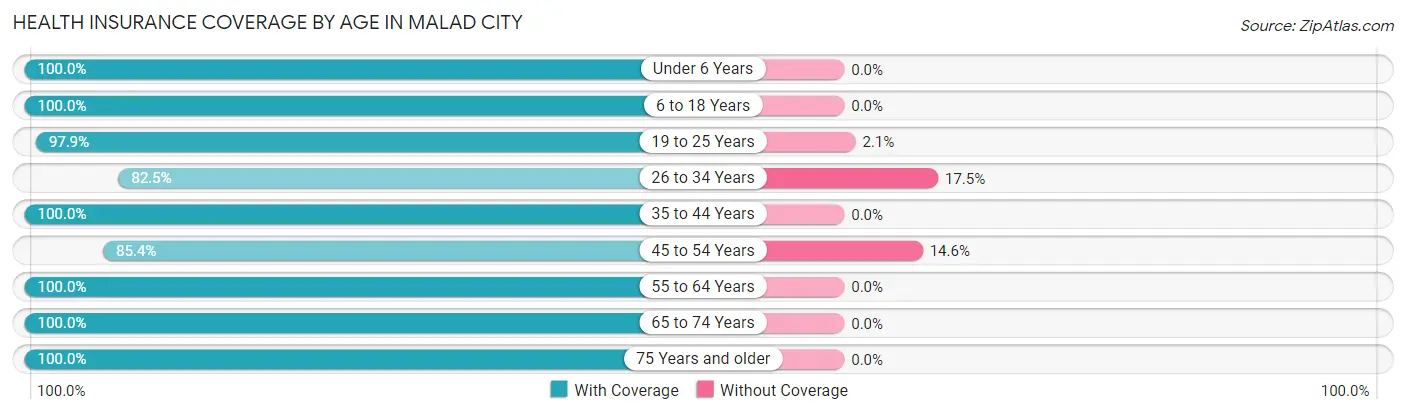
| Age Bracket | With Coverage | Without Coverage |
| Under 6 Years | 188 (100.0%) | 0 (0.0%) |
| 6 to 18 Years | 455 (100.0%) | 0 (0.0%) |
| 19 to 25 Years | 93 (97.9%) | 2 (2.1%) |
| 26 to 34 Years | 203 (82.5%) | 43 (17.5%) |
| 35 to 44 Years | 257 (100.0%) | 0 (0.0%) |
| 45 to 54 Years | 175 (85.4%) | 30 (14.6%) |
| 55 to 64 Years | 238 (100.0%) | 0 (0.0%) |
| 65 to 74 Years | 212 (100.0%) | 0 (0.0%) |
| 75 Years and older | 273 (100.0%) | 0 (0.0%) |
| Total | 2,094 (96.5%) | 75 (3.5%) |
Health Insurance Coverage by Citizenship Status in Malad City
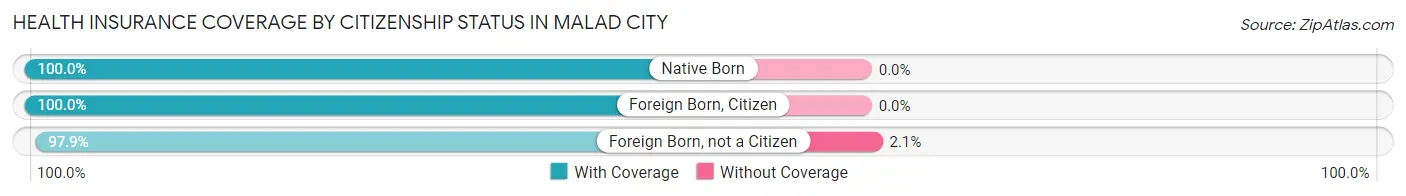
| Citizenship Status | With Coverage | Without Coverage |
| Native Born | 188 (100.0%) | 0 (0.0%) |
| Foreign Born, Citizen | 455 (100.0%) | 0 (0.0%) |
| Foreign Born, not a Citizen | 93 (97.9%) | 2 (2.1%) |
Health Insurance Coverage by Household Income in Malad City
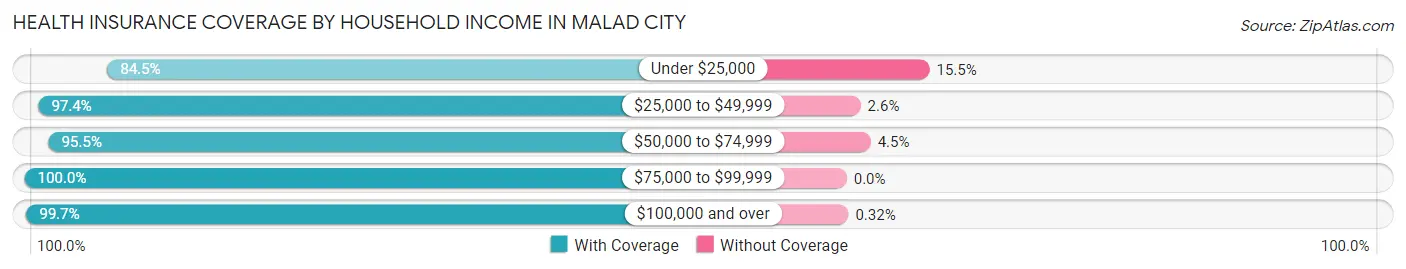
| Household Income | With Coverage | Without Coverage |
| Under $25,000 | 278 (84.5%) | 51 (15.5%) |
| $25,000 to $49,999 | 337 (97.4%) | 9 (2.6%) |
| $50,000 to $74,999 | 277 (95.5%) | 13 (4.5%) |
| $75,000 to $99,999 | 575 (100.0%) | 0 (0.0%) |
| $100,000 and over | 627 (99.7%) | 2 (0.3%) |
Public vs Private Health Insurance Coverage by Age in Malad City
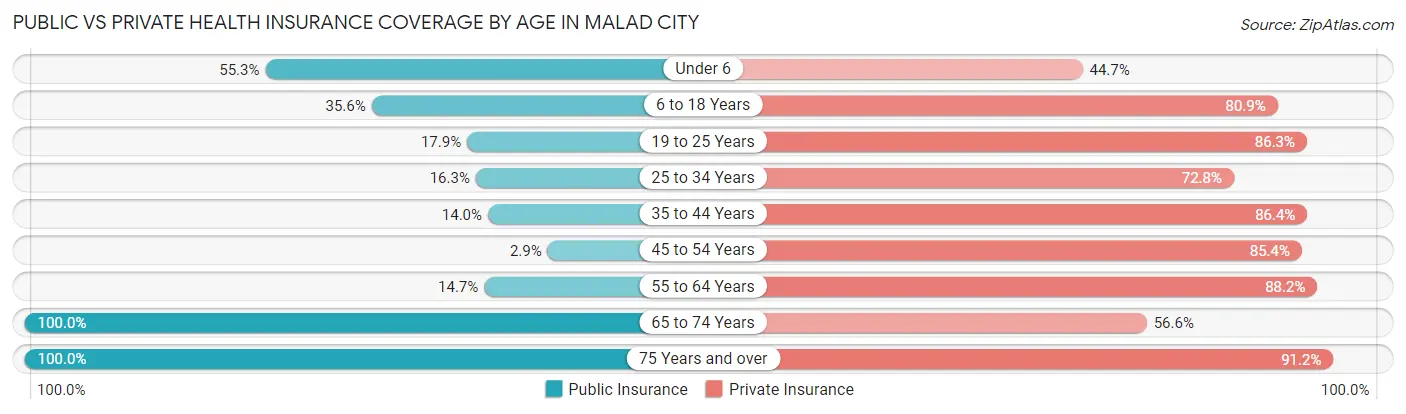
| Age Bracket | Public Insurance | Private Insurance |
| Under 6 | 104 (55.3%) | 84 (44.7%) |
| 6 to 18 Years | 162 (35.6%) | 368 (80.9%) |
| 19 to 25 Years | 17 (17.9%) | 82 (86.3%) |
| 25 to 34 Years | 40 (16.3%) | 179 (72.8%) |
| 35 to 44 Years | 36 (14.0%) | 222 (86.4%) |
| 45 to 54 Years | 6 (2.9%) | 175 (85.4%) |
| 55 to 64 Years | 35 (14.7%) | 210 (88.2%) |
| 65 to 74 Years | 212 (100.0%) | 120 (56.6%) |
| 75 Years and over | 273 (100.0%) | 249 (91.2%) |
| Total | 885 (40.8%) | 1,689 (77.9%) |
Disability Status by Sex by Age in Malad City
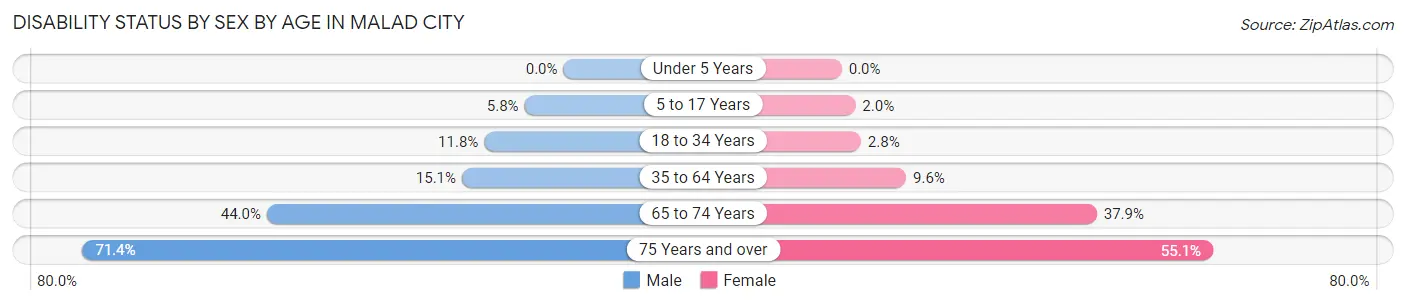
| Age Bracket | Male | Female |
| Under 5 Years | 0 (0.0%) | 0 (0.0%) |
| 5 to 17 Years | 13 (5.8%) | 5 (2.0%) |
| 18 to 34 Years | 22 (11.8%) | 5 (2.8%) |
| 35 to 64 Years | 55 (15.1%) | 32 (9.6%) |
| 65 to 74 Years | 48 (44.0%) | 39 (37.9%) |
| 75 Years and over | 90 (71.4%) | 81 (55.1%) |
Disability Class by Sex by Age in Malad City
Disability Class: Hearing Difficulty
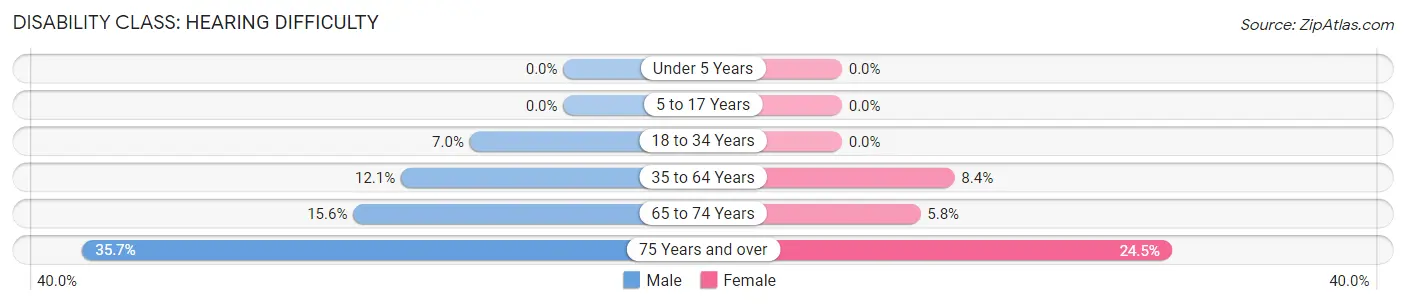
| Age Bracket | Male | Female |
| Under 5 Years | 0 (0.0%) | 0 (0.0%) |
| 5 to 17 Years | 0 (0.0%) | 0 (0.0%) |
| 18 to 34 Years | 13 (7.0%) | 0 (0.0%) |
| 35 to 64 Years | 44 (12.0%) | 28 (8.4%) |
| 65 to 74 Years | 17 (15.6%) | 6 (5.8%) |
| 75 Years and over | 45 (35.7%) | 36 (24.5%) |
Disability Class: Vision Difficulty
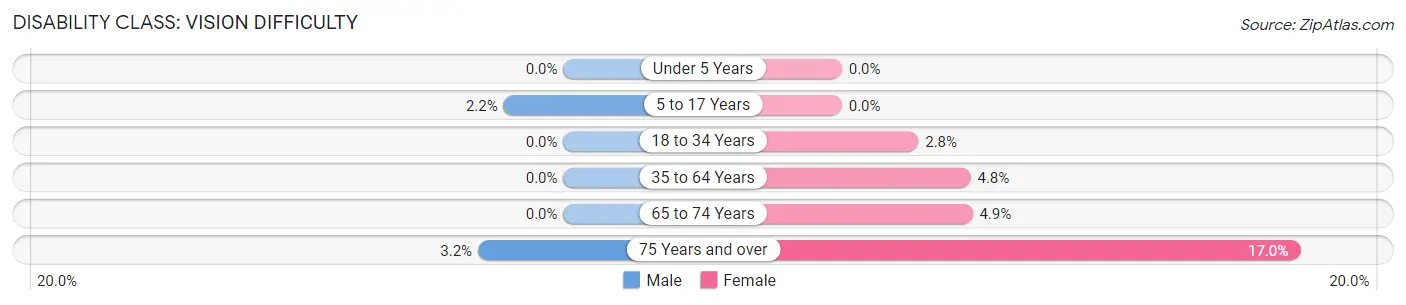
| Age Bracket | Male | Female |
| Under 5 Years | 0 (0.0%) | 0 (0.0%) |
| 5 to 17 Years | 5 (2.2%) | 0 (0.0%) |
| 18 to 34 Years | 0 (0.0%) | 5 (2.8%) |
| 35 to 64 Years | 0 (0.0%) | 16 (4.8%) |
| 65 to 74 Years | 0 (0.0%) | 5 (4.9%) |
| 75 Years and over | 4 (3.2%) | 25 (17.0%) |
Disability Class: Cognitive Difficulty
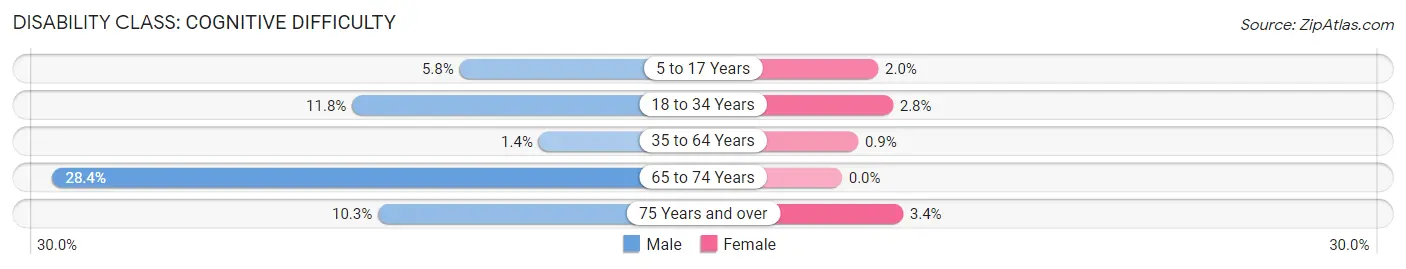
| Age Bracket | Male | Female |
| 5 to 17 Years | 13 (5.8%) | 5 (2.0%) |
| 18 to 34 Years | 22 (11.8%) | 5 (2.8%) |
| 35 to 64 Years | 5 (1.4%) | 3 (0.9%) |
| 65 to 74 Years | 31 (28.4%) | 0 (0.0%) |
| 75 Years and over | 13 (10.3%) | 5 (3.4%) |
Disability Class: Ambulatory Difficulty
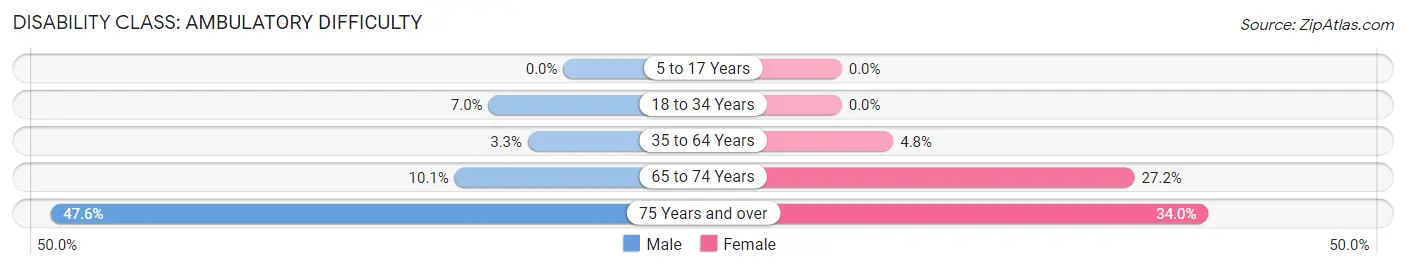
| Age Bracket | Male | Female |
| 5 to 17 Years | 0 (0.0%) | 0 (0.0%) |
| 18 to 34 Years | 13 (7.0%) | 0 (0.0%) |
| 35 to 64 Years | 12 (3.3%) | 16 (4.8%) |
| 65 to 74 Years | 11 (10.1%) | 28 (27.2%) |
| 75 Years and over | 60 (47.6%) | 50 (34.0%) |
Disability Class: Self-Care Difficulty
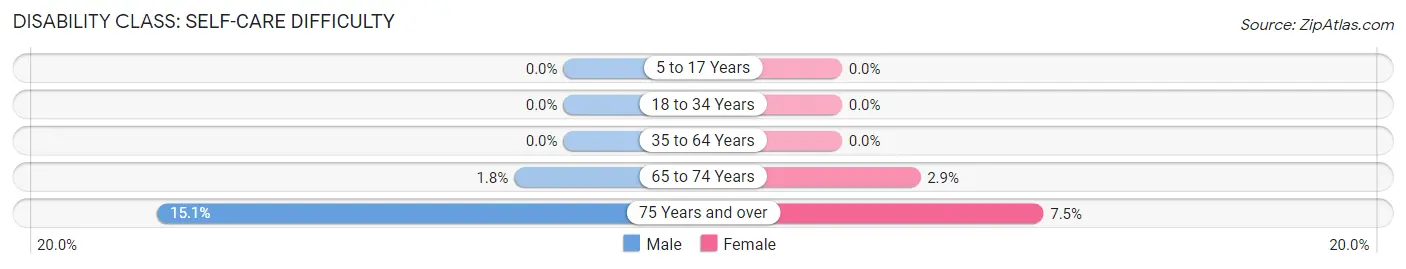
| Age Bracket | Male | Female |
| 5 to 17 Years | 0 (0.0%) | 0 (0.0%) |
| 18 to 34 Years | 0 (0.0%) | 0 (0.0%) |
| 35 to 64 Years | 0 (0.0%) | 0 (0.0%) |
| 65 to 74 Years | 2 (1.8%) | 3 (2.9%) |
| 75 Years and over | 19 (15.1%) | 11 (7.5%) |
Technology Access in Malad City
Computing Device Access in Malad City
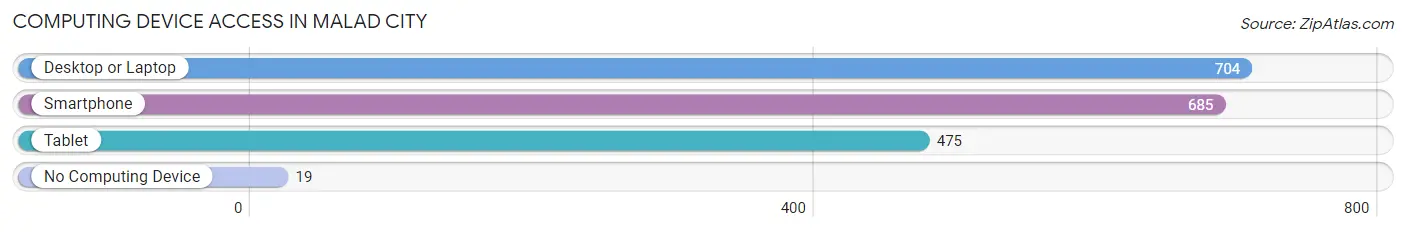
| Device Type | # Households | % Households |
| Desktop or Laptop | 704 | 78.5% |
| Smartphone | 685 | 76.4% |
| Tablet | 475 | 52.9% |
| No Computing Device | 19 | 2.1% |
| Total | 897 | 100.0% |
Internet Access in Malad City
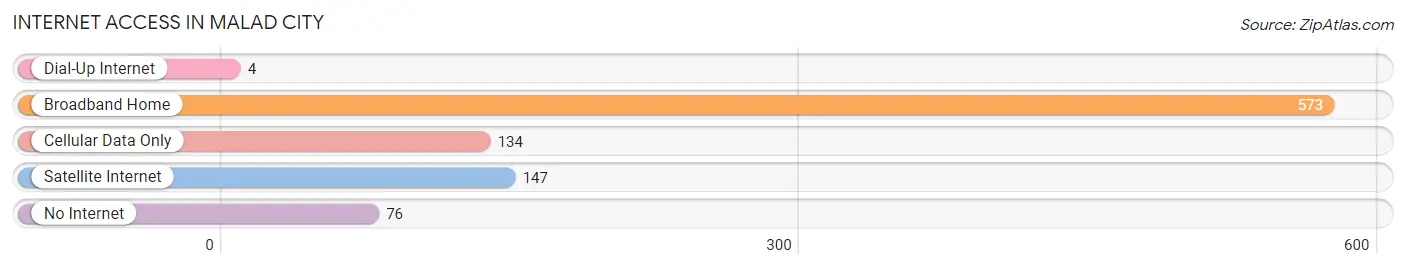
| Internet Type | # Households | % Households |
| Dial-Up Internet | 4 | 0.4% |
| Broadband Home | 573 | 63.9% |
| Cellular Data Only | 134 | 14.9% |
| Satellite Internet | 147 | 16.4% |
| No Internet | 76 | 8.5% |
| Total | 897 | 100.0% |
Malad City Summary
Malad City is a city located in Oneida County, Idaho, United States. It is the county seat of Oneida County and is located in the southeastern corner of the state. The population was 2,093 at the 2010 census.
History
Malad City was founded in 1864 by a group of Mormon settlers led by William H. Smart. The city was named after the nearby Malad River, which was named by French-Canadian fur trappers in the early 19th century. The name Malad is derived from the French word malade, meaning "sickly".
The city was incorporated in 1891 and has since grown to become the largest city in Oneida County. The city has a rich history of agriculture, mining, and ranching.
Geography
Malad City is located at an elevation of 4,945 feet (1,507 m) in the southeastern corner of Idaho. It is situated in the Snake River Plain, a large area of flat land that stretches from the Rocky Mountains to the Great Basin. The city is located near the Malad River, which flows through the city and is a tributary of the Snake River.
The city has a total area of 2 2 square miles 5 7 km2 all of which is land
Economy
Malad City is a small rural community with a strong agricultural base. The city is home to several large farms and ranches, as well as a number of small businesses. The city is also home to a number of manufacturing and service businesses.
The city is also home to a number of tourist attractions, including the Malad Gorge State Park, the Malad Valley Historical Museum, and the Malad City National Historic District.
Demographics
As of the 2010 census, there were 2,093 people, 745 households, and 517 families residing in the city. The population density was 945.2 people per square mile (364.3/km2). There were 817 housing units at an average density of 369.2 per square mile (142.7/km2). The racial makeup of the city was 95.3% White, 0.2% African American, 0.7% Native American, 0.2% Asian, 0.1% Pacific Islander, 1.7% from other races, and 1.9% from two or more races. Hispanic or Latino of any race were 4.2% of the population.
There were 745 households, out of which 33.2% had children under the age of 18 living with them, 54.2% were married couples living together, 10.2% had a female householder with no husband present, and 30.7% were non-families. 25.7% of all households were made up of individuals, and 11.2% had someone living alone who was 65 years of age or older. The average household size was 2.63 and the average family size was 3.17.
In the city, the population was spread out, with 28.2% under the age of 18, 8.2% from 18 to 24, 24.2% from 25 to 44, 24.2% from 45 to 64, and 15.2% who were 65 years of age or older. The median age was 37 years. For every 100 females, there were 97.2 males. For every 100 females age 18 and over, there were 94.2 males.
The median income for a household in the city was $32,500, and the median income for a family was $37,500. Males had a median income of $30,000 versus $20,000 for females. The per capita income for the city was $14,945. About 10.2% of families and 13.2% of the population were below the poverty line, including 16.2% of those under age 18 and 8.2% of those age 65 or over.
Common Questions
What is Per Capita Income in Malad City?
Per Capita income in Malad City is $28,874.
What is the Median Family Income in Malad City?
Median Family Income in Malad City is $75,714.
What is the Median Household income in Malad City?
Median Household Income in Malad City is $68,594.
What is Income or Wage Gap in Malad City?
Income or Wage Gap in Malad City is 54.1%.
Women in Malad City earn 45.9 cents for every dollar earned by a man.
What is Inequality or Gini Index in Malad City?
Inequality or Gini Index in Malad City is 0.37.
What is the Total Population of Malad City?
Total Population of Malad City is 2,219.
What is the Total Male Population of Malad City?
Total Male Population of Malad City is 1,104.
What is the Total Female Population of Malad City?
Total Female Population of Malad City is 1,115.
What is the Ratio of Males per 100 Females in Malad City?
There are 99.01 Males per 100 Females in Malad City.
What is the Ratio of Females per 100 Males in Malad City?
There are 101.00 Females per 100 Males in Malad City.
What is the Median Population Age in Malad City?
Median Population Age in Malad City is 39.8 Years.
What is the Average Family Size in Malad City
Average Family Size in Malad City is 3.3 People.
What is the Average Household Size in Malad City
Average Household Size in Malad City is 2.4 People.
How Large is the Labor Force in Malad City?
There are 997 People in the Labor Forcein in Malad City.
What is the Percentage of People in the Labor Force in Malad City?
59.3% of People are in the Labor Force in Malad City.
What is the Unemployment Rate in Malad City?
Unemployment Rate in Malad City is 0.4%.