Zip Codes with the Highest Poverty Level in Iowa
RELATED REPORTS & OPTIONS
Highest Poverty
Iowa
Compare Zip Codes
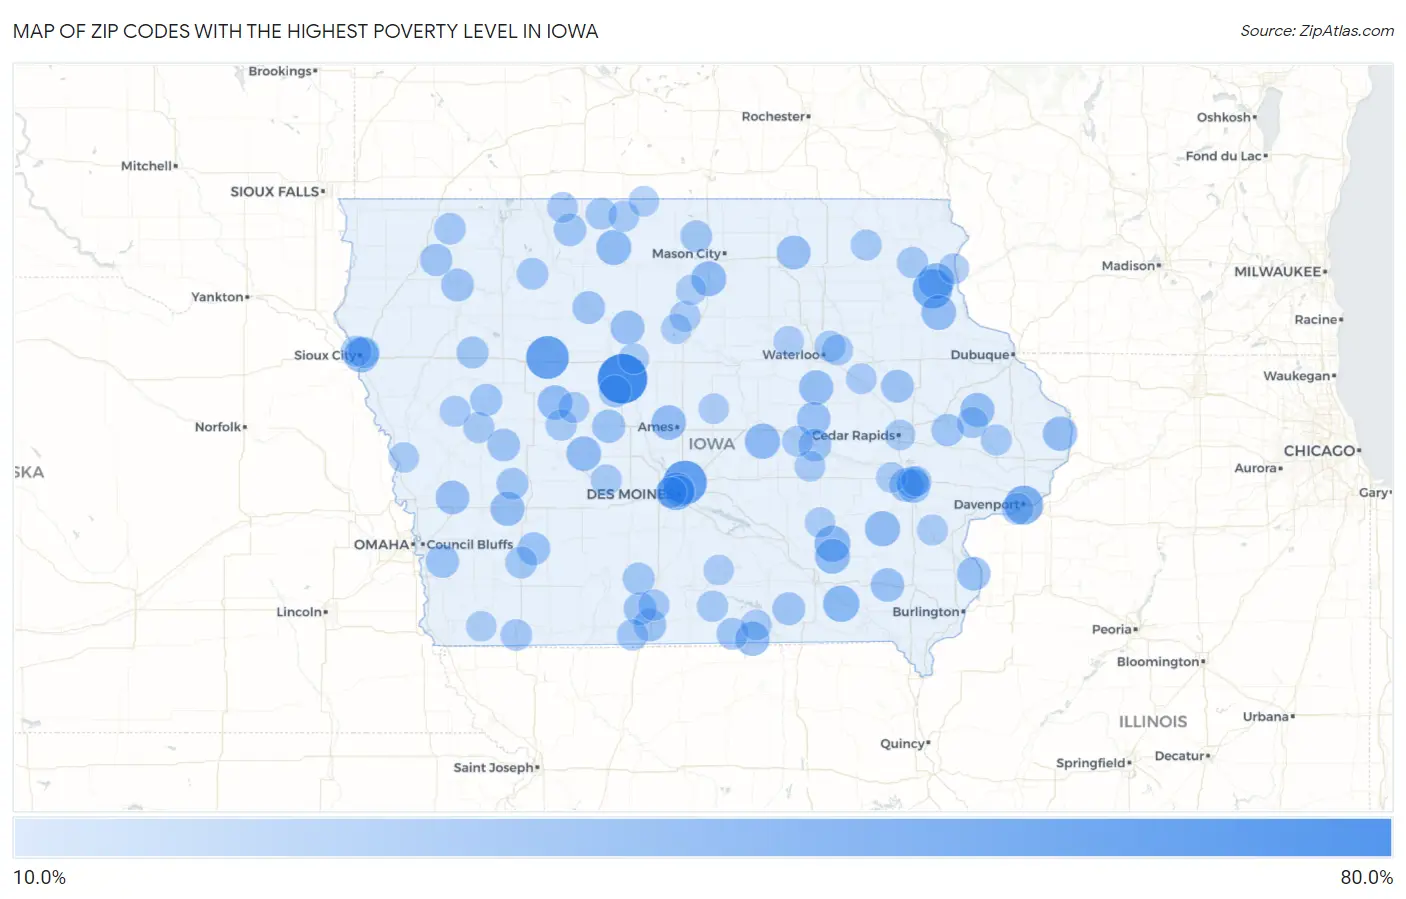
Map of Zip Codes with the Highest Poverty Level in Iowa
10.0%
80.0%
Zip Codes with the Highest Poverty Level in Iowa
| Zip Code | Poverty | vs State | vs National | |
| 1. | 50521 | 76.5% | 11.1%(+65.4)#1 | 12.5%(+63.9)#167 |
| 2. | 50032 | 58.4% | 11.1%(+47.3)#2 | 12.5%(+45.9)#354 |
| 3. | 50551 | 55.6% | 11.1%(+44.4)#3 | 12.5%(+43.0)#410 |
| 4. | 52072 | 45.8% | 11.1%(+34.7)#4 | 12.5%(+33.3)#744 |
| 5. | 52801 | 43.5% | 11.1%(+32.4)#5 | 12.5%(+31.0)#871 |
| 6. | 50314 | 40.3% | 11.1%(+29.2)#6 | 12.5%(+27.7)#1,055 |
| 7. | 52588 | 36.2% | 11.1%(+25.1)#7 | 12.5%(+23.7)#1,396 |
| 8. | 52047 | 35.5% | 11.1%(+24.4)#8 | 12.5%(+23.0)#1,477 |
| 9. | 52562 | 35.3% | 11.1%(+24.2)#9 | 12.5%(+22.8)#1,502 |
| 10. | 50078 | 33.3% | 11.1%(+22.2)#10 | 12.5%(+20.8)#1,780 |
| 11. | 52359 | 32.9% | 11.1%(+21.8)#11 | 12.5%(+20.4)#1,841 |
| 12. | 50522 | 32.4% | 11.1%(+21.3)#12 | 12.5%(+19.9)#1,934 |
| 13. | 51101 | 32.1% | 11.1%(+21.0)#13 | 12.5%(+19.6)#1,981 |
| 14. | 52568 | 32.1% | 11.1%(+21.0)#14 | 12.5%(+19.6)#1,983 |
| 15. | 50477 | 32.1% | 11.1%(+21.0)#15 | 12.5%(+19.6)#1,993 |
| 16. | 52044 | 32.0% | 11.1%(+20.9)#16 | 12.5%(+19.5)#2,011 |
| 17. | 50026 | 31.5% | 11.1%(+20.4)#17 | 12.5%(+19.0)#2,100 |
| 18. | 50014 | 31.1% | 11.1%(+20.0)#18 | 12.5%(+18.6)#2,163 |
| 19. | 51451 | 31.0% | 11.1%(+19.9)#19 | 12.5%(+18.5)#2,179 |
| 20. | 50612 | 30.7% | 11.1%(+19.6)#20 | 12.5%(+18.2)#2,231 |
| 21. | 52701 | 30.6% | 11.1%(+19.5)#21 | 12.5%(+18.0)#2,252 |
| 22. | 52321 | 30.1% | 11.1%(+19.0)#22 | 12.5%(+17.6)#2,350 |
| 23. | 51552 | 29.9% | 11.1%(+18.8)#23 | 12.5%(+17.4)#2,381 |
| 24. | 52549 | 29.9% | 11.1%(+18.7)#24 | 12.5%(+17.3)#2,395 |
| 25. | 50591 | 29.1% | 11.1%(+18.0)#25 | 12.5%(+16.6)#2,530 |
| 26. | 50620 | 29.1% | 11.1%(+18.0)#26 | 12.5%(+16.6)#2,537 |
| 27. | 51563 | 28.6% | 11.1%(+17.5)#27 | 12.5%(+16.1)#2,648 |
| 28. | 52646 | 28.3% | 11.1%(+17.2)#28 | 12.5%(+15.7)#2,730 |
| 29. | 52635 | 28.1% | 11.1%(+17.0)#29 | 12.5%(+15.6)#2,771 |
| 30. | 52217 | 28.0% | 11.1%(+16.9)#30 | 12.5%(+15.4)#2,804 |
| 31. | 52246 | 28.0% | 11.1%(+16.9)#31 | 12.5%(+15.4)#2,806 |
| 32. | 50107 | 27.4% | 11.1%(+16.3)#32 | 12.5%(+14.8)#2,954 |
| 33. | 51554 | 27.3% | 11.1%(+16.2)#33 | 12.5%(+14.7)#2,978 |
| 34. | 52240 | 27.2% | 11.1%(+16.0)#34 | 12.5%(+14.6)#3,009 |
| 35. | 50843 | 26.3% | 11.1%(+15.2)#35 | 12.5%(+13.7)#3,246 |
| 36. | 52594 | 26.2% | 11.1%(+15.1)#36 | 12.5%(+13.7)#3,276 |
| 37. | 52344 | 26.0% | 11.1%(+14.9)#37 | 12.5%(+13.5)#3,319 |
| 38. | 51009 | 25.9% | 11.1%(+14.8)#38 | 12.5%(+13.4)#3,342 |
| 39. | 51432 | 25.7% | 11.1%(+14.6)#39 | 12.5%(+13.2)#3,404 |
| 40. | 50067 | 25.7% | 11.1%(+14.6)#40 | 12.5%(+13.1)#3,426 |
| 41. | 52215 | 25.7% | 11.1%(+14.6)#41 | 12.5%(+13.1)#3,427 |
| 42. | 50108 | 25.6% | 11.1%(+14.5)#42 | 12.5%(+13.0)#3,463 |
| 43. | 50520 | 25.4% | 11.1%(+14.3)#43 | 12.5%(+12.9)#3,501 |
| 44. | 50578 | 24.9% | 11.1%(+13.8)#44 | 12.5%(+12.4)#3,697 |
| 45. | 52242 | 24.7% | 11.1%(+13.6)#45 | 12.5%(+12.2)#3,772 |
| 46. | 51231 | 24.6% | 11.1%(+13.5)#46 | 12.5%(+12.1)#3,801 |
| 47. | 52312 | 24.5% | 11.1%(+13.4)#47 | 12.5%(+12.0)#3,860 |
| 48. | 51448 | 24.2% | 11.1%(+13.1)#48 | 12.5%(+11.7)#3,952 |
| 49. | 50544 | 24.0% | 11.1%(+12.9)#49 | 12.5%(+11.5)#4,020 |
| 50. | 50174 | 23.9% | 11.1%(+12.8)#50 | 12.5%(+11.3)#4,077 |
| 51. | 51020 | 23.7% | 11.1%(+12.6)#51 | 12.5%(+11.2)#4,147 |
| 52. | 51543 | 23.5% | 11.1%(+12.3)#52 | 12.5%(+10.9)#4,241 |
| 53. | 50847 | 23.4% | 11.1%(+12.3)#53 | 12.5%(+10.9)#4,248 |
| 54. | 52590 | 23.2% | 11.1%(+12.1)#54 | 12.5%(+10.7)#4,333 |
| 55. | 50434 | 23.0% | 11.1%(+11.9)#55 | 12.5%(+10.5)#4,423 |
| 56. | 50515 | 22.7% | 11.1%(+11.6)#56 | 12.5%(+10.1)#4,558 |
| 57. | 51350 | 22.7% | 11.1%(+11.6)#57 | 12.5%(+10.1)#4,559 |
| 58. | 52802 | 22.5% | 11.1%(+11.4)#58 | 12.5%(+9.99)#4,631 |
| 59. | 51105 | 22.5% | 11.1%(+11.4)#59 | 12.5%(+9.96)#4,649 |
| 60. | 51651 | 22.5% | 11.1%(+11.4)#60 | 12.5%(+9.93)#4,659 |
| 61. | 50590 | 22.1% | 11.1%(+11.0)#61 | 12.5%(+9.58)#4,821 |
| 62. | 50316 | 22.1% | 11.1%(+11.0)#62 | 12.5%(+9.58)#4,824 |
| 63. | 50262 | 21.8% | 11.1%(+10.7)#63 | 12.5%(+9.30)#4,969 |
| 64. | 50140 | 21.7% | 11.1%(+10.6)#64 | 12.5%(+9.22)#5,015 |
| 65. | 52162 | 21.6% | 11.1%(+10.5)#65 | 12.5%(+9.10)#5,082 |
| 66. | 51459 | 21.5% | 11.1%(+10.4)#66 | 12.5%(+9.00)#5,142 |
| 67. | 50165 | 21.2% | 11.1%(+10.1)#67 | 12.5%(+8.68)#5,336 |
| 68. | 51442 | 21.1% | 11.1%(+10.0)#68 | 12.5%(+8.59)#5,375 |
| 69. | 52362 | 21.0% | 11.1%(+9.87)#69 | 12.5%(+8.44)#5,483 |
| 70. | 50050 | 20.9% | 11.1%(+9.80)#70 | 12.5%(+8.37)#5,511 |
| 71. | 51103 | 20.9% | 11.1%(+9.79)#71 | 12.5%(+8.36)#5,519 |
| 72. | 50703 | 20.9% | 11.1%(+9.78)#72 | 12.5%(+8.36)#5,523 |
| 73. | 50311 | 20.8% | 11.1%(+9.67)#73 | 12.5%(+8.24)#5,582 |
| 74. | 50451 | 20.8% | 11.1%(+9.66)#74 | 12.5%(+8.24)#5,586 |
| 75. | 50146 | 20.8% | 11.1%(+9.66)#75 | 12.5%(+8.24)#5,588 |
| 76. | 52254 | 20.8% | 11.1%(+9.64)#76 | 12.5%(+8.22)#5,604 |
| 77. | 50623 | 20.7% | 11.1%(+9.56)#77 | 12.5%(+8.13)#5,657 |
| 78. | 52168 | 20.6% | 11.1%(+9.46)#78 | 12.5%(+8.04)#5,714 |
| 79. | 52739 | 20.5% | 11.1%(+9.37)#79 | 12.5%(+7.94)#5,775 |
| 80. | 51460 | 20.3% | 11.1%(+9.23)#80 | 12.5%(+7.80)#5,854 |
| 81. | 52544 | 20.3% | 11.1%(+9.20)#81 | 12.5%(+7.77)#5,883 |
| 82. | 52211 | 20.3% | 11.1%(+9.18)#82 | 12.5%(+7.75)#5,899 |
| 83. | 52210 | 20.2% | 11.1%(+9.08)#83 | 12.5%(+7.66)#5,955 |
| 84. | 50470 | 20.2% | 11.1%(+9.07)#84 | 12.5%(+7.64)#5,964 |
| 85. | 52339 | 20.2% | 11.1%(+9.06)#85 | 12.5%(+7.63)#5,974 |
| 86. | 50531 | 19.8% | 11.1%(+8.72)#86 | 12.5%(+7.29)#6,199 |
| 87. | 52158 | 19.8% | 11.1%(+8.69)#87 | 12.5%(+7.26)#6,229 |
| 88. | 50532 | 19.4% | 11.1%(+8.28)#88 | 12.5%(+6.85)#6,479 |
| 89. | 52322 | 19.3% | 11.1%(+8.23)#89 | 12.5%(+6.81)#6,504 |
| 90. | 52401 | 19.3% | 11.1%(+8.23)#90 | 12.5%(+6.80)#6,515 |
| 91. | 50465 | 19.3% | 11.1%(+8.14)#91 | 12.5%(+6.72)#6,577 |
| 92. | 50457 | 19.2% | 11.1%(+8.11)#92 | 12.5%(+6.69)#6,602 |
| 93. | 51545 | 19.2% | 11.1%(+8.08)#93 | 12.5%(+6.65)#6,628 |
| 94. | 50660 | 19.2% | 11.1%(+8.05)#94 | 12.5%(+6.62)#6,657 |
| 95. | 50101 | 19.1% | 11.1%(+8.01)#95 | 12.5%(+6.58)#6,688 |
| 96. | 51601 | 19.1% | 11.1%(+7.98)#96 | 12.5%(+6.55)#6,709 |
| 97. | 50278 | 19.0% | 11.1%(+7.92)#97 | 12.5%(+6.49)#6,756 |
| 98. | 50268 | 19.0% | 11.1%(+7.87)#98 | 12.5%(+6.45)#6,793 |
| 99. | 50272 | 19.0% | 11.1%(+7.87)#99 | 12.5%(+6.44)#6,797 |
| 100. | 52245 | 18.8% | 11.1%(+7.67)#100 | 12.5%(+6.24)#6,952 |
Common Questions
What are the Top 10 Zip Codes with the Highest Poverty Level in Iowa?
Top 10 Zip Codes with the Highest Poverty Level in Iowa are:
What zip code has the Highest Poverty Level in Iowa?
50521 has the Highest Poverty Level in Iowa with 76.5%.
What is the Poverty Level in the State of Iowa?
Poverty Level in Iowa is 11.1%.
What is the Poverty Level in the United States?
Poverty Level in the United States is 12.5%.