Zip Codes with the Highest Percentage of Population Employed in Transportation & Warehousing in Iowa
RELATED REPORTS & OPTIONS
Transportation & Warehousing
Iowa
Compare Zip Codes
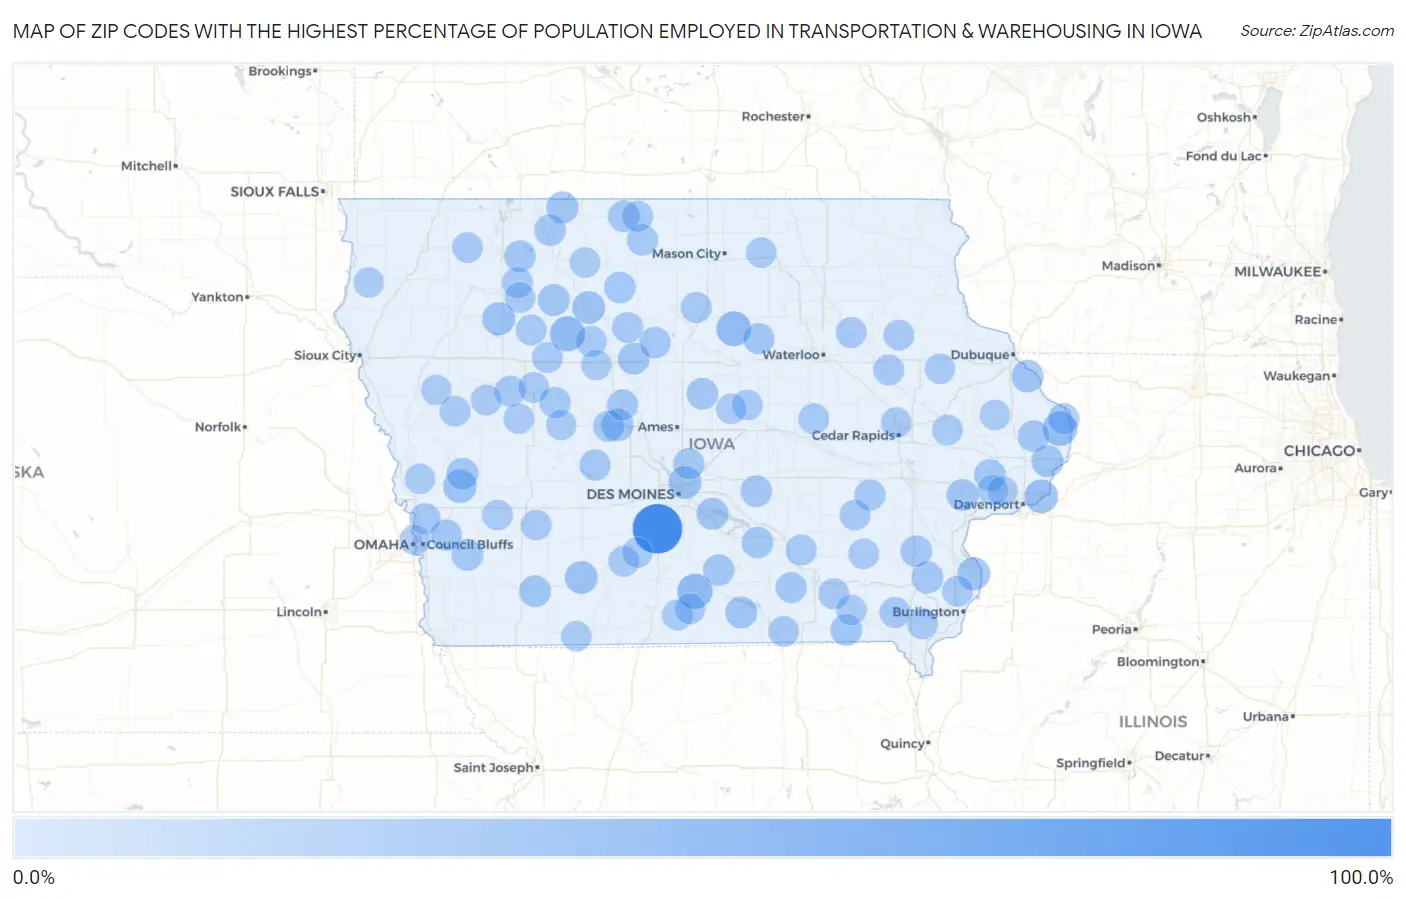
Map of Zip Codes with the Highest Percentage of Population Employed in Transportation & Warehousing in Iowa
0.0%
100.0%
Zip Codes with the Highest Percentage of Population Employed in Transportation & Warehousing in Iowa
| Zip Code | % Employed | vs State | vs National | |
| 1. | 50033 | 100.0% | 4.3%(+95.7)#1 | 4.9%(+95.1)#24 |
| 2. | 50068 | 32.2% | 4.3%(+27.9)#2 | 4.9%(+27.3)#198 |
| 3. | 50571 | 31.6% | 4.3%(+27.3)#3 | 4.9%(+26.6)#206 |
| 4. | 50633 | 30.3% | 4.3%(+26.0)#4 | 4.9%(+25.4)#222 |
| 5. | 52771 | 28.6% | 4.3%(+24.3)#5 | 4.9%(+23.6)#258 |
| 6. | 52767 | 24.6% | 4.3%(+20.3)#6 | 4.9%(+19.6)#344 |
| 7. | 51565 | 23.7% | 4.3%(+19.4)#7 | 4.9%(+18.7)#376 |
| 8. | 50592 | 22.4% | 4.3%(+18.1)#8 | 4.9%(+17.5)#414 |
| 9. | 52646 | 21.7% | 4.3%(+17.4)#9 | 4.9%(+16.8)#446 |
| 10. | 50032 | 21.4% | 4.3%(+17.1)#10 | 4.9%(+16.5)#454 |
| 11. | 50520 | 20.7% | 4.3%(+16.4)#11 | 4.9%(+15.7)#494 |
| 12. | 50842 | 20.7% | 4.3%(+16.4)#12 | 4.9%(+15.7)#495 |
| 13. | 50031 | 19.0% | 4.3%(+14.7)#13 | 4.9%(+14.1)#593 |
| 14. | 52071 | 18.9% | 4.3%(+14.6)#14 | 4.9%(+14.0)#598 |
| 15. | 50531 | 17.9% | 4.3%(+13.6)#15 | 4.9%(+12.9)#695 |
| 16. | 52757 | 17.6% | 4.3%(+13.3)#16 | 4.9%(+12.7)#713 |
| 17. | 50252 | 17.3% | 4.3%(+13.0)#17 | 4.9%(+12.3)#745 |
| 18. | 52581 | 17.1% | 4.3%(+12.8)#18 | 4.9%(+12.1)#769 |
| 19. | 50546 | 16.8% | 4.3%(+12.5)#19 | 4.9%(+11.8)#802 |
| 20. | 50532 | 16.7% | 4.3%(+12.4)#20 | 4.9%(+11.8)#805 |
| 21. | 50857 | 16.7% | 4.3%(+12.4)#21 | 4.9%(+11.7)#823 |
| 22. | 52760 | 16.5% | 4.3%(+12.2)#22 | 4.9%(+11.6)#842 |
| 23. | 51562 | 16.5% | 4.3%(+12.2)#23 | 4.9%(+11.5)#852 |
| 24. | 52644 | 16.4% | 4.3%(+12.1)#24 | 4.9%(+11.5)#857 |
| 25. | 52765 | 16.2% | 4.3%(+11.9)#25 | 4.9%(+11.2)#880 |
| 26. | 51549 | 16.1% | 4.3%(+11.8)#26 | 4.9%(+11.2)#893 |
| 27. | 50137 | 16.1% | 4.3%(+11.8)#27 | 4.9%(+11.1)#899 |
| 28. | 50451 | 16.0% | 4.3%(+11.7)#28 | 4.9%(+11.0)#913 |
| 29. | 52621 | 16.0% | 4.3%(+11.7)#29 | 4.9%(+11.0)#916 |
| 30. | 52731 | 15.9% | 4.3%(+11.6)#30 | 4.9%(+10.9)#924 |
| 31. | 50256 | 15.9% | 4.3%(+11.6)#31 | 4.9%(+10.9)#925 |
| 32. | 50102 | 15.8% | 4.3%(+11.5)#32 | 4.9%(+10.8)#942 |
| 33. | 51365 | 15.7% | 4.3%(+11.4)#33 | 4.9%(+10.8)#945 |
| 34. | 51333 | 15.3% | 4.3%(+11.0)#34 | 4.9%(+10.3)#1,009 |
| 35. | 50560 | 15.3% | 4.3%(+11.0)#35 | 4.9%(+10.3)#1,011 |
| 36. | 50599 | 14.9% | 4.3%(+10.6)#36 | 4.9%(+9.93)#1,093 |
| 37. | 52570 | 14.8% | 4.3%(+10.5)#37 | 4.9%(+9.88)#1,098 |
| 38. | 50272 | 14.8% | 4.3%(+10.5)#38 | 4.9%(+9.87)#1,104 |
| 39. | 50484 | 14.4% | 4.3%(+10.1)#39 | 4.9%(+9.43)#1,186 |
| 40. | 51548 | 14.3% | 4.3%(+10.0)#40 | 4.9%(+9.40)#1,194 |
| 41. | 50107 | 14.0% | 4.3%(+9.69)#41 | 4.9%(+9.05)#1,287 |
| 42. | 52536 | 14.0% | 4.3%(+9.68)#42 | 4.9%(+9.04)#1,289 |
| 43. | 50277 | 13.9% | 4.3%(+9.61)#43 | 4.9%(+8.97)#1,299 |
| 44. | 51451 | 13.8% | 4.3%(+9.49)#44 | 4.9%(+8.85)#1,327 |
| 45. | 50073 | 13.7% | 4.3%(+9.35)#45 | 4.9%(+8.71)#1,360 |
| 46. | 50420 | 13.5% | 4.3%(+9.15)#46 | 4.9%(+8.50)#1,404 |
| 47. | 51542 | 13.4% | 4.3%(+9.12)#47 | 4.9%(+8.48)#1,418 |
| 48. | 50040 | 13.3% | 4.3%(+9.03)#48 | 4.9%(+8.39)#1,447 |
| 49. | 51466 | 13.2% | 4.3%(+8.91)#49 | 4.9%(+8.27)#1,477 |
| 50. | 52070 | 13.2% | 4.3%(+8.90)#50 | 4.9%(+8.25)#1,482 |
| 51. | 52325 | 13.1% | 4.3%(+8.80)#51 | 4.9%(+8.15)#1,509 |
| 52. | 52630 | 13.0% | 4.3%(+8.74)#52 | 4.9%(+8.10)#1,523 |
| 53. | 50604 | 13.0% | 4.3%(+8.71)#53 | 4.9%(+8.07)#1,532 |
| 54. | 50424 | 12.9% | 4.3%(+8.56)#54 | 4.9%(+7.92)#1,572 |
| 55. | 50524 | 12.7% | 4.3%(+8.43)#55 | 4.9%(+7.79)#1,614 |
| 56. | 50149 | 12.7% | 4.3%(+8.43)#56 | 4.9%(+7.79)#1,615 |
| 57. | 52543 | 12.7% | 4.3%(+8.36)#57 | 4.9%(+7.72)#1,631 |
| 58. | 50103 | 12.6% | 4.3%(+8.33)#58 | 4.9%(+7.69)#1,640 |
| 59. | 51366 | 12.5% | 4.3%(+8.20)#59 | 4.9%(+7.55)#1,676 |
| 60. | 50551 | 12.5% | 4.3%(+8.20)#60 | 4.9%(+7.55)#1,689 |
| 61. | 52217 | 12.5% | 4.3%(+8.15)#61 | 4.9%(+7.51)#1,699 |
| 62. | 50591 | 12.4% | 4.3%(+8.10)#62 | 4.9%(+7.46)#1,711 |
| 63. | 51448 | 12.4% | 4.3%(+8.06)#63 | 4.9%(+7.41)#1,729 |
| 64. | 52554 | 12.2% | 4.3%(+7.89)#64 | 4.9%(+7.25)#1,785 |
| 65. | 52650 | 12.0% | 4.3%(+7.74)#65 | 4.9%(+7.09)#1,840 |
| 66. | 52326 | 12.0% | 4.3%(+7.70)#66 | 4.9%(+7.05)#1,853 |
| 67. | 52335 | 12.0% | 4.3%(+7.68)#67 | 4.9%(+7.04)#1,870 |
| 68. | 50565 | 11.8% | 4.3%(+7.49)#68 | 4.9%(+6.85)#1,948 |
| 69. | 50123 | 11.8% | 4.3%(+7.49)#69 | 4.9%(+6.85)#1,952 |
| 70. | 51460 | 11.8% | 4.3%(+7.46)#70 | 4.9%(+6.82)#1,973 |
| 71. | 50593 | 11.8% | 4.3%(+7.46)#71 | 4.9%(+6.82)#1,975 |
| 72. | 50650 | 11.7% | 4.3%(+7.38)#72 | 4.9%(+6.74)#1,990 |
| 73. | 51577 | 11.7% | 4.3%(+7.38)#73 | 4.9%(+6.74)#1,992 |
| 74. | 50629 | 11.7% | 4.3%(+7.37)#74 | 4.9%(+6.73)#1,996 |
| 75. | 52572 | 11.6% | 4.3%(+7.29)#75 | 4.9%(+6.65)#2,027 |
| 76. | 52656 | 11.6% | 4.3%(+7.28)#76 | 4.9%(+6.64)#2,034 |
| 77. | 51346 | 11.5% | 4.3%(+7.19)#77 | 4.9%(+6.55)#2,076 |
| 78. | 52769 | 11.5% | 4.3%(+7.19)#78 | 4.9%(+6.54)#2,079 |
| 79. | 50274 | 11.5% | 4.3%(+7.17)#79 | 4.9%(+6.53)#2,085 |
| 80. | 52312 | 11.4% | 4.3%(+7.12)#80 | 4.9%(+6.48)#2,109 |
| 81. | 52233 | 11.4% | 4.3%(+7.09)#81 | 4.9%(+6.45)#2,125 |
| 82. | 51433 | 11.4% | 4.3%(+7.08)#82 | 4.9%(+6.44)#2,130 |
| 83. | 50148 | 11.3% | 4.3%(+6.96)#83 | 4.9%(+6.32)#2,199 |
| 84. | 51510 | 11.2% | 4.3%(+6.85)#84 | 4.9%(+6.20)#2,251 |
| 85. | 52585 | 11.1% | 4.3%(+6.81)#85 | 4.9%(+6.16)#2,267 |
| 86. | 52223 | 11.0% | 4.3%(+6.66)#86 | 4.9%(+6.02)#2,338 |
| 87. | 50222 | 10.9% | 4.3%(+6.59)#87 | 4.9%(+5.94)#2,371 |
| 88. | 50598 | 10.9% | 4.3%(+6.57)#88 | 4.9%(+5.92)#2,381 |
| 89. | 51550 | 10.8% | 4.3%(+6.51)#89 | 4.9%(+5.86)#2,415 |
| 90. | 50051 | 10.8% | 4.3%(+6.49)#90 | 4.9%(+5.85)#2,428 |
| 91. | 52551 | 10.6% | 4.3%(+6.25)#91 | 4.9%(+5.61)#2,554 |
| 92. | 52773 | 10.5% | 4.3%(+6.18)#92 | 4.9%(+5.54)#2,593 |
| 93. | 50566 | 10.5% | 4.3%(+6.18)#93 | 4.9%(+5.53)#2,597 |
| 94. | 51027 | 10.4% | 4.3%(+6.12)#94 | 4.9%(+5.47)#2,626 |
| 95. | 52207 | 10.4% | 4.3%(+6.11)#95 | 4.9%(+5.47)#2,630 |
| 96. | 50836 | 10.3% | 4.3%(+6.04)#96 | 4.9%(+5.40)#2,679 |
| 97. | 51459 | 10.3% | 4.3%(+6.04)#97 | 4.9%(+5.40)#2,682 |
| 98. | 51430 | 10.3% | 4.3%(+6.03)#98 | 4.9%(+5.38)#2,690 |
| 99. | 51019 | 10.2% | 4.3%(+5.93)#99 | 4.9%(+5.29)#2,740 |
| 100. | 50471 | 10.2% | 4.3%(+5.90)#100 | 4.9%(+5.26)#2,761 |
Common Questions
What are the Top 10 Zip Codes with the Highest Percentage of Population Employed in Transportation & Warehousing in Iowa?
Top 10 Zip Codes with the Highest Percentage of Population Employed in Transportation & Warehousing in Iowa are:
What zip code has the Highest Percentage of Population Employed in Transportation & Warehousing in Iowa?
50033 has the Highest Percentage of Population Employed in Transportation & Warehousing in Iowa with 100.0%.
What is the Percentage of Population Employed in Transportation & Warehousing in the State of Iowa?
Percentage of Population Employed in Transportation & Warehousing in Iowa is 4.3%.
What is the Percentage of Population Employed in Transportation & Warehousing in the United States?
Percentage of Population Employed in Transportation & Warehousing in the United States is 4.9%.