Zip Codes with the Highest Percentage of Owner-Occupied Units in Urbandale, IA
RELATED REPORTS & OPTIONS
Highest Owner-Occupied
Urbandale
Compare Zip Codes
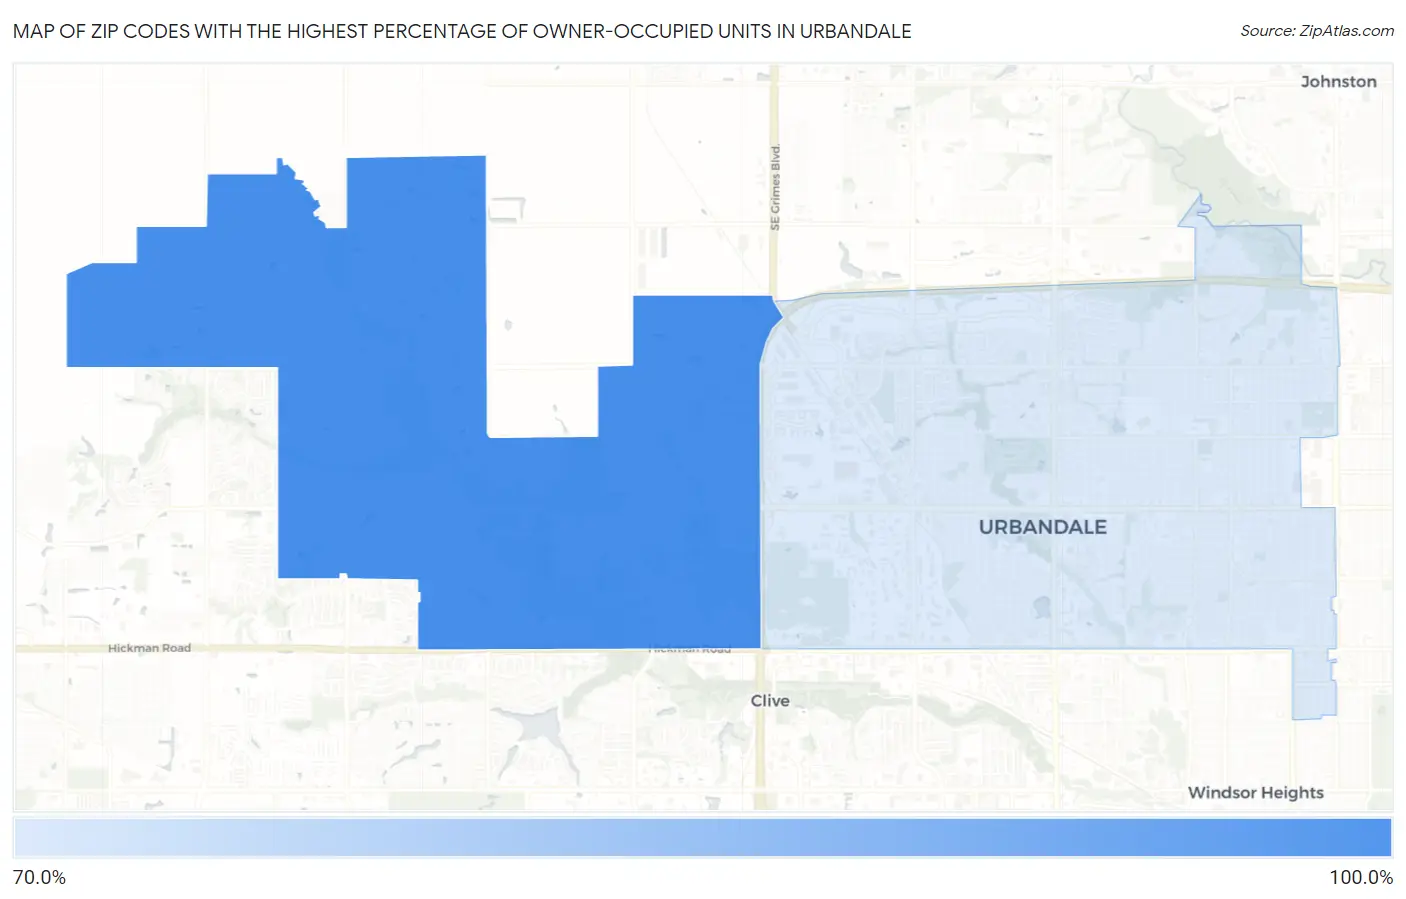
Map of Zip Codes with the Highest Percentage of Owner-Occupied Units in Urbandale
0.0%
100.0%
Zip Codes with the Highest Percentage of Owner-Occupied Units in Urbandale, IA
| Zip Code | % Owner-Occupied | vs State | vs National | |
| 1. | 50323 | 90.4% | 71.5%(+18.9)#167 | 64.8%(+25.6)#5,213 |
| 2. | 50322 | 71.9% | 71.5%(+0.413)#792 | 64.8%(+7.11)#21,469 |
1
Common Questions
What are the Top Zip Codes with the Highest Percentage of Owner-Occupied Units in Urbandale, IA?
Top Zip Codes with the Highest Percentage of Owner-Occupied Units in Urbandale, IA are:
What zip code has the Highest Percentage of Owner-Occupied Units in Urbandale, IA?
50323 has the Highest Percentage of Owner-Occupied Units in Urbandale, IA with 90.4%.
What is the Percentage of Owner-Occupied Units in Urbandale, IA?
Percentage of Owner-Occupied Units in Urbandale is 78.5%.
What is the Percentage of Owner-Occupied Units in Iowa?
Percentage of Owner-Occupied Units in Iowa is 71.5%.
What is the Percentage of Owner-Occupied Units in the United States?
Percentage of Owner-Occupied Units in the United States is 64.8%.