Zip Codes with the Highest Percentage of Households Heated by Bottled Gas / Liquid Propane in Urbandale, IA
RELATED REPORTS & OPTIONS
Bottled Gas / LP Heating
Urbandale
Compare Zip Codes
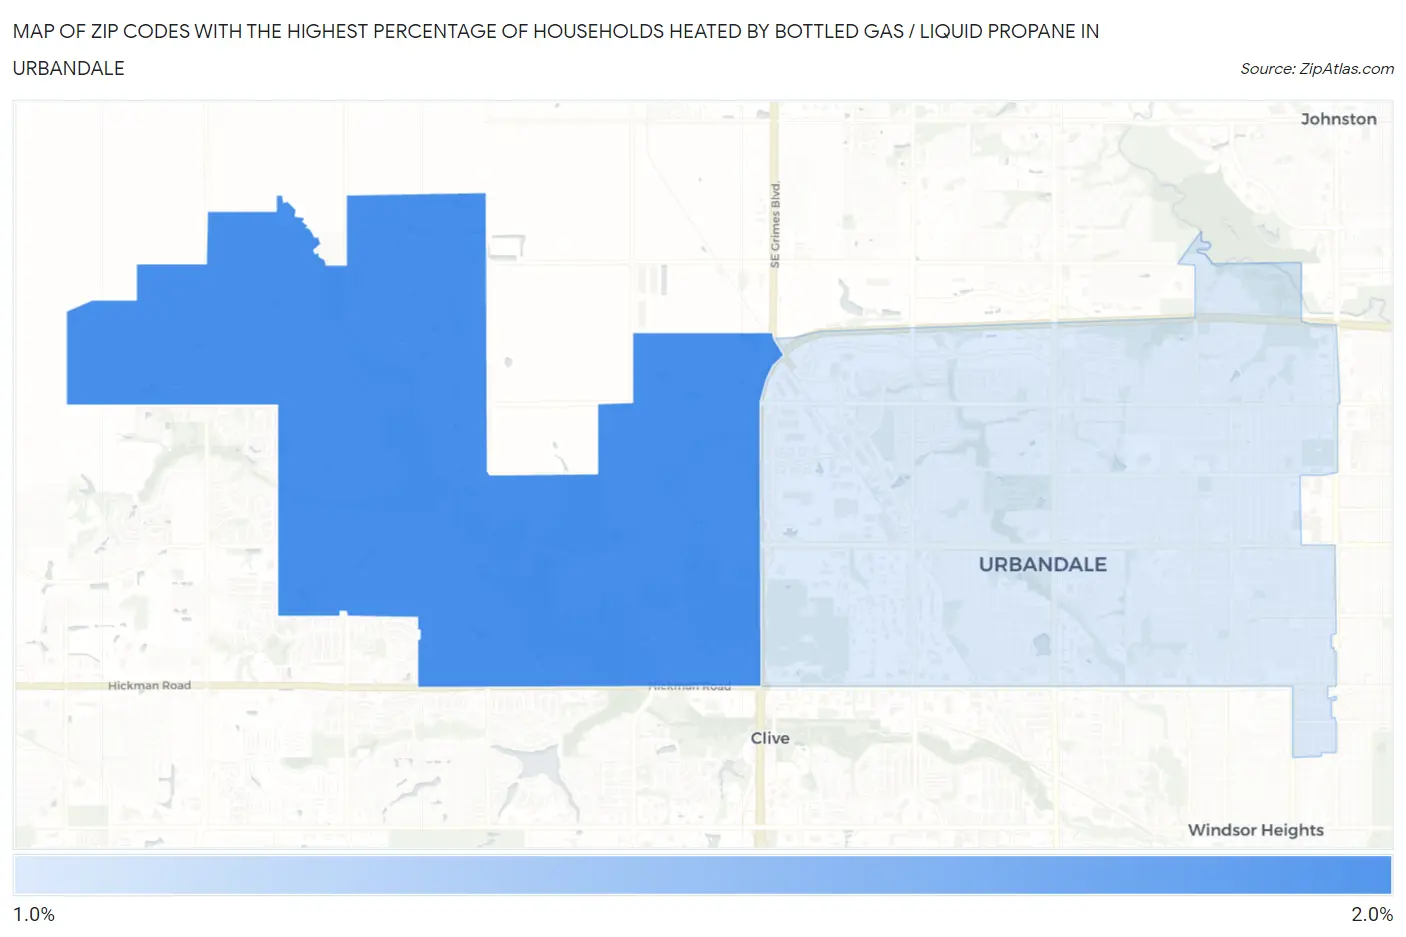
Map of Zip Codes with the Highest Percentage of Households Heated by Bottled Gas / Liquid Propane in Urbandale
0.0%
2.0%
Zip Codes with the Highest Percentage of Households Heated by Bottled Gas / Liquid Propane in Urbandale, IA
| Zip Code | Bottled Gas / LP Heating | vs State | vs National | |
| 1. | 50323 | 1.9% | 12.8%(-10.9)#907 | 4.9%(-3.00)#23,534 |
| 2. | 50322 | 1.7% | 12.8%(-11.1)#910 | 4.9%(-3.20)#24,029 |
1
Common Questions
What are the Top Zip Codes with the Highest Percentage of Households Heated by Bottled Gas / Liquid Propane in Urbandale, IA?
Top Zip Codes with the Highest Percentage of Households Heated by Bottled Gas / Liquid Propane in Urbandale, IA are:
What zip code has the Highest Percentage of Households Heated by Bottled Gas / Liquid Propane in Urbandale, IA?
50323 has the Highest Percentage of Households Heated by Bottled Gas / Liquid Propane in Urbandale, IA with 1.9%.
What is the Percentage of Households Heated by Bottled Gas / Liquid Propane in Urbandale, IA?
Percentage of Households Heated by Bottled Gas / Liquid Propane in Urbandale is 1.8%.
What is the Percentage of Households Heated by Bottled Gas / Liquid Propane in Iowa?
Percentage of Households Heated by Bottled Gas / Liquid Propane in Iowa is 12.8%.
What is the Percentage of Households Heated by Bottled Gas / Liquid Propane in the United States?
Percentage of Households Heated by Bottled Gas / Liquid Propane in the United States is 4.9%.