Zip Codes with the Highest Percentage of Households Heated by Bottled Gas / Liquid Propane in Iowa City, IA
RELATED REPORTS & OPTIONS
Bottled Gas / LP Heating
Iowa City
Compare Zip Codes
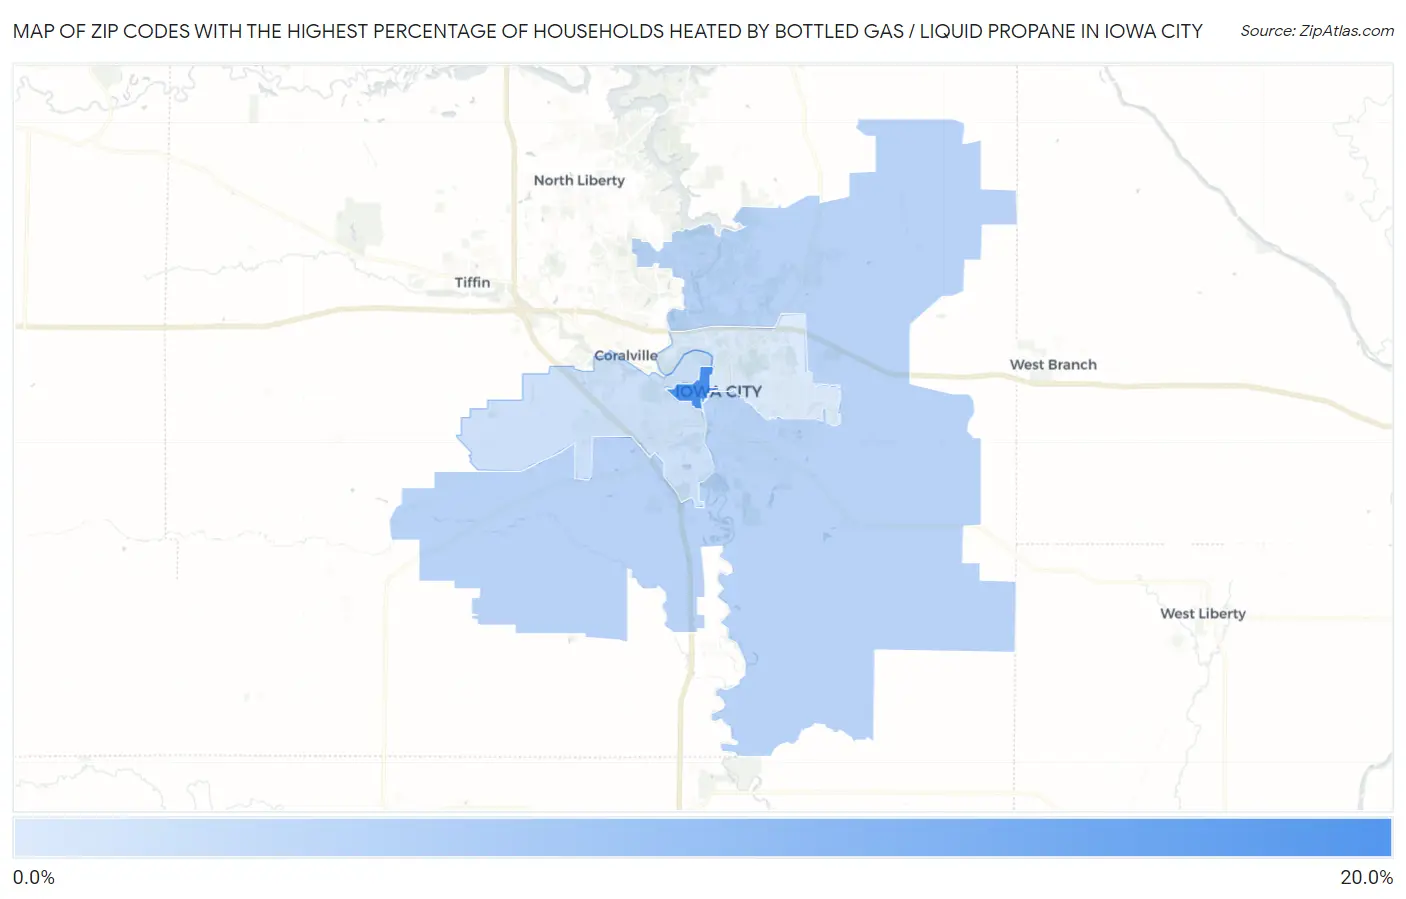
Map of Zip Codes with the Highest Percentage of Households Heated by Bottled Gas / Liquid Propane in Iowa City
0.0%
20.0%
Zip Codes with the Highest Percentage of Households Heated by Bottled Gas / Liquid Propane in Iowa City, IA
| Zip Code | Bottled Gas / LP Heating | vs State | vs National | |
| 1. | 52242 | 17.1% | 12.8%(+4.30)#692 | 4.9%(+12.2)#10,225 |
| 2. | 52240 | 4.7% | 12.8%(-8.10)#867 | 4.9%(-0.200)#18,832 |
| 3. | 52246 | 2.7% | 12.8%(-10.1)#890 | 4.9%(-2.20)#21,559 |
| 4. | 52245 | 1.0% | 12.8%(-11.8)#926 | 4.9%(-3.90)#26,741 |
1
Common Questions
What are the Top 3 Zip Codes with the Highest Percentage of Households Heated by Bottled Gas / Liquid Propane in Iowa City, IA?
Top 3 Zip Codes with the Highest Percentage of Households Heated by Bottled Gas / Liquid Propane in Iowa City, IA are:
What zip code has the Highest Percentage of Households Heated by Bottled Gas / Liquid Propane in Iowa City, IA?
52242 has the Highest Percentage of Households Heated by Bottled Gas / Liquid Propane in Iowa City, IA with 17.1%.
What is the Percentage of Households Heated by Bottled Gas / Liquid Propane in Iowa City, IA?
Percentage of Households Heated by Bottled Gas / Liquid Propane in Iowa City is 1.5%.
What is the Percentage of Households Heated by Bottled Gas / Liquid Propane in Iowa?
Percentage of Households Heated by Bottled Gas / Liquid Propane in Iowa is 12.8%.
What is the Percentage of Households Heated by Bottled Gas / Liquid Propane in the United States?
Percentage of Households Heated by Bottled Gas / Liquid Propane in the United States is 4.9%.