Zip Codes with the Highest Percentage of Population Employed in Sales & Related in Dubuque, IA
RELATED REPORTS & OPTIONS
Sales & Related
Dubuque
Compare Zip Codes
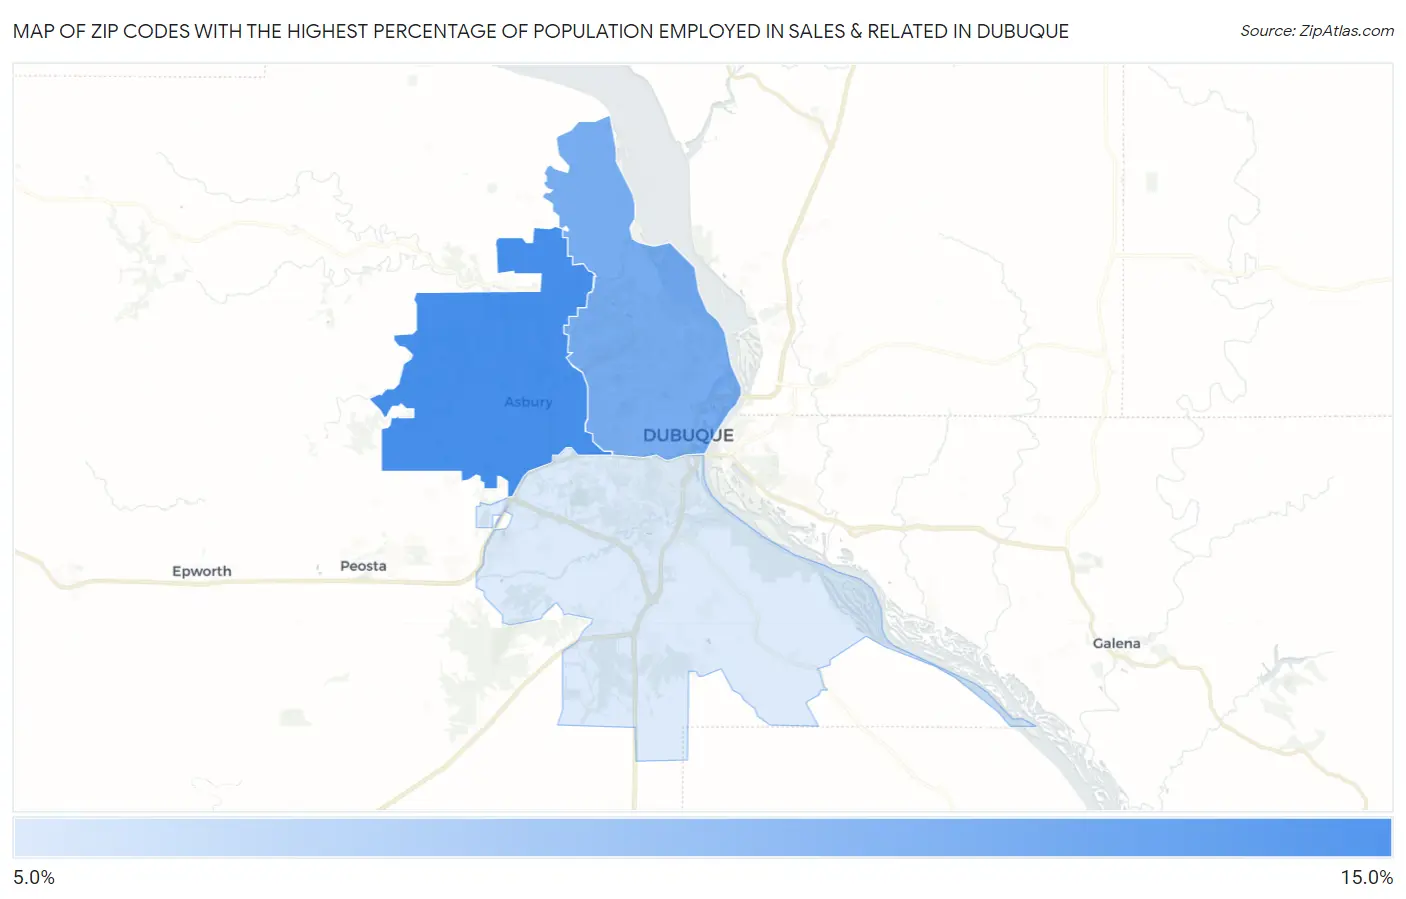
Map of Zip Codes with the Highest Percentage of Population Employed in Sales & Related in Dubuque
7.2%
10.3%
Zip Codes with the Highest Percentage of Population Employed in Sales & Related in Dubuque, IA
| Zip Code | % Employed | vs State | vs National | |
| 1. | 52002 | 10.3% | 9.1%(+1.20)#241 | 9.6%(+0.713)#10,089 |
| 2. | 52001 | 9.3% | 9.1%(+0.192)#329 | 9.6%(-0.301)#13,444 |
| 3. | 52003 | 7.2% | 9.1%(-1.88)#534 | 9.6%(-2.37)#20,570 |
1
Common Questions
What are the Top Zip Codes with the Highest Percentage of Population Employed in Sales & Related in Dubuque, IA?
Top Zip Codes with the Highest Percentage of Population Employed in Sales & Related in Dubuque, IA are:
What zip code has the Highest Percentage of Population Employed in Sales & Related in Dubuque, IA?
52002 has the Highest Percentage of Population Employed in Sales & Related in Dubuque, IA with 10.3%.
What is the Percentage of Population Employed in Sales & Related in Dubuque, IA?
Percentage of Population Employed in Sales & Related in Dubuque is 9.3%.
What is the Percentage of Population Employed in Sales & Related in Iowa?
Percentage of Population Employed in Sales & Related in Iowa is 9.1%.
What is the Percentage of Population Employed in Sales & Related in the United States?
Percentage of Population Employed in Sales & Related in the United States is 9.6%.