Zip Codes with the Highest Percentage of Population Employed in Professional & Scientific Services in Dubuque, IA
RELATED REPORTS & OPTIONS
Professional & Scientific Services
Dubuque
Compare Zip Codes
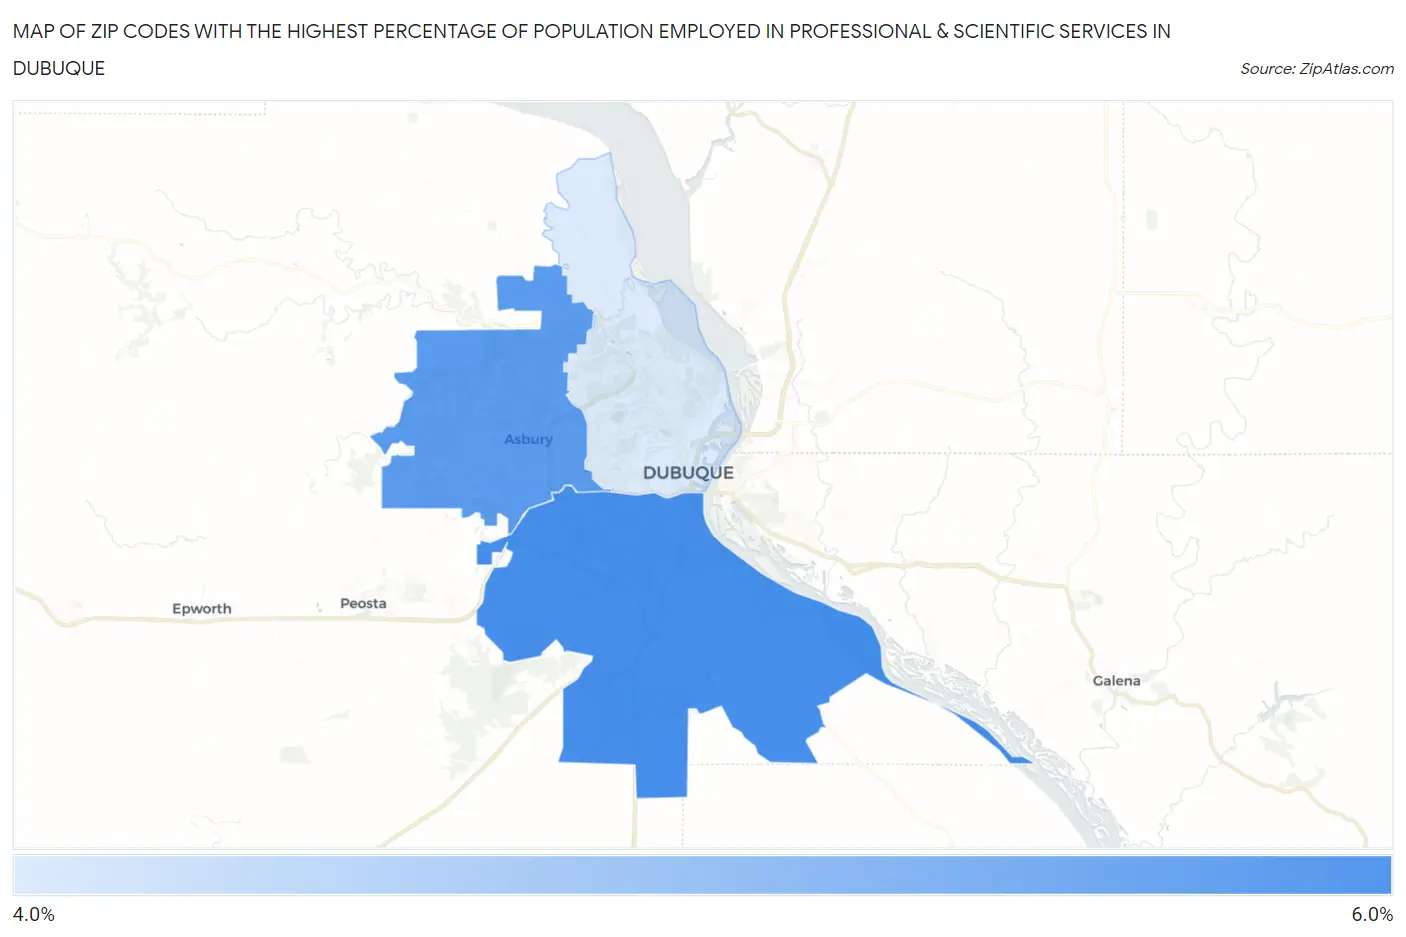
Map of Zip Codes with the Highest Percentage of Population Employed in Professional & Scientific Services in Dubuque
4.6%
5.8%
Zip Codes with the Highest Percentage of Population Employed in Professional & Scientific Services in Dubuque, IA
| Zip Code | % Employed | vs State | vs National | |
| 1. | 52003 | 5.8% | 4.4%(+1.41)#125 | 7.8%(-2.00)#10,275 |
| 2. | 52002 | 5.7% | 4.4%(+1.23)#136 | 7.8%(-2.18)#10,666 |
| 3. | 52001 | 4.6% | 4.4%(+0.123)#210 | 7.8%(-3.29)#13,490 |
1
Common Questions
What are the Top Zip Codes with the Highest Percentage of Population Employed in Professional & Scientific Services in Dubuque, IA?
Top Zip Codes with the Highest Percentage of Population Employed in Professional & Scientific Services in Dubuque, IA are:
What zip code has the Highest Percentage of Population Employed in Professional & Scientific Services in Dubuque, IA?
52003 has the Highest Percentage of Population Employed in Professional & Scientific Services in Dubuque, IA with 5.8%.
What is the Percentage of Population Employed in Professional & Scientific Services in Dubuque, IA?
Percentage of Population Employed in Professional & Scientific Services in Dubuque is 5.0%.
What is the Percentage of Population Employed in Professional & Scientific Services in Iowa?
Percentage of Population Employed in Professional & Scientific Services in Iowa is 4.4%.
What is the Percentage of Population Employed in Professional & Scientific Services in the United States?
Percentage of Population Employed in Professional & Scientific Services in the United States is 7.8%.