Zip Codes with the Highest Percentage of Population Employed in Sales & Related in Des Moines, IA
RELATED REPORTS & OPTIONS
Sales & Related
Des Moines
Compare Zip Codes
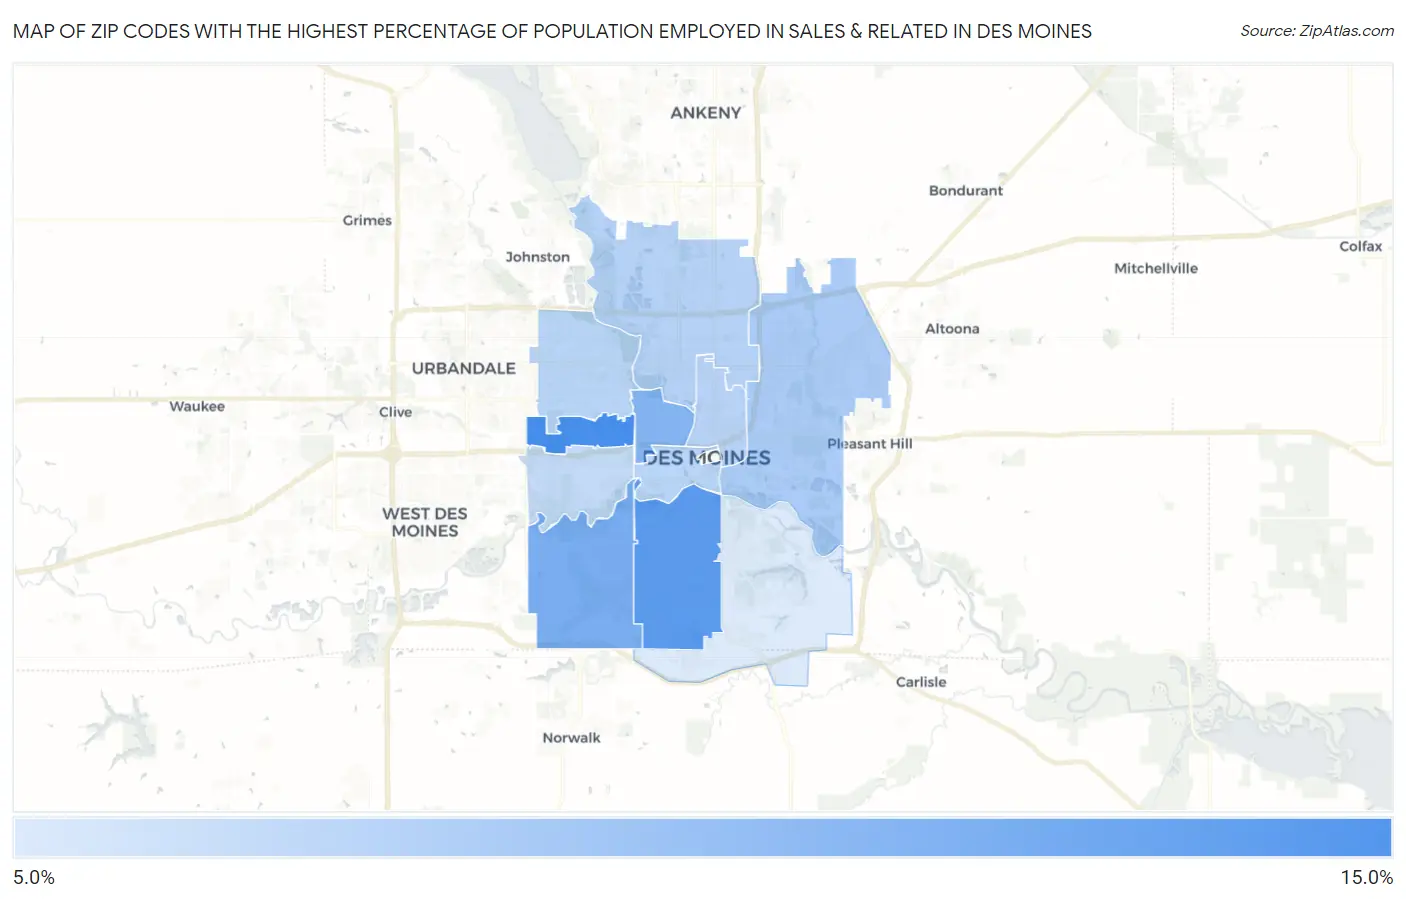
Map of Zip Codes with the Highest Percentage of Population Employed in Sales & Related in Des Moines
6.7%
13.0%
Zip Codes with the Highest Percentage of Population Employed in Sales & Related in Des Moines, IA
| Zip Code | % Employed | vs State | vs National | |
| 1. | 50311 | 13.0% | 9.1%(+3.93)#112 | 9.6%(+3.44)#4,444 |
| 2. | 50315 | 12.2% | 9.1%(+3.10)#133 | 9.6%(+2.61)#5,660 |
| 3. | 50321 | 10.8% | 9.1%(+1.71)#199 | 9.6%(+1.22)#8,684 |
| 4. | 50314 | 10.3% | 9.1%(+1.23)#236 | 9.6%(+0.742)#10,008 |
| 5. | 50317 | 8.8% | 9.1%(-0.258)#368 | 9.6%(-0.750)#15,091 |
| 6. | 50313 | 8.3% | 9.1%(-0.765)#419 | 9.6%(-1.26)#16,898 |
| 7. | 50316 | 8.3% | 9.1%(-0.843)#427 | 9.6%(-1.34)#17,205 |
| 8. | 50310 | 8.2% | 9.1%(-0.924)#438 | 9.6%(-1.42)#17,480 |
| 9. | 50309 | 8.1% | 9.1%(-0.987)#442 | 9.6%(-1.48)#17,675 |
| 10. | 50312 | 7.7% | 9.1%(-1.38)#478 | 9.6%(-1.88)#18,926 |
| 11. | 50320 | 6.7% | 9.1%(-2.40)#580 | 9.6%(-2.89)#21,945 |
1
Common Questions
What are the Top 10 Zip Codes with the Highest Percentage of Population Employed in Sales & Related in Des Moines, IA?
Top 10 Zip Codes with the Highest Percentage of Population Employed in Sales & Related in Des Moines, IA are:
What zip code has the Highest Percentage of Population Employed in Sales & Related in Des Moines, IA?
50311 has the Highest Percentage of Population Employed in Sales & Related in Des Moines, IA with 13.0%.
What is the Percentage of Population Employed in Sales & Related in Des Moines, IA?
Percentage of Population Employed in Sales & Related in Des Moines is 9.2%.
What is the Percentage of Population Employed in Sales & Related in Iowa?
Percentage of Population Employed in Sales & Related in Iowa is 9.1%.
What is the Percentage of Population Employed in Sales & Related in the United States?
Percentage of Population Employed in Sales & Related in the United States is 9.6%.