Zip Codes with the Highest Percentage of Population Employed in Agriculture, Fishing & Hunting in Davenport, IA
RELATED REPORTS & OPTIONS
Agriculture, Fishing & Hunting
Davenport
Compare Zip Codes
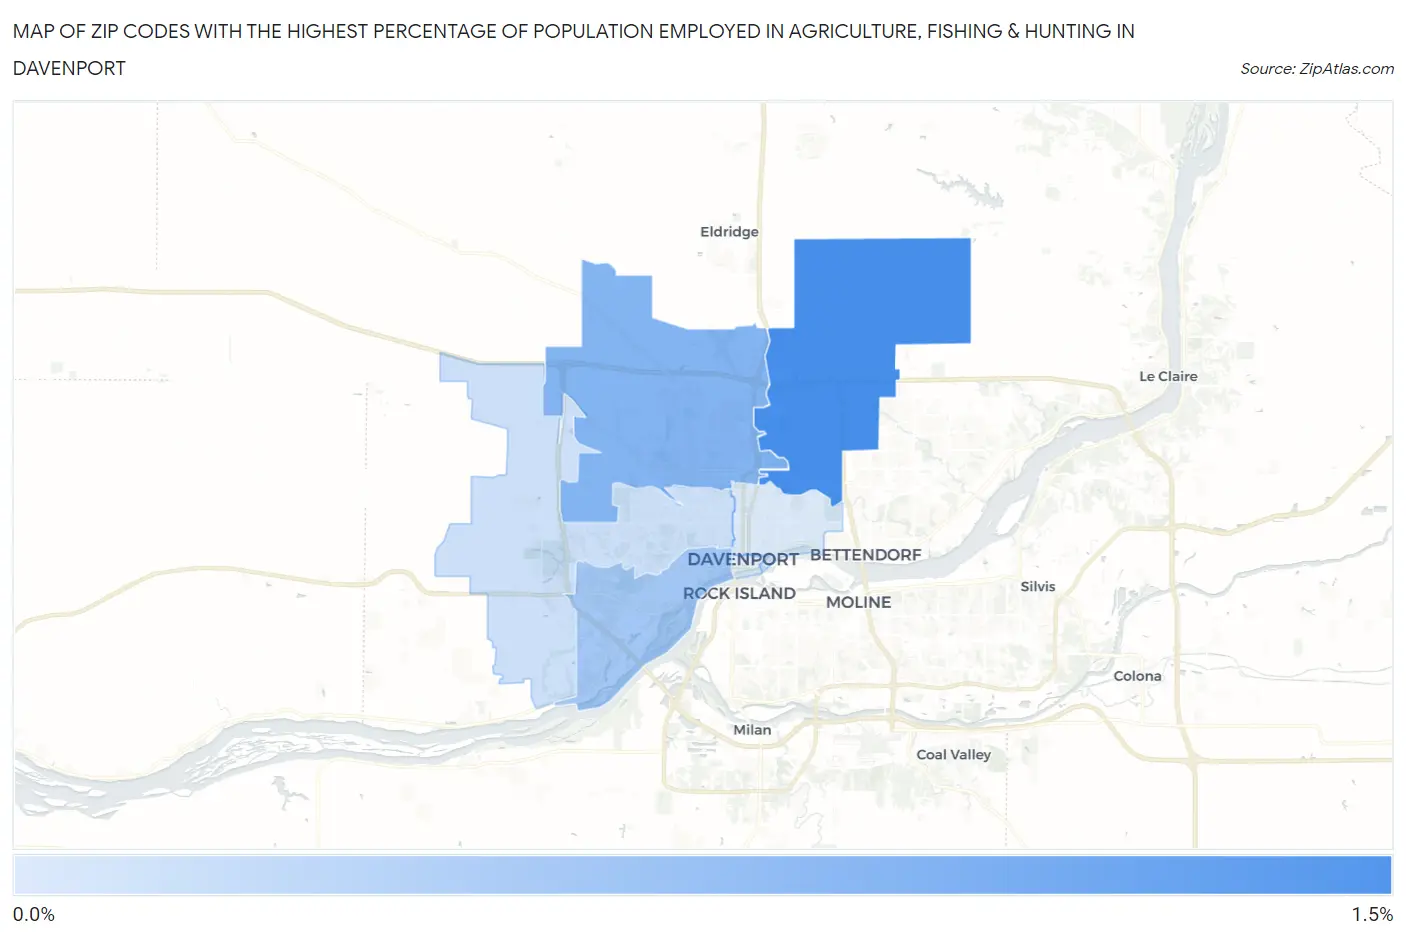
Map of Zip Codes with the Highest Percentage of Population Employed in Agriculture, Fishing & Hunting in Davenport
0.0%
1.5%
Zip Codes with the Highest Percentage of Population Employed in Agriculture, Fishing & Hunting in Davenport, IA
| Zip Code | % Employed | vs State | vs National | |
| 1. | 52807 | 1.2% | 3.5%(-2.25)#797 | 1.2%(+0.046)#15,229 |
| 2. | 52806 | 0.78% | 3.5%(-2.72)#838 | 1.2%(-0.423)#17,387 |
| 3. | 52802 | 0.51% | 3.5%(-2.98)#859 | 1.2%(-0.687)#19,163 |
| 4. | 52804 | 0.19% | 3.5%(-3.31)#880 | 1.2%(-1.01)#22,525 |
| 5. | 52803 | 0.058% | 3.5%(-3.44)#882 | 1.2%(-1.14)#24,249 |
1
Common Questions
What are the Top 5 Zip Codes with the Highest Percentage of Population Employed in Agriculture, Fishing & Hunting in Davenport, IA?
Top 5 Zip Codes with the Highest Percentage of Population Employed in Agriculture, Fishing & Hunting in Davenport, IA are:
What zip code has the Highest Percentage of Population Employed in Agriculture, Fishing & Hunting in Davenport, IA?
52807 has the Highest Percentage of Population Employed in Agriculture, Fishing & Hunting in Davenport, IA with 1.2%.
What is the Percentage of Population Employed in Agriculture, Fishing & Hunting in Davenport, IA?
Percentage of Population Employed in Agriculture, Fishing & Hunting in Davenport is 0.37%.
What is the Percentage of Population Employed in Agriculture, Fishing & Hunting in Iowa?
Percentage of Population Employed in Agriculture, Fishing & Hunting in Iowa is 3.5%.
What is the Percentage of Population Employed in Agriculture, Fishing & Hunting in the United States?
Percentage of Population Employed in Agriculture, Fishing & Hunting in the United States is 1.2%.