Zip Codes with the Highest Percentage of Households Heated by Bottled Gas / Liquid Propane in Davenport, IA
RELATED REPORTS & OPTIONS
Bottled Gas / LP Heating
Davenport
Compare Zip Codes
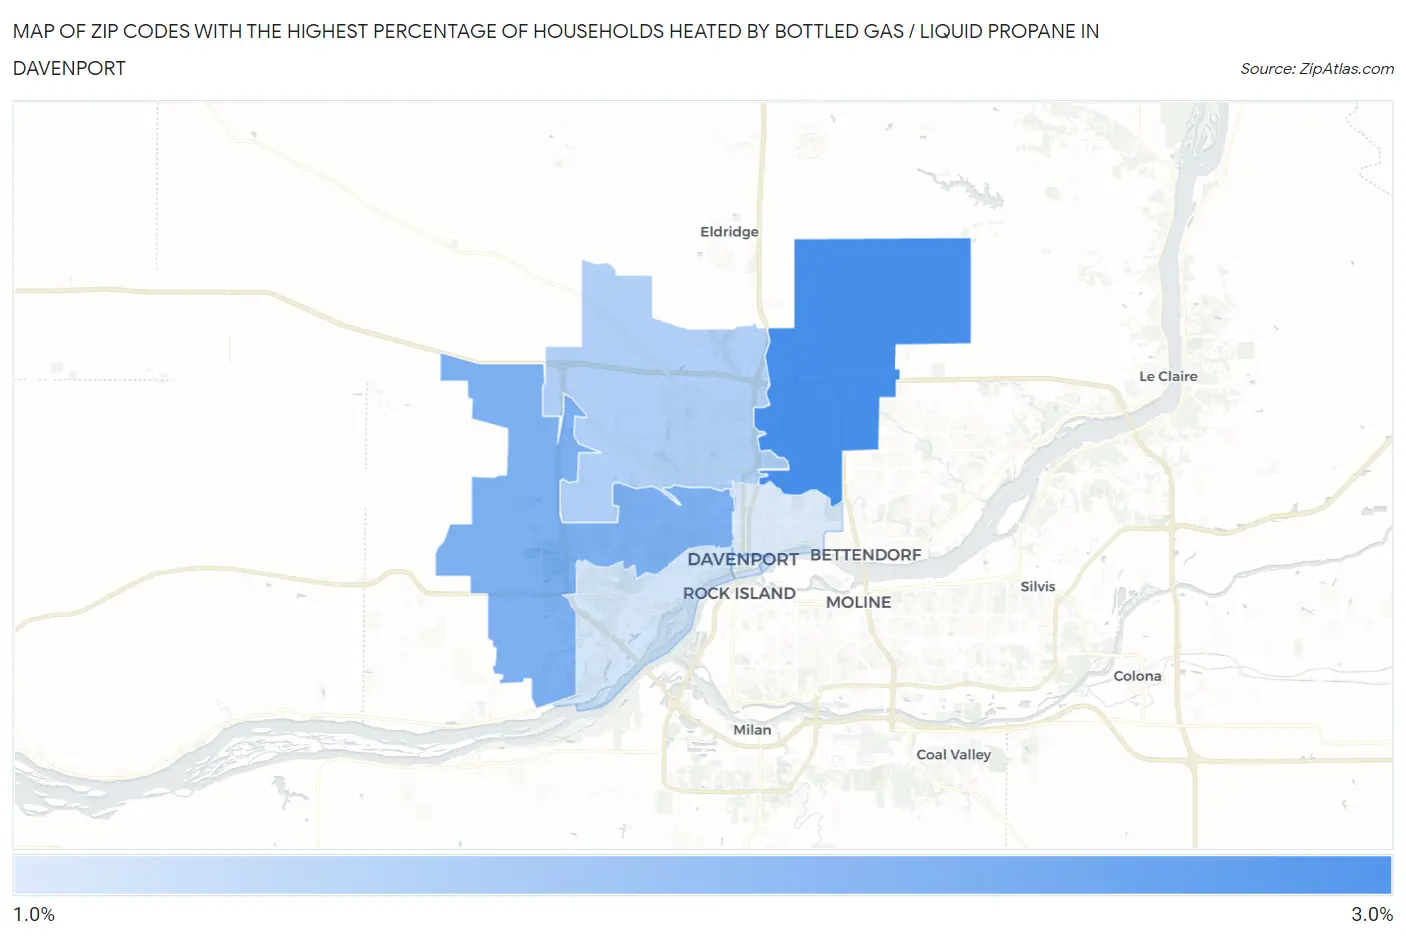
Map of Zip Codes with the Highest Percentage of Households Heated by Bottled Gas / Liquid Propane in Davenport
0.0%
3.0%
Zip Codes with the Highest Percentage of Households Heated by Bottled Gas / Liquid Propane in Davenport, IA
| Zip Code | Bottled Gas / LP Heating | vs State | vs National | |
| 1. | 52807 | 3.0% | 12.8%(-9.80)#884 | 4.9%(-1.90)#21,047 |
| 2. | 52804 | 2.4% | 12.8%(-10.4)#896 | 4.9%(-2.50)#22,172 |
| 3. | 52806 | 1.8% | 12.8%(-11.0)#909 | 4.9%(-3.10)#23,757 |
| 4. | 52802 | 1.4% | 12.8%(-11.4)#918 | 4.9%(-3.50)#25,250 |
| 5. | 52803 | 1.3% | 12.8%(-11.5)#920 | 4.9%(-3.60)#25,545 |
1
Common Questions
What are the Top 5 Zip Codes with the Highest Percentage of Households Heated by Bottled Gas / Liquid Propane in Davenport, IA?
Top 5 Zip Codes with the Highest Percentage of Households Heated by Bottled Gas / Liquid Propane in Davenport, IA are:
What zip code has the Highest Percentage of Households Heated by Bottled Gas / Liquid Propane in Davenport, IA?
52807 has the Highest Percentage of Households Heated by Bottled Gas / Liquid Propane in Davenport, IA with 3.0%.
What is the Percentage of Households Heated by Bottled Gas / Liquid Propane in Davenport, IA?
Percentage of Households Heated by Bottled Gas / Liquid Propane in Davenport is 1.4%.
What is the Percentage of Households Heated by Bottled Gas / Liquid Propane in Iowa?
Percentage of Households Heated by Bottled Gas / Liquid Propane in Iowa is 12.8%.
What is the Percentage of Households Heated by Bottled Gas / Liquid Propane in the United States?
Percentage of Households Heated by Bottled Gas / Liquid Propane in the United States is 4.9%.