Cities with the Highest Percentage of Population Employed in Manufacturing in Iowa
RELATED REPORTS & OPTIONS
Manufacturing
Iowa
Compare Cities
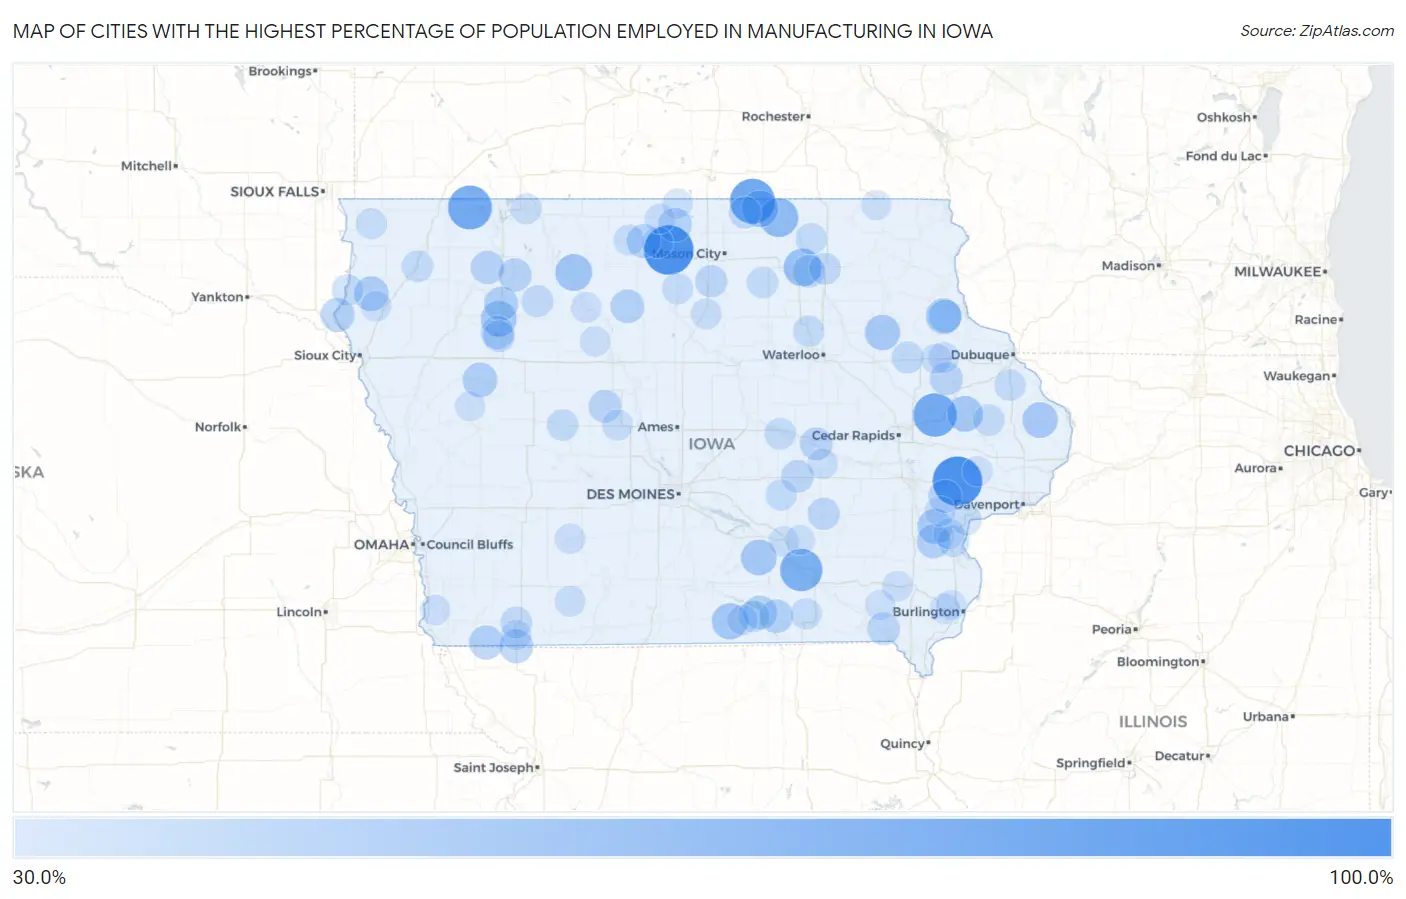
Map of Cities with the Highest Percentage of Population Employed in Manufacturing in Iowa
0.0%
100.0%
Cities with the Highest Percentage of Population Employed in Manufacturing in Iowa
| City | % Employed | vs State | vs National | |
| 1. | Rochester | 100.0% | 14.9%(+85.1)#1 | 10.0%(+90.0)#44 |
| 2. | Hayfield | 100.0% | 14.9%(+85.1)#2 | 10.0%(+90.0)#60 |
| 3. | Mona | 83.3% | 14.9%(+68.5)#3 | 10.0%(+73.3)#86 |
| 4. | Harris | 79.2% | 14.9%(+64.4)#4 | 10.0%(+69.2)#97 |
| 5. | Stone City | 78.2% | 14.9%(+63.3)#5 | 10.0%(+68.2)#102 |
| 6. | Montpelier | 76.8% | 14.9%(+62.0)#6 | 10.0%(+66.8)#107 |
| 7. | Chillicothe | 73.3% | 14.9%(+58.5)#7 | 10.0%(+63.3)#116 |
| 8. | Yarmouth | 72.7% | 14.9%(+57.9)#8 | 10.0%(+62.7)#120 |
| 9. | Little Cedar | 61.5% | 14.9%(+46.7)#9 | 10.0%(+51.5)#187 |
| 10. | Big Rock | 60.0% | 14.9%(+45.1)#10 | 10.0%(+50.0)#207 |
| 11. | Moscow | 57.7% | 14.9%(+42.9)#11 | 10.0%(+47.7)#227 |
| 12. | Bassett | 57.1% | 14.9%(+42.3)#12 | 10.0%(+47.2)#238 |
| 13. | Rodman | 53.8% | 14.9%(+39.0)#13 | 10.0%(+43.9)#306 |
| 14. | Toeterville | 53.3% | 14.9%(+38.5)#14 | 10.0%(+43.3)#316 |
| 15. | Promise City | 51.7% | 14.9%(+36.9)#15 | 10.0%(+41.7)#346 |
| 16. | Truesdale | 50.0% | 14.9%(+35.1)#16 | 10.0%(+40.0)#378 |
| 17. | Center Junction | 50.0% | 14.9%(+35.1)#17 | 10.0%(+40.0)#379 |
| 18. | Hamilton | 50.0% | 14.9%(+35.1)#18 | 10.0%(+40.0)#383 |
| 19. | Elkport | 50.0% | 14.9%(+35.1)#19 | 10.0%(+40.0)#400 |
| 20. | Spragueville | 48.7% | 14.9%(+33.9)#20 | 10.0%(+38.7)#429 |
| 21. | Stanley | 48.6% | 14.9%(+33.8)#21 | 10.0%(+38.7)#431 |
| 22. | Conesville | 47.5% | 14.9%(+32.6)#22 | 10.0%(+37.5)#465 |
| 23. | Craig | 46.3% | 14.9%(+31.5)#23 | 10.0%(+36.4)#501 |
| 24. | Arthur | 46.2% | 14.9%(+31.3)#24 | 10.0%(+36.2)#508 |
| 25. | Rembrandt | 44.3% | 14.9%(+29.5)#25 | 10.0%(+34.3)#583 |
| 26. | Northboro | 44.1% | 14.9%(+29.2)#26 | 10.0%(+34.1)#601 |
| 27. | Columbus Junction | 44.0% | 14.9%(+29.1)#27 | 10.0%(+34.0)#604 |
| 28. | Woden | 43.9% | 14.9%(+29.0)#28 | 10.0%(+33.9)#605 |
| 29. | Braddyville | 43.9% | 14.9%(+29.0)#29 | 10.0%(+33.9)#606 |
| 30. | Leland | 43.5% | 14.9%(+28.7)#30 | 10.0%(+33.5)#630 |
| 31. | Westfield | 43.5% | 14.9%(+28.6)#31 | 10.0%(+33.5)#632 |
| 32. | Rathbun | 42.9% | 14.9%(+28.0)#32 | 10.0%(+32.9)#663 |
| 33. | Udell | 42.9% | 14.9%(+28.0)#33 | 10.0%(+32.9)#664 |
| 34. | Hardy | 42.9% | 14.9%(+28.0)#34 | 10.0%(+32.9)#666 |
| 35. | Royal | 41.9% | 14.9%(+27.1)#35 | 10.0%(+31.9)#706 |
| 36. | West Liberty | 41.5% | 14.9%(+26.7)#36 | 10.0%(+31.5)#736 |
| 37. | Storm Lake | 41.5% | 14.9%(+26.6)#37 | 10.0%(+31.5)#737 |
| 38. | Gillett Grove | 41.2% | 14.9%(+26.3)#38 | 10.0%(+31.2)#749 |
| 39. | Hopkinton | 40.8% | 14.9%(+25.9)#39 | 10.0%(+30.8)#779 |
| 40. | Paton | 40.0% | 14.9%(+25.1)#40 | 10.0%(+30.0)#833 |
| 41. | Garber | 40.0% | 14.9%(+25.1)#41 | 10.0%(+30.0)#836 |
| 42. | Kingston | 40.0% | 14.9%(+25.1)#42 | 10.0%(+30.0)#843 |
| 43. | Chelsea | 39.4% | 14.9%(+24.5)#43 | 10.0%(+29.4)#877 |
| 44. | Malcom | 39.2% | 14.9%(+24.3)#44 | 10.0%(+29.2)#890 |
| 45. | Bonaparte | 38.8% | 14.9%(+23.9)#45 | 10.0%(+28.8)#913 |
| 46. | Ionia | 38.2% | 14.9%(+23.3)#46 | 10.0%(+28.2)#968 |
| 47. | Swaledale | 37.7% | 14.9%(+22.9)#47 | 10.0%(+27.7)#1,007 |
| 48. | Carpenter | 37.5% | 14.9%(+22.6)#48 | 10.0%(+27.5)#1,019 |
| 49. | Thornburg | 37.5% | 14.9%(+22.6)#49 | 10.0%(+27.5)#1,021 |
| 50. | Augusta | 37.0% | 14.9%(+22.2)#50 | 10.0%(+27.0)#1,060 |
| 51. | Lakeside | 36.6% | 14.9%(+21.8)#51 | 10.0%(+26.7)#1,097 |
| 52. | Masonville | 36.6% | 14.9%(+21.7)#52 | 10.0%(+26.6)#1,104 |
| 53. | Laurens | 36.3% | 14.9%(+21.4)#53 | 10.0%(+26.3)#1,137 |
| 54. | Clarinda | 36.0% | 14.9%(+21.2)#54 | 10.0%(+26.0)#1,162 |
| 55. | New Hampton | 35.9% | 14.9%(+21.1)#55 | 10.0%(+26.0)#1,171 |
| 56. | Grandview | 35.7% | 14.9%(+20.9)#56 | 10.0%(+25.7)#1,199 |
| 57. | Ralston | 35.5% | 14.9%(+20.6)#57 | 10.0%(+25.5)#1,230 |
| 58. | Hospers | 35.4% | 14.9%(+20.5)#58 | 10.0%(+25.4)#1,244 |
| 59. | Montour | 35.2% | 14.9%(+20.4)#59 | 10.0%(+25.3)#1,263 |
| 60. | Chatsworth | 35.1% | 14.9%(+20.3)#60 | 10.0%(+25.1)#1,276 |
| 61. | Mystic | 35.0% | 14.9%(+20.2)#61 | 10.0%(+25.0)#1,281 |
| 62. | Marble Rock | 34.8% | 14.9%(+20.0)#62 | 10.0%(+24.8)#1,305 |
| 63. | Janesville | 34.8% | 14.9%(+19.9)#63 | 10.0%(+24.8)#1,306 |
| 64. | Monmouth | 34.8% | 14.9%(+19.9)#64 | 10.0%(+24.8)#1,309 |
| 65. | Zwingle | 34.8% | 14.9%(+19.9)#65 | 10.0%(+24.8)#1,311 |
| 66. | Elma | 34.7% | 14.9%(+19.9)#66 | 10.0%(+24.7)#1,319 |
| 67. | Crystal Lake | 34.6% | 14.9%(+19.7)#67 | 10.0%(+24.6)#1,340 |
| 68. | Drakesville | 34.4% | 14.9%(+19.5)#68 | 10.0%(+24.4)#1,362 |
| 69. | Searsboro | 34.3% | 14.9%(+19.5)#69 | 10.0%(+24.3)#1,371 |
| 70. | Goodell | 34.0% | 14.9%(+19.2)#70 | 10.0%(+24.0)#1,417 |
| 71. | Letts | 33.3% | 14.9%(+18.5)#71 | 10.0%(+23.3)#1,494 |
| 72. | Superior | 33.3% | 14.9%(+18.5)#72 | 10.0%(+23.3)#1,503 |
| 73. | Beaver | 33.3% | 14.9%(+18.5)#73 | 10.0%(+23.3)#1,513 |
| 74. | Muscatine | 33.3% | 14.9%(+18.4)#74 | 10.0%(+23.3)#1,529 |
| 75. | Earlville | 33.2% | 14.9%(+18.3)#75 | 10.0%(+23.2)#1,537 |
| 76. | Titonka | 33.0% | 14.9%(+18.2)#76 | 10.0%(+23.1)#1,553 |
| 77. | Alvord | 33.0% | 14.9%(+18.2)#77 | 10.0%(+23.1)#1,554 |
| 78. | Latimer | 32.9% | 14.9%(+18.1)#78 | 10.0%(+23.0)#1,564 |
| 79. | Lenox | 32.5% | 14.9%(+17.7)#79 | 10.0%(+22.5)#1,618 |
| 80. | Plano | 32.1% | 14.9%(+17.3)#80 | 10.0%(+22.2)#1,670 |
| 81. | Rome | 31.9% | 14.9%(+17.1)#81 | 10.0%(+21.9)#1,712 |
| 82. | Brunsville | 31.9% | 14.9%(+17.0)#82 | 10.0%(+21.9)#1,717 |
| 83. | Clare | 31.9% | 14.9%(+17.0)#83 | 10.0%(+21.9)#1,718 |
| 84. | Shambaugh | 31.7% | 14.9%(+16.9)#84 | 10.0%(+21.7)#1,747 |
| 85. | Thurman | 31.6% | 14.9%(+16.8)#85 | 10.0%(+21.7)#1,759 |
| 86. | Delaware | 31.6% | 14.9%(+16.8)#86 | 10.0%(+21.7)#1,760 |
| 87. | Nichols | 31.6% | 14.9%(+16.8)#87 | 10.0%(+21.6)#1,765 |
| 88. | Bradgate | 31.6% | 14.9%(+16.7)#88 | 10.0%(+21.6)#1,773 |
| 89. | Beacon | 31.5% | 14.9%(+16.6)#89 | 10.0%(+21.5)#1,795 |
| 90. | Hartwick | 31.4% | 14.9%(+16.5)#90 | 10.0%(+21.4)#1,809 |
| 91. | Fontanelle | 31.3% | 14.9%(+16.4)#91 | 10.0%(+21.3)#1,830 |
| 92. | Scarville | 31.2% | 14.9%(+16.4)#92 | 10.0%(+21.3)#1,837 |
| 93. | Thompson | 31.2% | 14.9%(+16.4)#93 | 10.0%(+21.2)#1,839 |
| 94. | Middletown | 31.1% | 14.9%(+16.3)#94 | 10.0%(+21.1)#1,855 |
| 95. | Bennett | 31.0% | 14.9%(+16.2)#95 | 10.0%(+21.0)#1,871 |
| 96. | Schleswig | 30.8% | 14.9%(+15.9)#96 | 10.0%(+20.8)#1,906 |
| 97. | Keomah Village | 30.8% | 14.9%(+15.9)#97 | 10.0%(+20.8)#1,913 |
| 98. | Stockport | 30.7% | 14.9%(+15.8)#98 | 10.0%(+20.7)#1,939 |
| 99. | Beaverdale | 30.7% | 14.9%(+15.8)#99 | 10.0%(+20.7)#1,942 |
| 100. | Burr Oak | 30.6% | 14.9%(+15.8)#100 | 10.0%(+20.6)#1,954 |
Common Questions
What are the Top 10 Cities with the Highest Percentage of Population Employed in Manufacturing in Iowa?
Top 10 Cities with the Highest Percentage of Population Employed in Manufacturing in Iowa are:
#1
100.0%
#2
100.0%
#3
83.3%
#4
79.2%
#5
78.2%
#6
73.3%
#7
61.5%
#8
57.1%
#9
53.8%
#10
53.3%
What city has the Highest Percentage of Population Employed in Manufacturing in Iowa?
Rochester has the Highest Percentage of Population Employed in Manufacturing in Iowa with 100.0%.
What is the Percentage of Population Employed in Manufacturing in the State of Iowa?
Percentage of Population Employed in Manufacturing in Iowa is 14.9%.
What is the Percentage of Population Employed in Manufacturing in the United States?
Percentage of Population Employed in Manufacturing in the United States is 10.0%.