Cities with the Highest Percentage of Population Employed in Finance & Insurance in Iowa
RELATED REPORTS & OPTIONS
Finance & Insurance
Iowa
Compare Cities
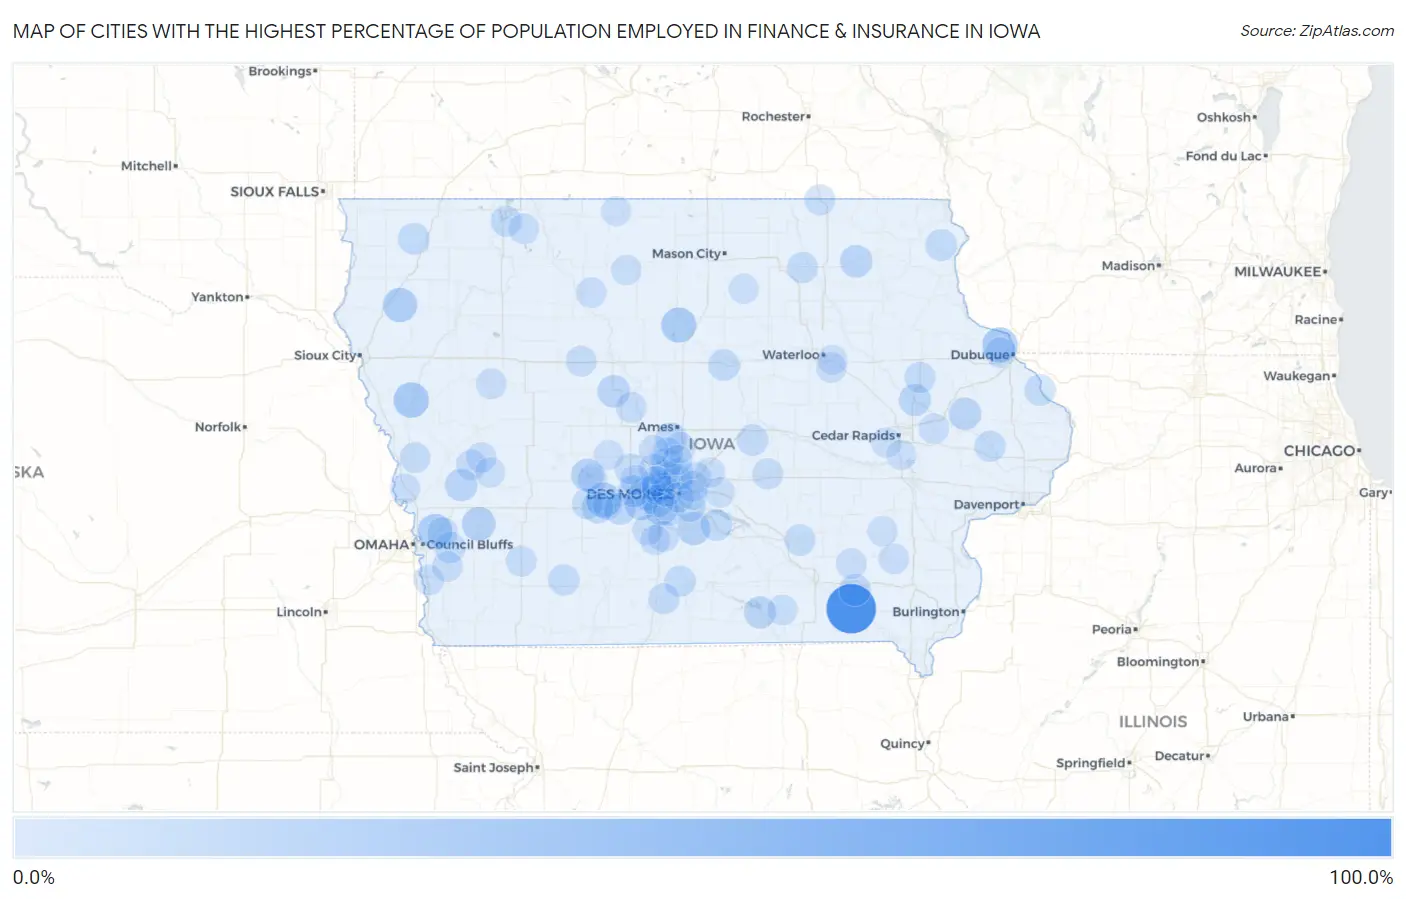
Map of Cities with the Highest Percentage of Population Employed in Finance & Insurance in Iowa
0.0%
100.0%
Cities with the Highest Percentage of Population Employed in Finance & Insurance in Iowa
| City | % Employed | vs State | vs National | |
| 1. | Leando | 100.0% | 6.6%(+93.4)#1 | 4.8%(+95.2)#10 |
| 2. | Swedesburg | 50.0% | 6.6%(+43.4)#2 | 4.8%(+45.2)#42 |
| 3. | Rodney | 33.3% | 6.6%(+26.7)#3 | 4.8%(+28.6)#119 |
| 4. | Durango | 33.3% | 6.6%(+26.7)#4 | 4.8%(+28.6)#125 |
| 5. | Galt | 31.8% | 6.6%(+25.2)#5 | 4.8%(+27.1)#138 |
| 6. | Diamondhead Lake | 30.9% | 6.6%(+24.3)#6 | 4.8%(+26.2)#144 |
| 7. | Weston | 29.8% | 6.6%(+23.2)#7 | 4.8%(+25.1)#157 |
| 8. | Oyens | 28.7% | 6.6%(+22.1)#8 | 4.8%(+24.0)#171 |
| 9. | Hancock | 25.9% | 6.6%(+19.3)#9 | 4.8%(+21.1)#208 |
| 10. | Waukee | 24.0% | 6.6%(+17.4)#10 | 4.8%(+19.2)#240 |
| 11. | Cumming | 23.2% | 6.6%(+16.6)#11 | 4.8%(+18.4)#254 |
| 12. | Ackworth | 23.1% | 6.6%(+16.5)#12 | 4.8%(+18.3)#258 |
| 13. | Van Meter | 21.6% | 6.6%(+15.0)#13 | 4.8%(+16.9)#305 |
| 14. | Lake Panorama | 21.6% | 6.6%(+15.0)#14 | 4.8%(+16.8)#307 |
| 15. | Jackson Junction | 21.1% | 6.6%(+14.4)#15 | 4.8%(+16.3)#324 |
| 16. | Harcourt | 20.6% | 6.6%(+14.0)#16 | 4.8%(+15.8)#338 |
| 17. | Portsmouth | 20.4% | 6.6%(+13.8)#17 | 4.8%(+15.6)#348 |
| 18. | Center Junction | 20.0% | 6.6%(+13.4)#18 | 4.8%(+15.2)#364 |
| 19. | West Des Moines | 19.1% | 6.6%(+12.5)#19 | 4.8%(+14.3)#410 |
| 20. | Rathbun | 19.0% | 6.6%(+12.4)#20 | 4.8%(+14.3)#414 |
| 21. | Central City | 19.0% | 6.6%(+12.4)#21 | 4.8%(+14.2)#417 |
| 22. | Adel | 18.7% | 6.6%(+12.1)#22 | 4.8%(+13.9)#429 |
| 23. | Kelley | 18.5% | 6.6%(+11.9)#23 | 4.8%(+13.8)#436 |
| 24. | Urbandale | 18.2% | 6.6%(+11.6)#24 | 4.8%(+13.5)#450 |
| 25. | Earlham | 18.2% | 6.6%(+11.6)#25 | 4.8%(+13.4)#461 |
| 26. | Libertyville | 18.1% | 6.6%(+11.5)#26 | 4.8%(+13.4)#462 |
| 27. | Clive | 17.9% | 6.6%(+11.3)#27 | 4.8%(+13.1)#475 |
| 28. | Stuart | 16.9% | 6.6%(+10.3)#28 | 4.8%(+12.2)#521 |
| 29. | Waterville | 16.9% | 6.6%(+10.3)#29 | 4.8%(+12.1)#523 |
| 30. | Johnston | 16.8% | 6.6%(+10.2)#30 | 4.8%(+12.0)#529 |
| 31. | Pleasantville | 16.8% | 6.6%(+10.2)#31 | 4.8%(+12.0)#533 |
| 32. | Norwalk | 16.7% | 6.6%(+10.1)#32 | 4.8%(+11.9)#538 |
| 33. | Owasa | 16.7% | 6.6%(+10.1)#33 | 4.8%(+11.9)#547 |
| 34. | Matlock | 16.5% | 6.6%(+9.88)#34 | 4.8%(+11.7)#555 |
| 35. | Saylorville | 16.4% | 6.6%(+9.82)#35 | 4.8%(+11.7)#558 |
| 36. | Haverhill | 16.3% | 6.6%(+9.70)#36 | 4.8%(+11.5)#565 |
| 37. | Carlisle | 15.7% | 6.6%(+9.09)#37 | 4.8%(+10.9)#622 |
| 38. | Polk City | 15.5% | 6.6%(+8.88)#38 | 4.8%(+10.7)#643 |
| 39. | Menlo | 15.4% | 6.6%(+8.81)#39 | 4.8%(+10.6)#650 |
| 40. | Keomah Village | 15.4% | 6.6%(+8.78)#40 | 4.8%(+10.6)#657 |
| 41. | Bellevue | 15.4% | 6.6%(+8.76)#41 | 4.8%(+10.6)#663 |
| 42. | Ankeny | 15.1% | 6.6%(+8.47)#42 | 4.8%(+10.3)#691 |
| 43. | Ryan | 15.0% | 6.6%(+8.42)#43 | 4.8%(+10.3)#695 |
| 44. | Woodburn | 15.0% | 6.6%(+8.39)#44 | 4.8%(+10.2)#699 |
| 45. | Toronto | 14.8% | 6.6%(+8.21)#45 | 4.8%(+10.0)#718 |
| 46. | Treynor | 14.7% | 6.6%(+8.12)#46 | 4.8%(+9.95)#728 |
| 47. | Prescott | 14.7% | 6.6%(+8.08)#47 | 4.8%(+9.92)#736 |
| 48. | Arnolds Park | 14.5% | 6.6%(+7.94)#48 | 4.8%(+9.77)#751 |
| 49. | Weldon | 14.3% | 6.6%(+7.68)#49 | 4.8%(+9.52)#785 |
| 50. | Bassett | 14.3% | 6.6%(+7.68)#50 | 4.8%(+9.52)#793 |
| 51. | Huxley | 14.1% | 6.6%(+7.45)#51 | 4.8%(+9.29)#834 |
| 52. | Oakland Acres | 13.9% | 6.6%(+7.26)#52 | 4.8%(+9.09)#854 |
| 53. | Earling | 13.6% | 6.6%(+6.97)#53 | 4.8%(+8.81)#890 |
| 54. | St Marys | 13.5% | 6.6%(+6.91)#54 | 4.8%(+8.75)#907 |
| 55. | Mcclelland | 13.4% | 6.6%(+6.83)#55 | 4.8%(+8.67)#917 |
| 56. | Chester | 13.4% | 6.6%(+6.83)#56 | 4.8%(+8.67)#918 |
| 57. | Terril | 13.2% | 6.6%(+6.58)#57 | 4.8%(+8.42)#963 |
| 58. | Windsor Heights | 13.1% | 6.6%(+6.54)#58 | 4.8%(+8.38)#969 |
| 59. | Pilot Mound | 13.1% | 6.6%(+6.51)#59 | 4.8%(+8.35)#975 |
| 60. | Altoona | 13.0% | 6.6%(+6.44)#60 | 4.8%(+8.28)#985 |
| 61. | Pisgah | 13.0% | 6.6%(+6.44)#61 | 4.8%(+8.28)#988 |
| 62. | Knierim | 13.0% | 6.6%(+6.44)#62 | 4.8%(+8.28)#990 |
| 63. | Grant | 13.0% | 6.6%(+6.44)#63 | 4.8%(+8.28)#992 |
| 64. | Minburn | 13.0% | 6.6%(+6.37)#64 | 4.8%(+8.21)#1,001 |
| 65. | Silver City | 12.9% | 6.6%(+6.25)#65 | 4.8%(+8.09)#1,023 |
| 66. | Ottosen | 12.5% | 6.6%(+5.89)#66 | 4.8%(+7.73)#1,100 |
| 67. | Coppock | 12.5% | 6.6%(+5.89)#67 | 4.8%(+7.73)#1,103 |
| 68. | Odebolt | 12.4% | 6.6%(+5.83)#68 | 4.8%(+7.67)#1,117 |
| 69. | Granger | 12.3% | 6.6%(+5.72)#69 | 4.8%(+7.56)#1,149 |
| 70. | Bondurant | 12.2% | 6.6%(+5.64)#70 | 4.8%(+7.48)#1,160 |
| 71. | Washburn | 12.2% | 6.6%(+5.63)#71 | 4.8%(+7.47)#1,163 |
| 72. | Packwood | 12.0% | 6.6%(+5.44)#72 | 4.8%(+7.28)#1,219 |
| 73. | Asbury | 11.9% | 6.6%(+5.28)#73 | 4.8%(+7.12)#1,266 |
| 74. | Sheldahl | 11.8% | 6.6%(+5.23)#74 | 4.8%(+7.07)#1,282 |
| 75. | Defiance | 11.8% | 6.6%(+5.16)#75 | 4.8%(+7.00)#1,297 |
| 76. | Martelle | 11.7% | 6.6%(+5.11)#76 | 4.8%(+6.94)#1,311 |
| 77. | Pacific Junction | 11.7% | 6.6%(+5.08)#77 | 4.8%(+6.92)#1,315 |
| 78. | Grimes | 11.6% | 6.6%(+4.98)#78 | 4.8%(+6.82)#1,344 |
| 79. | Patterson | 11.5% | 6.6%(+4.93)#79 | 4.8%(+6.77)#1,354 |
| 80. | Unionville | 11.3% | 6.6%(+4.71)#80 | 4.8%(+6.55)#1,425 |
| 81. | Madrid | 11.2% | 6.6%(+4.54)#81 | 4.8%(+6.38)#1,473 |
| 82. | St Charles | 11.1% | 6.6%(+4.53)#82 | 4.8%(+6.36)#1,479 |
| 83. | Modale | 11.1% | 6.6%(+4.50)#83 | 4.8%(+6.34)#1,490 |
| 84. | St Benedict | 11.1% | 6.6%(+4.50)#84 | 4.8%(+6.34)#1,495 |
| 85. | Prairie City | 11.1% | 6.6%(+4.47)#85 | 4.8%(+6.31)#1,509 |
| 86. | Des Moines | 11.0% | 6.6%(+4.37)#86 | 4.8%(+6.21)#1,537 |
| 87. | West Chester | 11.0% | 6.6%(+4.35)#87 | 4.8%(+6.19)#1,544 |
| 88. | Panora | 10.9% | 6.6%(+4.32)#88 | 4.8%(+6.15)#1,555 |
| 89. | Fairfax | 10.9% | 6.6%(+4.31)#89 | 4.8%(+6.15)#1,557 |
| 90. | Shueyville | 10.9% | 6.6%(+4.31)#90 | 4.8%(+6.15)#1,560 |
| 91. | Ledyard | 10.9% | 6.6%(+4.26)#91 | 4.8%(+6.10)#1,577 |
| 92. | Kirkman | 10.8% | 6.6%(+4.20)#92 | 4.8%(+6.04)#1,596 |
| 93. | Dexter | 10.8% | 6.6%(+4.20)#93 | 4.8%(+6.04)#1,597 |
| 94. | Alleman | 10.7% | 6.6%(+4.11)#94 | 4.8%(+5.95)#1,630 |
| 95. | Pleasant Hill | 10.6% | 6.6%(+4.00)#95 | 4.8%(+5.84)#1,663 |
| 96. | Dougherty | 10.5% | 6.6%(+3.92)#96 | 4.8%(+5.76)#1,698 |
| 97. | Valeria | 10.5% | 6.6%(+3.92)#97 | 4.8%(+5.76)#1,702 |
| 98. | Dawson | 10.4% | 6.6%(+3.78)#98 | 4.8%(+5.62)#1,738 |
| 99. | Dallas Center | 10.3% | 6.6%(+3.74)#99 | 4.8%(+5.58)#1,756 |
| 100. | Elk Run Heights | 10.3% | 6.6%(+3.73)#100 | 4.8%(+5.57)#1,766 |
Common Questions
What are the Top 10 Cities with the Highest Percentage of Population Employed in Finance & Insurance in Iowa?
Top 10 Cities with the Highest Percentage of Population Employed in Finance & Insurance in Iowa are:
What city has the Highest Percentage of Population Employed in Finance & Insurance in Iowa?
Leando has the Highest Percentage of Population Employed in Finance & Insurance in Iowa with 100.0%.
What is the Percentage of Population Employed in Finance & Insurance in the State of Iowa?
Percentage of Population Employed in Finance & Insurance in Iowa is 6.6%.
What is the Percentage of Population Employed in Finance & Insurance in the United States?
Percentage of Population Employed in Finance & Insurance in the United States is 4.8%.