Cities with the Highest Percentage of Population Employed in Construction in Iowa
RELATED REPORTS & OPTIONS
Construction
Iowa
Compare Cities
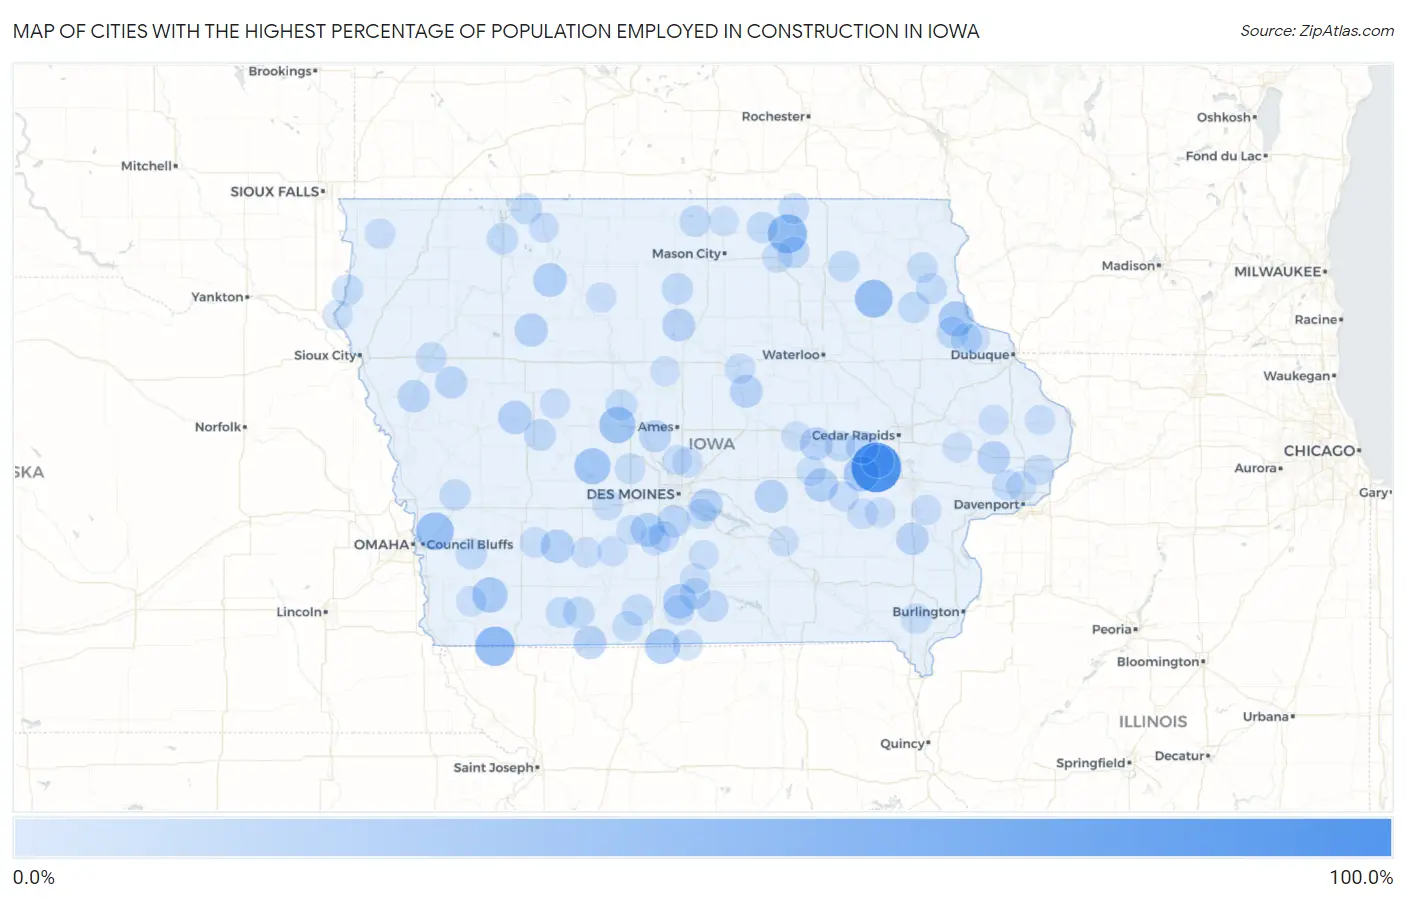
Map of Cities with the Highest Percentage of Population Employed in Construction in Iowa
0.0%
100.0%
Cities with the Highest Percentage of Population Employed in Construction in Iowa
| City | % Employed | vs State | vs National | |
| 1. | Homestead | 100.0% | 6.7%(+93.3)#1 | 6.9%(+93.1)#7 |
| 2. | Blanchard | 55.6% | 6.7%(+48.8)#2 | 6.9%(+48.7)#169 |
| 3. | New Haven | 53.3% | 6.7%(+46.6)#3 | 6.9%(+46.5)#188 |
| 4. | Randalia | 48.3% | 6.7%(+41.5)#4 | 6.9%(+41.4)#236 |
| 5. | Weston | 47.4% | 6.7%(+40.6)#5 | 6.9%(+40.5)#242 |
| 6. | Beaver | 42.9% | 6.7%(+36.1)#6 | 6.9%(+36.0)#305 |
| 7. | Yale | 41.3% | 6.7%(+34.5)#7 | 6.9%(+34.4)#335 |
| 8. | Lowell | 38.6% | 6.7%(+31.9)#8 | 6.9%(+31.8)#391 |
| 9. | Conroy | 38.2% | 6.7%(+31.4)#9 | 6.9%(+31.3)#404 |
| 10. | Pleasanton | 37.5% | 6.7%(+30.8)#10 | 6.9%(+30.6)#427 |
| 11. | Coburg | 37.5% | 6.7%(+30.8)#11 | 6.9%(+30.6)#430 |
| 12. | Osterdock | 37.1% | 6.7%(+30.4)#12 | 6.9%(+30.3)#445 |
| 13. | Le Roy | 33.3% | 6.7%(+26.6)#13 | 6.9%(+26.5)#590 |
| 14. | Patterson | 31.9% | 6.7%(+25.1)#14 | 6.9%(+25.0)#646 |
| 15. | Curlew | 31.2% | 6.7%(+24.5)#15 | 6.9%(+24.4)#680 |
| 16. | Arcadia | 30.8% | 6.7%(+24.0)#16 | 6.9%(+23.9)#700 |
| 17. | Guernsey | 30.6% | 6.7%(+23.8)#17 | 6.9%(+23.7)#713 |
| 18. | Bridgewater | 30.4% | 6.7%(+23.7)#18 | 6.9%(+23.6)#720 |
| 19. | Varina | 29.4% | 6.7%(+22.7)#19 | 6.9%(+22.5)#782 |
| 20. | East Amana | 29.0% | 6.7%(+22.3)#20 | 6.9%(+22.2)#804 |
| 21. | Redding | 28.6% | 6.7%(+21.8)#21 | 6.9%(+21.7)#831 |
| 22. | Lynnville | 28.4% | 6.7%(+21.7)#22 | 6.9%(+21.6)#849 |
| 23. | Chelsea | 28.0% | 6.7%(+21.3)#23 | 6.9%(+21.2)#881 |
| 24. | Whitten | 27.9% | 6.7%(+21.2)#24 | 6.9%(+21.1)#888 |
| 25. | Watkins | 27.3% | 6.7%(+20.5)#25 | 6.9%(+20.4)#943 |
| 26. | Galt | 27.3% | 6.7%(+20.5)#26 | 6.9%(+20.4)#947 |
| 27. | Wheatland | 27.2% | 6.7%(+20.5)#27 | 6.9%(+20.4)#951 |
| 28. | Ainsworth | 27.2% | 6.7%(+20.4)#28 | 6.9%(+20.3)#957 |
| 29. | Runnells | 26.9% | 6.7%(+20.2)#29 | 6.9%(+20.0)#978 |
| 30. | Smithland | 26.7% | 6.7%(+20.0)#30 | 6.9%(+19.9)#993 |
| 31. | Spring Hill | 26.1% | 6.7%(+19.4)#31 | 6.9%(+19.2)#1,040 |
| 32. | Battle Creek | 25.2% | 6.7%(+18.5)#32 | 6.9%(+18.4)#1,101 |
| 33. | Luther | 24.7% | 6.7%(+18.0)#33 | 6.9%(+17.8)#1,162 |
| 34. | Willey | 23.9% | 6.7%(+17.1)#34 | 6.9%(+17.0)#1,257 |
| 35. | Colesburg | 23.8% | 6.7%(+17.0)#35 | 6.9%(+16.9)#1,273 |
| 36. | Colwell | 22.9% | 6.7%(+16.1)#36 | 6.9%(+16.0)#1,411 |
| 37. | Millerton | 22.7% | 6.7%(+16.0)#37 | 6.9%(+15.9)#1,439 |
| 38. | Goodell | 22.7% | 6.7%(+15.9)#38 | 6.9%(+15.8)#1,441 |
| 39. | Fostoria | 22.6% | 6.7%(+15.9)#39 | 6.9%(+15.7)#1,454 |
| 40. | Macedonia | 22.4% | 6.7%(+15.7)#40 | 6.9%(+15.6)#1,478 |
| 41. | Luxemburg | 22.0% | 6.7%(+15.3)#41 | 6.9%(+15.1)#1,541 |
| 42. | Volga | 21.8% | 6.7%(+15.1)#42 | 6.9%(+14.9)#1,570 |
| 43. | Clearfield | 21.8% | 6.7%(+15.1)#43 | 6.9%(+14.9)#1,575 |
| 44. | Grand River | 21.7% | 6.7%(+15.0)#44 | 6.9%(+14.9)#1,585 |
| 45. | Joice | 21.6% | 6.7%(+14.9)#45 | 6.9%(+14.7)#1,607 |
| 46. | Chatsworth | 21.6% | 6.7%(+14.9)#46 | 6.9%(+14.7)#1,609 |
| 47. | Persia | 21.5% | 6.7%(+14.7)#47 | 6.9%(+14.6)#1,629 |
| 48. | Lawler | 21.4% | 6.7%(+14.7)#48 | 6.9%(+14.5)#1,645 |
| 49. | Mitchell | 21.3% | 6.7%(+14.5)#49 | 6.9%(+14.4)#1,658 |
| 50. | Sharpsburg | 21.2% | 6.7%(+14.5)#50 | 6.9%(+14.3)#1,668 |
| 51. | Superior | 21.1% | 6.7%(+14.3)#51 | 6.9%(+14.2)#1,694 |
| 52. | St Olaf | 20.6% | 6.7%(+13.9)#52 | 6.9%(+13.8)#1,771 |
| 53. | Derby | 20.5% | 6.7%(+13.7)#53 | 6.9%(+13.6)#1,799 |
| 54. | Correctionville | 20.1% | 6.7%(+13.3)#54 | 6.9%(+13.2)#1,871 |
| 55. | Maysville | 20.0% | 6.7%(+13.3)#55 | 6.9%(+13.1)#1,889 |
| 56. | Boxholm | 20.0% | 6.7%(+13.3)#56 | 6.9%(+13.1)#1,890 |
| 57. | Cumberland | 19.8% | 6.7%(+13.1)#57 | 6.9%(+13.0)#1,934 |
| 58. | Minburn | 19.7% | 6.7%(+13.0)#58 | 6.9%(+12.8)#1,965 |
| 59. | Mcintire | 19.5% | 6.7%(+12.8)#59 | 6.9%(+12.6)#2,011 |
| 60. | St Paul | 19.5% | 6.7%(+12.8)#60 | 6.9%(+12.6)#2,013 |
| 61. | Kinross | 19.4% | 6.7%(+12.6)#61 | 6.9%(+12.5)#2,055 |
| 62. | Dexter | 19.1% | 6.7%(+12.4)#62 | 6.9%(+12.2)#2,114 |
| 63. | Mccausland | 19.1% | 6.7%(+12.4)#63 | 6.9%(+12.2)#2,116 |
| 64. | St Charles | 18.9% | 6.7%(+12.2)#64 | 6.9%(+12.0)#2,155 |
| 65. | St Marys | 18.9% | 6.7%(+12.2)#65 | 6.9%(+12.0)#2,163 |
| 66. | Fairport | 18.9% | 6.7%(+12.1)#66 | 6.9%(+12.0)#2,175 |
| 67. | Garden Grove | 18.8% | 6.7%(+12.1)#67 | 6.9%(+11.9)#2,194 |
| 68. | Hartford | 18.8% | 6.7%(+12.1)#68 | 6.9%(+11.9)#2,206 |
| 69. | Lineville | 18.8% | 6.7%(+12.0)#69 | 6.9%(+11.9)#2,215 |
| 70. | Kellerton | 18.6% | 6.7%(+11.9)#70 | 6.9%(+11.7)#2,242 |
| 71. | Luzerne | 18.6% | 6.7%(+11.8)#71 | 6.9%(+11.7)#2,253 |
| 72. | Floyd | 18.5% | 6.7%(+11.8)#72 | 6.9%(+11.6)#2,272 |
| 73. | Luana | 18.5% | 6.7%(+11.8)#73 | 6.9%(+11.6)#2,273 |
| 74. | Lone Tree | 18.4% | 6.7%(+11.7)#74 | 6.9%(+11.5)#2,299 |
| 75. | Elkhart | 18.3% | 6.7%(+11.6)#75 | 6.9%(+11.5)#2,316 |
| 76. | Orient | 18.3% | 6.7%(+11.5)#76 | 6.9%(+11.4)#2,334 |
| 77. | Steamboat Rock | 18.3% | 6.7%(+11.5)#77 | 6.9%(+11.4)#2,338 |
| 78. | Doon | 18.2% | 6.7%(+11.4)#78 | 6.9%(+11.3)#2,362 |
| 79. | Lucas | 18.2% | 6.7%(+11.4)#79 | 6.9%(+11.3)#2,375 |
| 80. | Macksburg | 18.2% | 6.7%(+11.4)#80 | 6.9%(+11.3)#2,378 |
| 81. | Lanesboro | 18.2% | 6.7%(+11.4)#81 | 6.9%(+11.3)#2,383 |
| 82. | Imogene | 18.2% | 6.7%(+11.4)#82 | 6.9%(+11.3)#2,386 |
| 83. | Spragueville | 17.9% | 6.7%(+11.2)#83 | 6.9%(+11.1)#2,449 |
| 84. | Baldwin | 17.9% | 6.7%(+11.1)#84 | 6.9%(+11.0)#2,468 |
| 85. | Wellman | 17.7% | 6.7%(+11.0)#85 | 6.9%(+10.8)#2,516 |
| 86. | Millersburg | 17.6% | 6.7%(+10.9)#86 | 6.9%(+10.8)#2,543 |
| 87. | Eldridge | 17.5% | 6.7%(+10.7)#87 | 6.9%(+10.6)#2,596 |
| 88. | Westfield | 17.4% | 6.7%(+10.7)#88 | 6.9%(+10.5)#2,619 |
| 89. | Wallingford | 17.3% | 6.7%(+10.5)#89 | 6.9%(+10.4)#2,643 |
| 90. | Bode | 17.1% | 6.7%(+10.3)#90 | 6.9%(+10.2)#2,712 |
| 91. | Brooklyn | 16.7% | 6.7%(+9.97)#91 | 6.9%(+9.83)#2,851 |
| 92. | Beacon | 16.7% | 6.7%(+9.93)#92 | 6.9%(+9.79)#2,866 |
| 93. | Lacona | 16.7% | 6.7%(+9.93)#93 | 6.9%(+9.79)#2,871 |
| 94. | Kamrar | 16.7% | 6.7%(+9.93)#94 | 6.9%(+9.79)#2,885 |
| 95. | Winterset | 16.6% | 6.7%(+9.85)#95 | 6.9%(+9.71)#2,928 |
| 96. | Stanwood | 16.5% | 6.7%(+9.81)#96 | 6.9%(+9.67)#2,936 |
| 97. | Kensett | 16.5% | 6.7%(+9.80)#97 | 6.9%(+9.66)#2,943 |
| 98. | Alleman | 16.5% | 6.7%(+9.78)#98 | 6.9%(+9.64)#2,947 |
| 99. | Tama | 16.5% | 6.7%(+9.78)#99 | 6.9%(+9.63)#2,950 |
| 100. | Holy Cross | 16.4% | 6.7%(+9.63)#100 | 6.9%(+9.49)#3,005 |
Common Questions
What are the Top 10 Cities with the Highest Percentage of Population Employed in Construction in Iowa?
Top 10 Cities with the Highest Percentage of Population Employed in Construction in Iowa are:
What city has the Highest Percentage of Population Employed in Construction in Iowa?
Homestead has the Highest Percentage of Population Employed in Construction in Iowa with 100.0%.
What is the Percentage of Population Employed in Construction in the State of Iowa?
Percentage of Population Employed in Construction in Iowa is 6.7%.
What is the Percentage of Population Employed in Construction in the United States?
Percentage of Population Employed in Construction in the United States is 6.9%.