Cities with the Highest Percentage of Population Employed in Arts, Entertainment & Recreation in Hawaii
RELATED REPORTS & OPTIONS
Arts, Entertainment & Recreation
Hawaii
Compare Cities
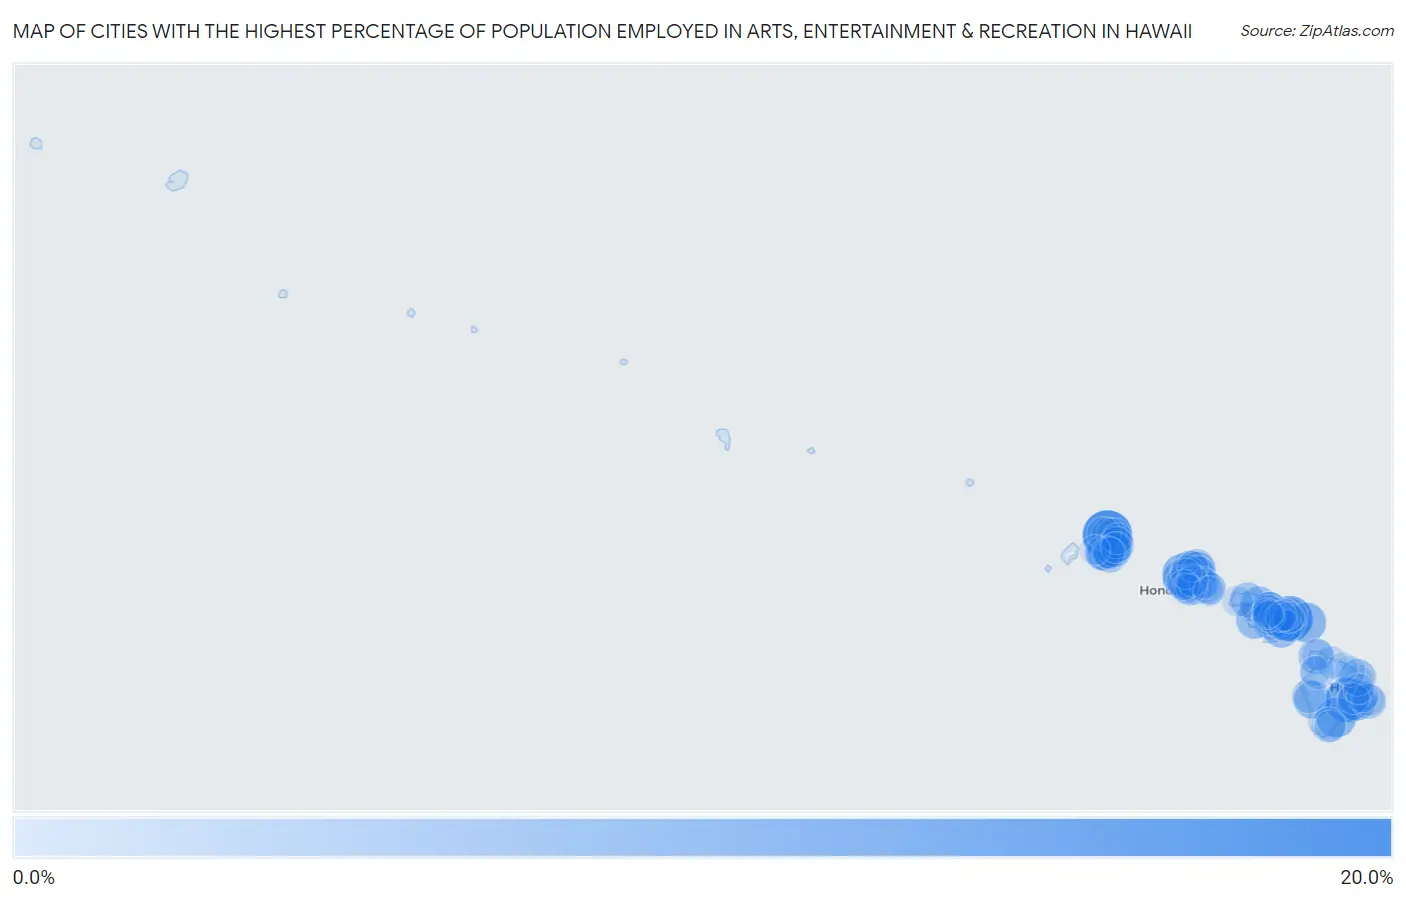
Map of Cities with the Highest Percentage of Population Employed in Arts, Entertainment & Recreation in Hawaii
0.0%
20.0%
Cities with the Highest Percentage of Population Employed in Arts, Entertainment & Recreation in Hawaii
| City | % Employed | vs State | vs National | |
| 1. | Hanalei | 15.7% | 2.5%(+13.2)#1 | 2.1%(+13.6)#429 |
| 2. | Olinda | 12.7% | 2.5%(+10.2)#2 | 2.1%(+10.7)#609 |
| 3. | Volcano | 11.9% | 2.5%(+9.36)#3 | 2.1%(+9.78)#683 |
| 4. | Kaloko | 9.2% | 2.5%(+6.67)#4 | 2.1%(+7.10)#1,043 |
| 5. | Mokuleia | 8.9% | 2.5%(+6.41)#5 | 2.1%(+6.84)#1,082 |
| 6. | Pahala | 8.8% | 2.5%(+6.27)#6 | 2.1%(+6.69)#1,115 |
| 7. | Hana | 8.6% | 2.5%(+6.10)#7 | 2.1%(+6.52)#1,154 |
| 8. | Makaha Valley | 8.3% | 2.5%(+5.83)#8 | 2.1%(+6.25)#1,216 |
| 9. | Fern Forest | 7.9% | 2.5%(+5.35)#9 | 2.1%(+5.77)#1,336 |
| 10. | Olowalu | 7.8% | 2.5%(+5.34)#10 | 2.1%(+5.76)#1,340 |
| 11. | Lanai City | 7.3% | 2.5%(+4.81)#11 | 2.1%(+5.24)#1,503 |
| 12. | Captain Cook | 7.2% | 2.5%(+4.72)#12 | 2.1%(+5.15)#1,527 |
| 13. | Wailea | 7.1% | 2.5%(+4.63)#13 | 2.1%(+5.06)#1,557 |
| 14. | Kaiminani | 7.0% | 2.5%(+4.54)#14 | 2.1%(+4.96)#1,578 |
| 15. | Ualapue | 6.9% | 2.5%(+4.37)#15 | 2.1%(+4.80)#1,635 |
| 16. | Honomu | 6.7% | 2.5%(+4.19)#16 | 2.1%(+4.62)#1,687 |
| 17. | Kalaheo | 6.6% | 2.5%(+4.04)#17 | 2.1%(+4.47)#1,746 |
| 18. | Wailua Homesteads | 6.5% | 2.5%(+3.99)#18 | 2.1%(+4.41)#1,772 |
| 19. | Pupukea | 6.4% | 2.5%(+3.94)#19 | 2.1%(+4.37)#1,800 |
| 20. | Kahuku | 6.4% | 2.5%(+3.87)#20 | 2.1%(+4.30)#1,828 |
| 21. | Waikoloa Beach Resort | 6.4% | 2.5%(+3.86)#21 | 2.1%(+4.28)#1,831 |
| 22. | Napili Honokowai | 6.3% | 2.5%(+3.84)#22 | 2.1%(+4.26)#1,840 |
| 23. | Kula | 6.3% | 2.5%(+3.83)#23 | 2.1%(+4.26)#1,841 |
| 24. | Laie | 6.3% | 2.5%(+3.82)#24 | 2.1%(+4.24)#1,851 |
| 25. | Launiupoko | 5.7% | 2.5%(+3.21)#25 | 2.1%(+3.63)#2,136 |
| 26. | Hawi | 5.7% | 2.5%(+3.20)#26 | 2.1%(+3.63)#2,141 |
| 27. | Poipu | 5.5% | 2.5%(+3.02)#27 | 2.1%(+3.44)#2,258 |
| 28. | Waikapu | 5.4% | 2.5%(+2.91)#28 | 2.1%(+3.34)#2,314 |
| 29. | Kualapuu | 5.4% | 2.5%(+2.89)#29 | 2.1%(+3.32)#2,330 |
| 30. | Wailua | 5.3% | 2.5%(+2.75)#30 | 2.1%(+3.18)#2,413 |
| 31. | Leilani Estates | 5.2% | 2.5%(+2.72)#31 | 2.1%(+3.14)#2,434 |
| 32. | Waiohinu | 5.2% | 2.5%(+2.69)#32 | 2.1%(+3.11)#2,459 |
| 33. | Wailuku | 5.1% | 2.5%(+2.57)#33 | 2.1%(+2.99)#2,547 |
| 34. | Kailua Cdp Hawaii County | 4.9% | 2.5%(+2.42)#34 | 2.1%(+2.85)#2,660 |
| 35. | Princeville | 4.9% | 2.5%(+2.42)#35 | 2.1%(+2.85)#2,661 |
| 36. | Hanapepe | 4.8% | 2.5%(+2.33)#36 | 2.1%(+2.75)#2,727 |
| 37. | Punaluu | 4.8% | 2.5%(+2.29)#37 | 2.1%(+2.71)#2,759 |
| 38. | Lihue | 4.8% | 2.5%(+2.25)#38 | 2.1%(+2.68)#2,793 |
| 39. | Haiku Pauwela | 4.7% | 2.5%(+2.24)#39 | 2.1%(+2.66)#2,803 |
| 40. | Eleele | 4.6% | 2.5%(+2.06)#40 | 2.1%(+2.49)#2,945 |
| 41. | Wheeler Afb | 4.5% | 2.5%(+2.01)#41 | 2.1%(+2.43)#3,017 |
| 42. | Puhi | 4.5% | 2.5%(+1.95)#42 | 2.1%(+2.38)#3,079 |
| 43. | Kahaluu Keauhou | 4.5% | 2.5%(+1.95)#43 | 2.1%(+2.38)#3,085 |
| 44. | Haleiwa | 4.5% | 2.5%(+1.95)#44 | 2.1%(+2.37)#3,086 |
| 45. | Kapalua | 4.4% | 2.5%(+1.91)#45 | 2.1%(+2.34)#3,132 |
| 46. | Kilauea | 4.4% | 2.5%(+1.89)#46 | 2.1%(+2.32)#3,153 |
| 47. | Waikoloa Village | 4.3% | 2.5%(+1.79)#47 | 2.1%(+2.22)#3,269 |
| 48. | Haena | 4.2% | 2.5%(+1.73)#48 | 2.1%(+2.16)#3,340 |
| 49. | Maalaea | 3.9% | 2.5%(+1.39)#49 | 2.1%(+1.81)#3,768 |
| 50. | Kihei | 3.7% | 2.5%(+1.24)#50 | 2.1%(+1.67)#3,982 |
| 51. | Lawai | 3.7% | 2.5%(+1.24)#51 | 2.1%(+1.66)#3,991 |
| 52. | Maili | 3.6% | 2.5%(+1.13)#52 | 2.1%(+1.55)#4,167 |
| 53. | Kukuihaele | 3.5% | 2.5%(+1.01)#53 | 2.1%(+1.44)#4,358 |
| 54. | Waimea Cdp Hawaii County | 3.5% | 2.5%(+1.00)#54 | 2.1%(+1.43)#4,379 |
| 55. | Royal Kunia | 3.5% | 2.5%(+0.959)#55 | 2.1%(+1.38)#4,454 |
| 56. | Waimanalo | 3.5% | 2.5%(+0.958)#56 | 2.1%(+1.38)#4,456 |
| 57. | Mahinahina | 3.4% | 2.5%(+0.888)#57 | 2.1%(+1.31)#4,598 |
| 58. | Maunawili | 3.4% | 2.5%(+0.881)#58 | 2.1%(+1.31)#4,616 |
| 59. | Waianae | 3.4% | 2.5%(+0.864)#59 | 2.1%(+1.29)#4,640 |
| 60. | Ahuimanu | 3.4% | 2.5%(+0.863)#60 | 2.1%(+1.29)#4,641 |
| 61. | Nanawale Estates | 3.3% | 2.5%(+0.789)#61 | 2.1%(+1.21)#4,787 |
| 62. | Hickam Housing | 3.2% | 2.5%(+0.742)#62 | 2.1%(+1.17)#4,880 |
| 63. | Waimanalo Beach | 3.2% | 2.5%(+0.726)#63 | 2.1%(+1.15)#4,901 |
| 64. | Keokea | 3.2% | 2.5%(+0.647)#64 | 2.1%(+1.07)#5,051 |
| 65. | Orchidlands Estates | 3.1% | 2.5%(+0.622)#65 | 2.1%(+1.05)#5,108 |
| 66. | Koloa | 3.0% | 2.5%(+0.514)#66 | 2.1%(+0.939)#5,351 |
| 67. | Paia | 3.0% | 2.5%(+0.513)#67 | 2.1%(+0.938)#5,353 |
| 68. | West Loch Estate | 3.0% | 2.5%(+0.502)#68 | 2.1%(+0.927)#5,373 |
| 69. | Kapaa | 3.0% | 2.5%(+0.460)#69 | 2.1%(+0.885)#5,466 |
| 70. | Kailua Cdp Honolulu County | 2.9% | 2.5%(+0.440)#70 | 2.1%(+0.865)#5,516 |
| 71. | Omao | 2.9% | 2.5%(+0.389)#71 | 2.1%(+0.814)#5,635 |
| 72. | Kapaau | 2.9% | 2.5%(+0.374)#72 | 2.1%(+0.799)#5,674 |
| 73. | Naalehu | 2.8% | 2.5%(+0.340)#73 | 2.1%(+0.764)#5,784 |
| 74. | Hauula | 2.8% | 2.5%(+0.316)#74 | 2.1%(+0.741)#5,841 |
| 75. | Pepeekeo | 2.8% | 2.5%(+0.309)#75 | 2.1%(+0.734)#5,859 |
| 76. | Waipio Acres | 2.6% | 2.5%(+0.088)#76 | 2.1%(+0.513)#6,492 |
| 77. | Ocean Pointe | 2.6% | 2.5%(+0.080)#77 | 2.1%(+0.505)#6,513 |
| 78. | Makawao | 2.6% | 2.5%(+0.071)#78 | 2.1%(+0.496)#6,549 |
| 79. | Lahaina | 2.5% | 2.5%(+0.039)#79 | 2.1%(+0.464)#6,657 |
| 80. | Kalaeloa | 2.5% | 2.5%(+0.028)#80 | 2.1%(+0.453)#6,689 |
| 81. | Laupahoehoe | 2.5% | 2.5%(+0.024)#81 | 2.1%(+0.449)#6,708 |
| 82. | Anahola | 2.5% | 2.5%(+0.008)#82 | 2.1%(+0.433)#6,772 |
| 83. | Hanamaulu | 2.5% | 2.5%(-0.017)#83 | 2.1%(+0.408)#6,857 |
| 84. | Mountain View | 2.4% | 2.5%(-0.078)#84 | 2.1%(+0.347)#7,068 |
| 85. | Maunaloa | 2.4% | 2.5%(-0.088)#85 | 2.1%(+0.337)#7,106 |
| 86. | Kaneohe Base | 2.4% | 2.5%(-0.106)#86 | 2.1%(+0.319)#7,153 |
| 87. | Puako | 2.4% | 2.5%(-0.154)#87 | 2.1%(+0.270)#7,324 |
| 88. | Helemano | 2.3% | 2.5%(-0.164)#88 | 2.1%(+0.261)#7,346 |
| 89. | Mililani Town | 2.3% | 2.5%(-0.188)#89 | 2.1%(+0.237)#7,424 |
| 90. | Kahului | 2.3% | 2.5%(-0.190)#90 | 2.1%(+0.235)#7,429 |
| 91. | Kaneohe | 2.3% | 2.5%(-0.226)#91 | 2.1%(+0.198)#7,567 |
| 92. | Kawela Bay | 2.3% | 2.5%(-0.235)#92 | 2.1%(+0.190)#7,594 |
| 93. | Kaanapali | 2.2% | 2.5%(-0.279)#93 | 2.1%(+0.146)#7,762 |
| 94. | Waialua | 2.2% | 2.5%(-0.338)#94 | 2.1%(+0.087)#7,995 |
| 95. | Hilo | 2.1% | 2.5%(-0.374)#95 | 2.1%(+0.051)#8,142 |
| 96. | Ko Olina | 2.1% | 2.5%(-0.383)#96 | 2.1%(+0.042)#8,184 |
| 97. | Nanakuli | 2.1% | 2.5%(-0.447)#97 | 2.1%(-0.022)#8,459 |
| 98. | Paauilo | 2.0% | 2.5%(-0.475)#98 | 2.1%(-0.050)#8,572 |
| 99. | East Honolulu | 2.0% | 2.5%(-0.500)#99 | 2.1%(-0.076)#8,670 |
| 100. | Kekaha | 2.0% | 2.5%(-0.547)#100 | 2.1%(-0.122)#8,870 |
1
2Common Questions
What are the Top 10 Cities with the Highest Percentage of Population Employed in Arts, Entertainment & Recreation in Hawaii?
Top 10 Cities with the Highest Percentage of Population Employed in Arts, Entertainment & Recreation in Hawaii are:
#1
15.7%
#2
12.7%
#3
11.9%
#4
8.9%
#5
8.8%
#6
8.6%
#7
8.3%
#8
7.9%
#9
7.8%
#10
7.3%
What city has the Highest Percentage of Population Employed in Arts, Entertainment & Recreation in Hawaii?
Hanalei has the Highest Percentage of Population Employed in Arts, Entertainment & Recreation in Hawaii with 15.7%.
What is the Percentage of Population Employed in Arts, Entertainment & Recreation in the State of Hawaii?
Percentage of Population Employed in Arts, Entertainment & Recreation in Hawaii is 2.5%.
What is the Percentage of Population Employed in Arts, Entertainment & Recreation in the United States?
Percentage of Population Employed in Arts, Entertainment & Recreation in the United States is 2.1%.