Zip Codes with the Highest Percentage of Population Employed in Professional & Scientific Services in Warner Robins, GA
RELATED REPORTS & OPTIONS
Professional & Scientific Services
Warner Robins
Compare Zip Codes
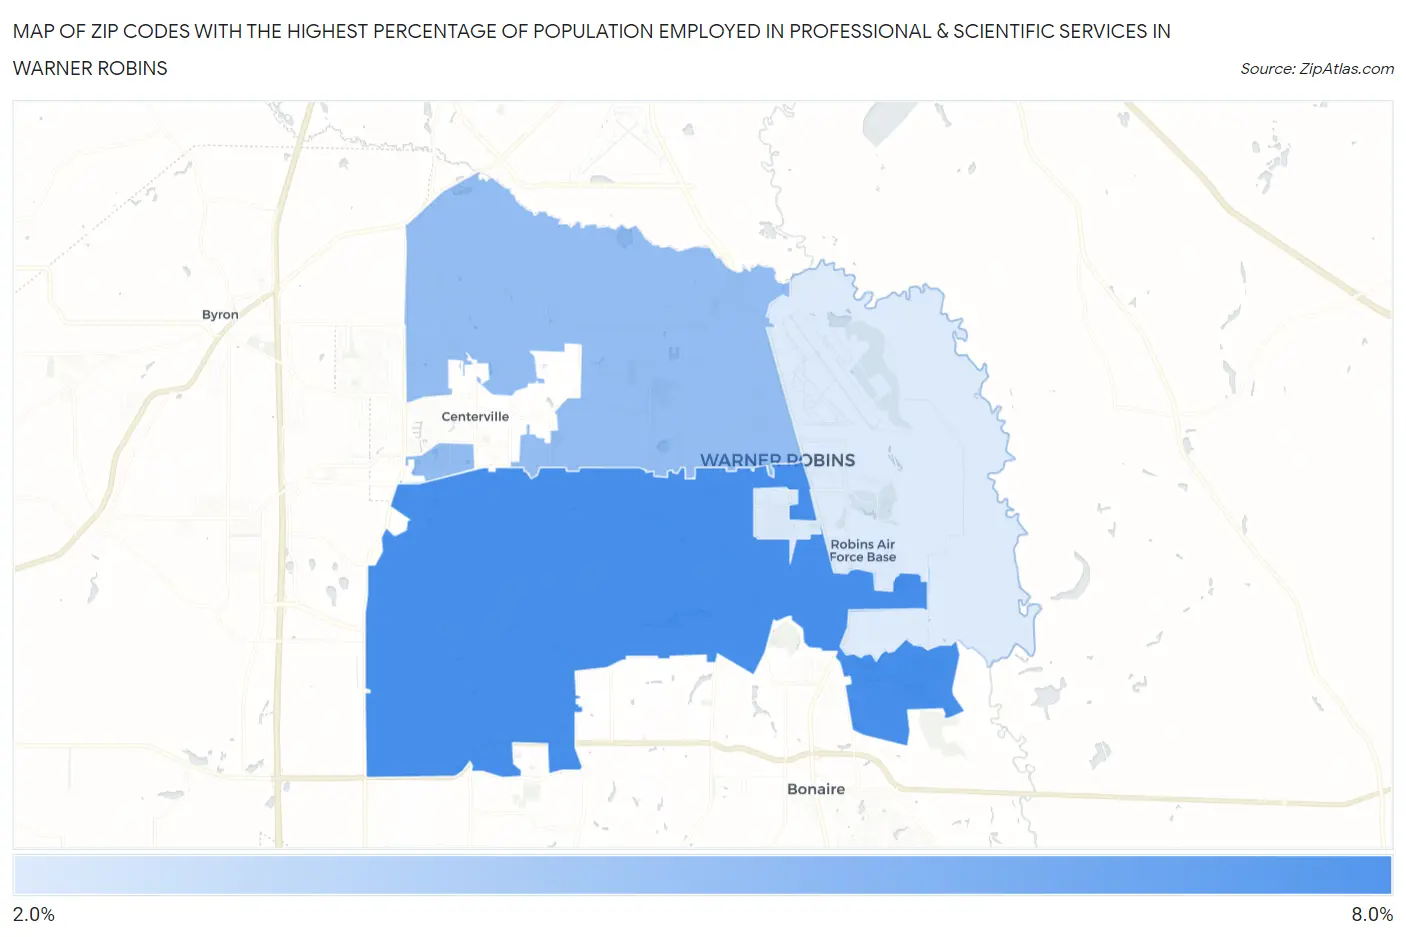
Map of Zip Codes with the Highest Percentage of Population Employed in Professional & Scientific Services in Warner Robins
2.9%
6.8%
Zip Codes with the Highest Percentage of Population Employed in Professional & Scientific Services in Warner Robins, GA
| Zip Code | % Employed | vs State | vs National | |
| 1. | 31088 | 6.8% | 8.2%(-1.38)#165 | 7.8%(-1.01)#8,430 |
| 2. | 31093 | 4.8% | 8.2%(-3.43)#288 | 7.8%(-3.06)#12,854 |
| 3. | 31098 | 2.9% | 8.2%(-5.34)#434 | 7.8%(-4.97)#18,886 |
1
Common Questions
What are the Top Zip Codes with the Highest Percentage of Population Employed in Professional & Scientific Services in Warner Robins, GA?
Top Zip Codes with the Highest Percentage of Population Employed in Professional & Scientific Services in Warner Robins, GA are:
What zip code has the Highest Percentage of Population Employed in Professional & Scientific Services in Warner Robins, GA?
31088 has the Highest Percentage of Population Employed in Professional & Scientific Services in Warner Robins, GA with 6.8%.
What is the Percentage of Population Employed in Professional & Scientific Services in Warner Robins, GA?
Percentage of Population Employed in Professional & Scientific Services in Warner Robins is 6.7%.
What is the Percentage of Population Employed in Professional & Scientific Services in Georgia?
Percentage of Population Employed in Professional & Scientific Services in Georgia is 8.2%.
What is the Percentage of Population Employed in Professional & Scientific Services in the United States?
Percentage of Population Employed in Professional & Scientific Services in the United States is 7.8%.