Zip Codes with the Highest Percentage of Population Employed in Arts, Entertainment & Recreation in Stone Mountain, GA
RELATED REPORTS & OPTIONS
Arts, Entertainment & Recreation
Stone Mountain
Compare Zip Codes
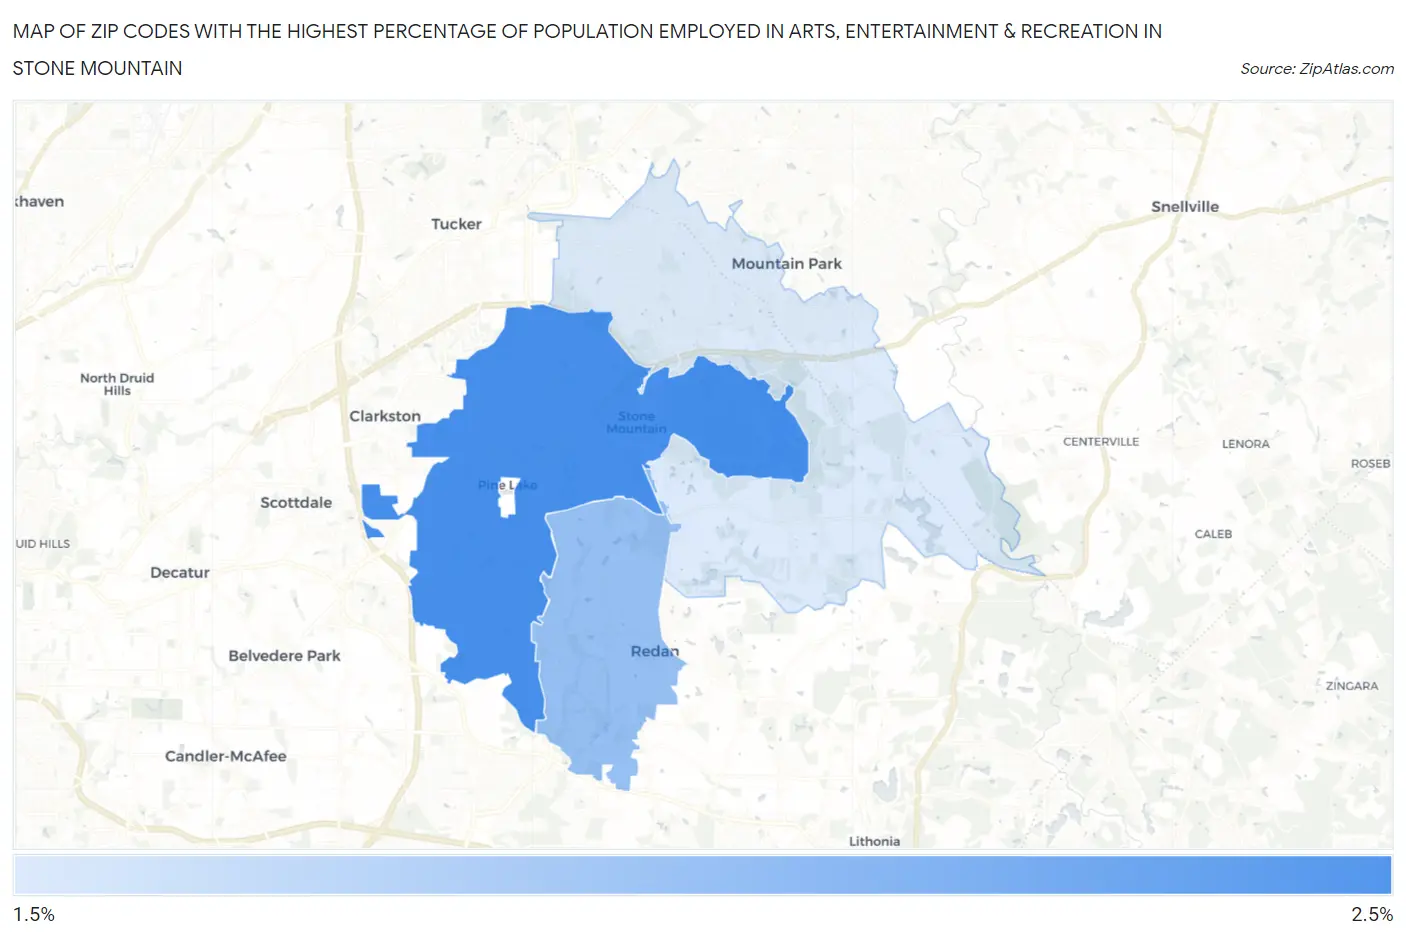
Map of Zip Codes with the Highest Percentage of Population Employed in Arts, Entertainment & Recreation in Stone Mountain
0.0%
2.5%
Zip Codes with the Highest Percentage of Population Employed in Arts, Entertainment & Recreation in Stone Mountain, GA
| Zip Code | % Employed | vs State | vs National | |
| 1. | 30083 | 2.1% | 1.6%(+0.527)#134 | 2.1%(+0.065)#8,946 |
| 2. | 30088 | 1.8% | 1.6%(+0.200)#179 | 2.1%(-0.262)#10,871 |
| 3. | 30087 | 1.5% | 1.6%(-0.099)#234 | 2.1%(-0.561)#13,102 |
1
Common Questions
What are the Top Zip Codes with the Highest Percentage of Population Employed in Arts, Entertainment & Recreation in Stone Mountain, GA?
Top Zip Codes with the Highest Percentage of Population Employed in Arts, Entertainment & Recreation in Stone Mountain, GA are:
What zip code has the Highest Percentage of Population Employed in Arts, Entertainment & Recreation in Stone Mountain, GA?
30083 has the Highest Percentage of Population Employed in Arts, Entertainment & Recreation in Stone Mountain, GA with 2.1%.
What is the Percentage of Population Employed in Arts, Entertainment & Recreation in Stone Mountain, GA?
Percentage of Population Employed in Arts, Entertainment & Recreation in Stone Mountain is 2.1%.
What is the Percentage of Population Employed in Arts, Entertainment & Recreation in Georgia?
Percentage of Population Employed in Arts, Entertainment & Recreation in Georgia is 1.6%.
What is the Percentage of Population Employed in Arts, Entertainment & Recreation in the United States?
Percentage of Population Employed in Arts, Entertainment & Recreation in the United States is 2.1%.