Zip Codes with the Highest Percentage of Population Employed in Farming, Fishing & Forestry in Decatur, GA

RELATED REPORTS & OPTIONS

Farming, Fishing & Forestry
Population
Families and Households
Female Fertility
Female Fertility (Unmarried)
Race (Community Size)
Race (Percentage)
Ancestry (Community Size)
AfricanAmericanArabArgentineanArmenianAustrianBahamianBarbadianBhutaneseBlackfeetBrazilianBritishBritish West IndianBurmeseCajunCanadianCape VerdeanCentral AmericanCherokeeChileanChoctawColombianCosta RicanCreekCroatianCubanCzechCzechoslovakianDanishDominicanDutchEastern EuropeanEcuadorianEgyptianEnglishEthiopianEuropeanFilipinoFinnishFrenchFrench CanadianGermanGhanaianGreekGuatemalanGuyaneseHaitianHonduranHungarianIcelanderIndian (Asian)IraqiIrishIsraeliItalianJamaicanJapaneseKoreanLaotianLatvianLebaneseLiberianLithuanianMalaysianMexicanMexican American IndianMongolianMoroccanNative HawaiianNicaraguanNigerianNorthern EuropeanNorwegianPakistaniPalestinianPanamanianPeruvianPolishPortuguesePuerto RicanRomanianRussianSalvadoranScandinavianScotch-IrishScottishSierra LeoneanSiouxSlovakSomaliSouth AmericanSpaniardSpanishSri LankanSubsaharan AfricanSwedishSwissSyrianThaiTrinidadian and TobagonianTurkishUkrainianUruguayanVenezuelanVietnameseWelshWest IndianYugoslavian
Ancestry (Percentage)
AfricanAmericanArabArgentineanArmenianAustrianBahamianBarbadianBhutaneseBlackfeetBrazilianBritishBritish West IndianBurmeseCajunCanadianCape VerdeanCentral AmericanCherokeeChileanChoctawColombianCosta RicanCreekCroatianCubanCzechCzechoslovakianDanishDominicanDutchEastern EuropeanEcuadorianEgyptianEnglishEthiopianEuropeanFilipinoFinnishFrenchFrench CanadianGermanGhanaianGreekGuatemalanGuyaneseHaitianHonduranHungarianIcelanderIndian (Asian)IraqiIrishIsraeliItalianJamaicanJapaneseKoreanLaotianLatvianLebaneseLiberianLithuanianMalaysianMexicanMexican American IndianMongolianMoroccanNative HawaiianNicaraguanNigerianNorthern EuropeanNorwegianPakistaniPalestinianPanamanianPeruvianPolishPortuguesePuerto RicanRomanianRussianSalvadoranScandinavianScotch-IrishScottishSierra LeoneanSiouxSlovakSomaliSouth AmericanSpaniardSpanishSri LankanSubsaharan AfricanSwedishSwissSyrianThaiTrinidadian and TobagonianTurkishUkrainianUruguayanVenezuelanVietnameseWelshWest IndianYugoslavian
Immigrant Origin (Total)
Immigrant Origin (Percentage)
Income
Income (Families)
Income (Households)
Poverty
Poverty (Families)
Unemployment
Employment Occupations
Employment Industries
Employer Class
Commute Time
Commute Means
School Enrollment
Education by Degree Field
Occupancy
Finances
Physical Characteristics
Decatur
Compare Zip Codes
Comparison Subject

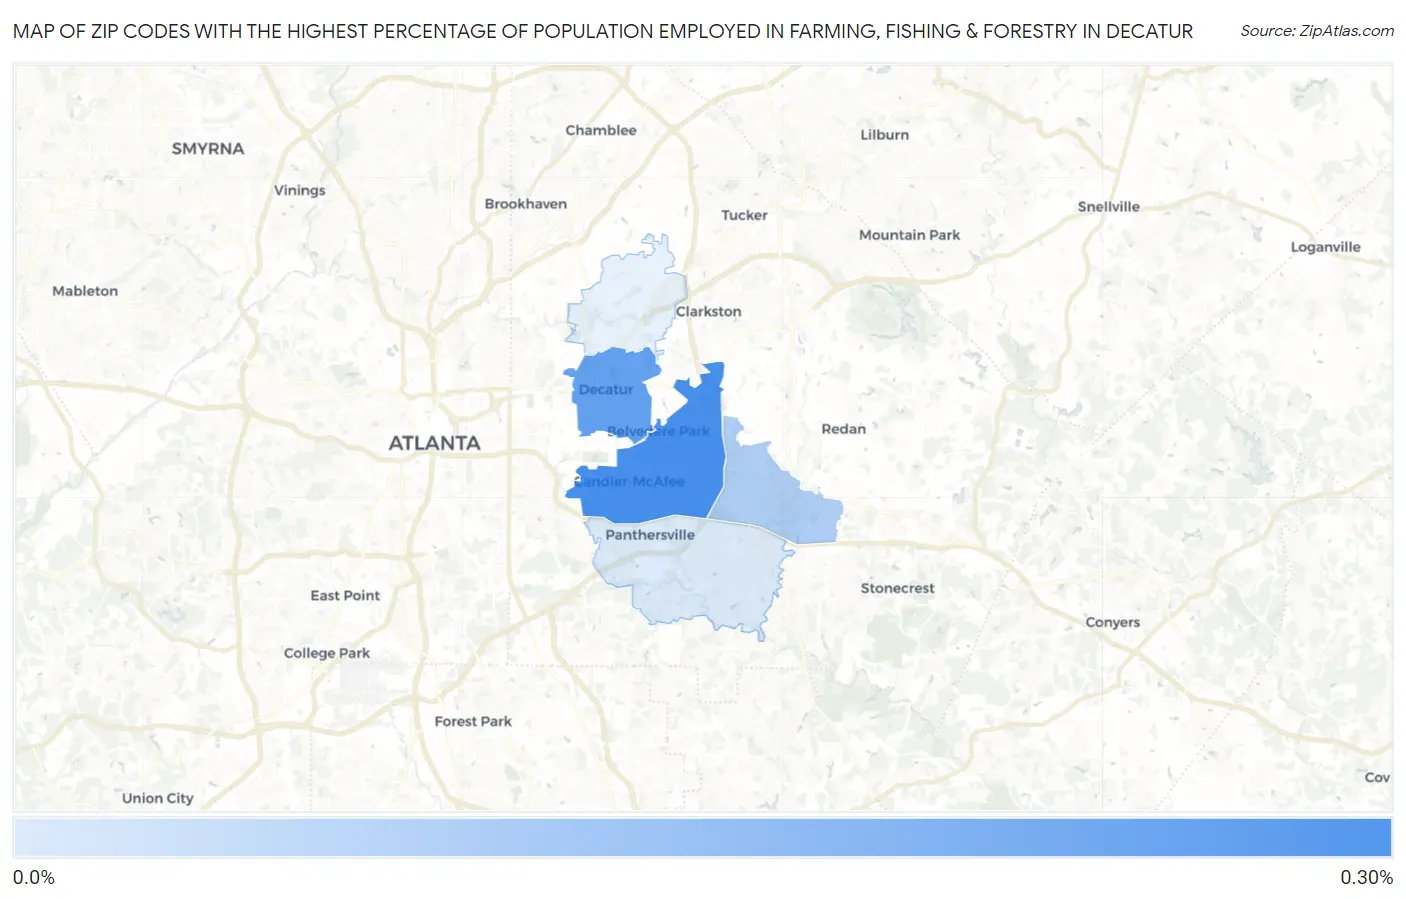
Map of Zip Codes with the Highest Percentage of Population Employed in Farming, Fishing & Forestry in Decatur

0.0%
0.30%
Zip Codes with the Highest Percentage of Population Employed in Farming, Fishing & Forestry in Decatur Map

Zip Codes with the Highest Percentage of Population Employed in Farming, Fishing & Forestry in Decatur, GA

Zip Code % Employed vs State vs National
1.300320.25%0.45%(-0.197)#3370.61%(-0.352)#15,362
2.300300.21%0.45%(-0.242)#3520.61%(-0.397)#16,005
3.300350.089%0.45%(-0.362)#4030.61%(-0.516)#17,945
4.300340.015%0.45%(-0.436)#4380.61%(-0.590)#19,113

Common Questions

What are the Top 3 Zip Codes with the Highest Percentage of Population Employed in Farming, Fishing & Forestry in Decatur, GA?
Top 3 Zip Codes with the Highest Percentage of Population Employed in Farming, Fishing & Forestry in Decatur, GA are:
#1
0.25%
#2
0.21%
#3
0.089%
What zip code has the Highest Percentage of Population Employed in Farming, Fishing & Forestry in Decatur, GA?
30032 has the Highest Percentage of Population Employed in Farming, Fishing & Forestry in Decatur, GA with 0.25%.
What is the Percentage of Population Employed in Farming, Fishing & Forestry in Decatur, GA?
Percentage of Population Employed in Farming, Fishing & Forestry in Decatur is 0.29%.
What is the Percentage of Population Employed in Farming, Fishing & Forestry in Georgia?
Percentage of Population Employed in Farming, Fishing & Forestry in Georgia is 0.45%.
What is the Percentage of Population Employed in Farming, Fishing & Forestry in the United States?
Percentage of Population Employed in Farming, Fishing & Forestry in the United States is 0.61%.