Zip Codes with the Highest Percentage of Population Employed in Arts, Entertainment & Recreation in Atlanta, GA

RELATED REPORTS & OPTIONS

Arts, Entertainment & Recreation
Population
Families and Households
Female Fertility
Female Fertility (Unmarried)
Race (Community Size)
Race (Percentage)
Ancestry (Community Size)
AfghanAfricanAlbanianAmericanApacheArabArgentineanArmenianAssyrian / Chaldean / SyriacAustralianAustrianBahamianBangladeshiBarbadianBelgianBelizeanBermudanBhutaneseBlackfeetBolivianBrazilianBritishBritish West IndianBulgarianBurmeseCajunCambodianCanadianCape VerdeanCelticCentral AmericanCentral American IndianCherokeeChickasawChileanChippewaChoctawColombianCosta RicanCreekCroatianCubanCzechCzechoslovakianDanishDominicanDutchDutch West IndianEastern EuropeanEcuadorianEgyptianEnglishEstonianEthiopianEuropeanFilipinoFinnishFrenchFrench CanadianGermanGhanaianGreekGuamanian / ChamorroGuatemalanGuyaneseHaitianHonduranHungarianIcelanderIndian (Asian)IndonesianIranianIraqiIrishIroquoisIsraeliItalianJamaicanJapaneseJordanianKenyanKoreanLaotianLatvianLebaneseLiberianLithuanianLumbeeLuxembourgerMacedonianMalaysianMalteseMexicanMexican American IndianMongolianMoroccanNative HawaiianNavajoNew ZealanderNicaraguanNigerianNorthern EuropeanNorwegianOsagePakistaniPalestinianPanamanianParaguayanPennsylvania GermanPeruvianPolishPortuguesePotawatomiPuerto RicanRomanianRussianSalvadoranSamoanScandinavianScotch-IrishScottishSeminoleSenegaleseSerbianSierra LeoneanSiouxSlavicSlovakSloveneSomaliSouth AfricanSouth AmericanSouth American IndianSoviet UnionSpaniardSpanishSpanish AmericanSri LankanSubsaharan AfricanSudaneseSwedishSwissSyrianThaiTrinidadian and TobagonianTurkishU.S. Virgin IslanderUgandanUkrainianUruguayanVenezuelanVietnameseWelshWest IndianYugoslavianZimbabwean
Ancestry (Percentage)
AfghanAfricanAlbanianAmericanApacheArabArgentineanArmenianAssyrian / Chaldean / SyriacAustralianAustrianBahamianBangladeshiBarbadianBelgianBelizeanBermudanBhutaneseBlackfeetBolivianBrazilianBritishBritish West IndianBulgarianBurmeseCajunCambodianCanadianCape VerdeanCelticCentral AmericanCentral American IndianCherokeeChickasawChileanChippewaChoctawColombianCosta RicanCreekCroatianCubanCzechCzechoslovakianDanishDominicanDutchDutch West IndianEastern EuropeanEcuadorianEgyptianEnglishEstonianEthiopianEuropeanFilipinoFinnishFrenchFrench CanadianGermanGhanaianGreekGuamanian / ChamorroGuatemalanGuyaneseHaitianHonduranHungarianIcelanderIndian (Asian)IndonesianIranianIraqiIrishIroquoisIsraeliItalianJamaicanJapaneseJordanianKenyanKoreanLaotianLatvianLebaneseLiberianLithuanianLumbeeLuxembourgerMacedonianMalaysianMalteseMexicanMexican American IndianMongolianMoroccanNative HawaiianNavajoNew ZealanderNicaraguanNigerianNorthern EuropeanNorwegianOsagePakistaniPalestinianPanamanianParaguayanPennsylvania GermanPeruvianPolishPortuguesePotawatomiPuerto RicanRomanianRussianSalvadoranSamoanScandinavianScotch-IrishScottishSeminoleSenegaleseSerbianSierra LeoneanSiouxSlavicSlovakSloveneSomaliSouth AfricanSouth AmericanSouth American IndianSoviet UnionSpaniardSpanishSpanish AmericanSri LankanSubsaharan AfricanSudaneseSwedishSwissSyrianThaiTrinidadian and TobagonianTurkishU.S. Virgin IslanderUgandanUkrainianUruguayanVenezuelanVietnameseWelshWest IndianYugoslavianZimbabwean
Immigrant Origin (Total)
AfghanistanAfricaArgentinaArmeniaAsiaAustraliaAustriaBahamasBangladeshBarbadosBelarusBelgiumBelizeBoliviaBosnia and HerzegovinaBrazilBulgariaCambodiaCameroonCanadaCaribbeanCentral AmericaChileChinaColombiaCongoCosta RicaCroatiaCubaCzechoslovakiaDenmarkDominicaDominican RepublicEastern AfricaEastern AsiaEastern EuropeEcuadorEgyptEl SalvadorEnglandEritreaEthiopiaEuropeFranceGermanyGhanaGreeceGrenadaGuatemalaGuyanaHaitiHondurasHong KongHungaryIndiaIndonesiaIranIraqIrelandIsraelItalyJamaicaJapanJordanKenyaKoreaKuwaitLaosLatin AmericaLatviaLebanonLiberiaLithuaniaMalaysiaMexicoMiddle AfricaMoldovaMoroccoNepalNetherlandsNicaraguaNigeriaNorthern AfricaNorthern EuropeOceaniaPakistanPanamaPeruPhilippinesPolandPortugalRomaniaRussiaSaudi ArabiaScotlandSenegalSerbiaSierra LeoneSingaporeSouth AfricaSouth AmericaSouth Central AsiaSouth Eastern AsiaSouthern EuropeSpainSri LankaSt. Vincent and the GrenadinesSudanSwedenSwitzerlandSyriaTaiwanThailandTrinidad and TobagoTurkeyUgandaUkraineUruguayUzbekistanVenezuelaVietnamWest IndiesWestern AfricaWestern AsiaWestern EuropeZaireZimbabwe
Immigrant Origin (Percentage)
AfghanistanAfricaArgentinaArmeniaAsiaAustraliaAustriaBahamasBangladeshBarbadosBelarusBelgiumBelizeBoliviaBosnia and HerzegovinaBrazilBulgariaCambodiaCameroonCanadaCaribbeanCentral AmericaChileChinaColombiaCongoCosta RicaCroatiaCubaCzechoslovakiaDenmarkDominicaDominican RepublicEastern AfricaEastern AsiaEastern EuropeEcuadorEgyptEl SalvadorEnglandEritreaEthiopiaEuropeFranceGermanyGhanaGreeceGrenadaGuatemalaGuyanaHaitiHondurasHong KongHungaryIndiaIndonesiaIranIraqIrelandIsraelItalyJamaicaJapanJordanKenyaKoreaKuwaitLaosLatin AmericaLatviaLebanonLiberiaLithuaniaMalaysiaMexicoMiddle AfricaMoldovaMoroccoNepalNetherlandsNicaraguaNigeriaNorthern AfricaNorthern EuropeOceaniaPakistanPanamaPeruPhilippinesPolandPortugalRomaniaRussiaSaudi ArabiaScotlandSenegalSerbiaSierra LeoneSingaporeSouth AfricaSouth AmericaSouth Central AsiaSouth Eastern AsiaSouthern EuropeSpainSri LankaSt. Vincent and the GrenadinesSudanSwedenSwitzerlandSyriaTaiwanThailandTrinidad and TobagoTurkeyUgandaUkraineUruguayUzbekistanVenezuelaVietnamWest IndiesWestern AfricaWestern AsiaWestern EuropeZaireZimbabwe
Income
Income (Families)
Income (Households)
Poverty
Poverty (Families)
Unemployment
Employment Occupations
Employment Industries
Employer Class
Commute Time
Commute Means
School Enrollment
Education by Degree Field
Occupancy
Finances
Physical Characteristics
Atlanta
Compare Zip Codes
Comparison Subject

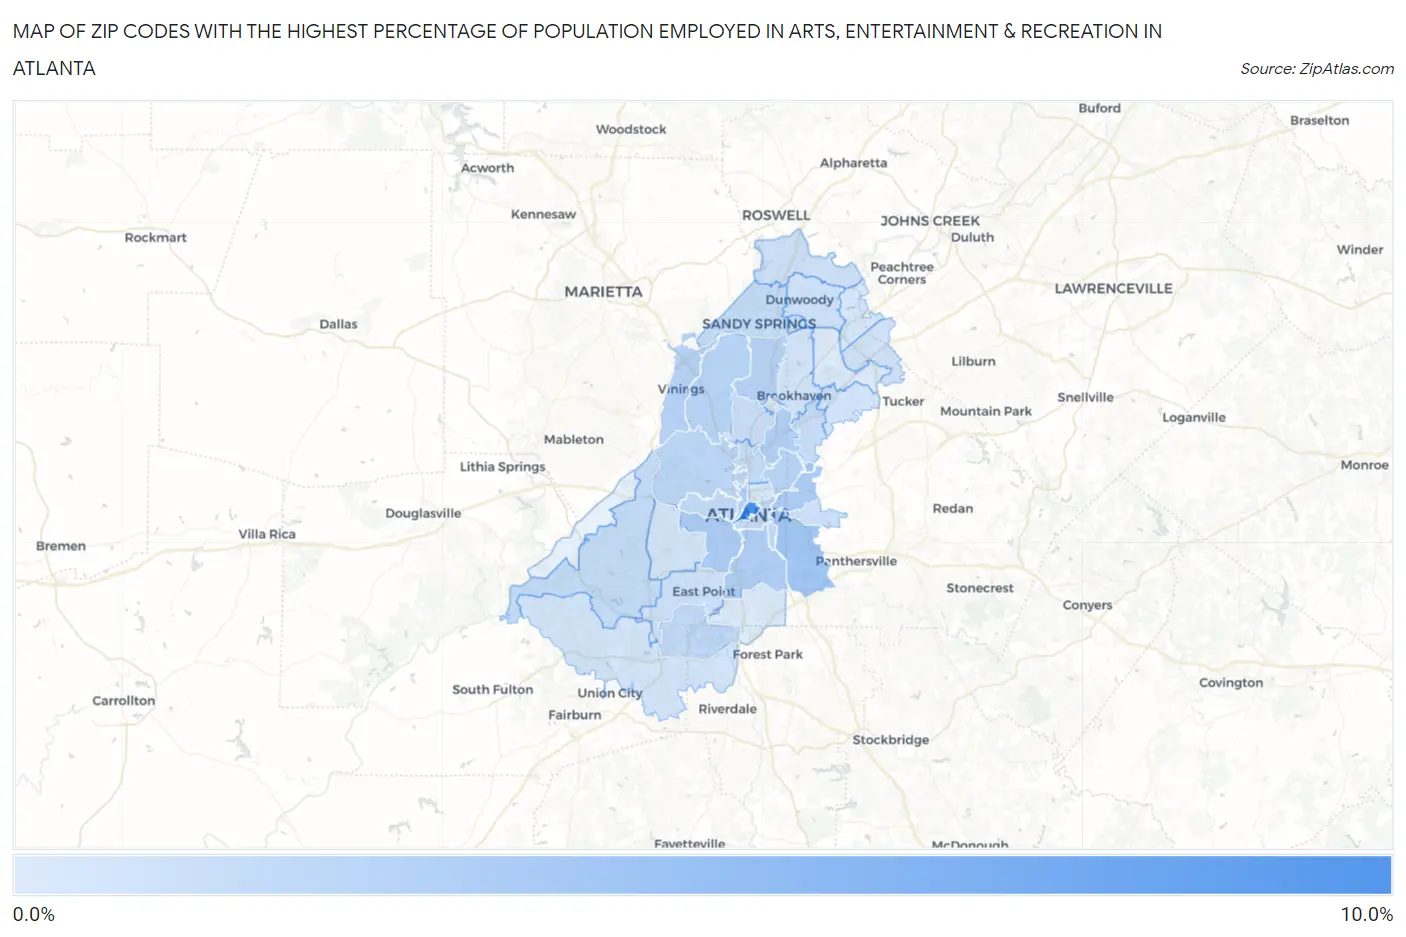
Map of Zip Codes with the Highest Percentage of Population Employed in Arts, Entertainment & Recreation in Atlanta

0.0%
10.0%
Zip Codes with the Highest Percentage of Population Employed in Arts, Entertainment & Recreation in Atlanta Map

Zip Codes with the Highest Percentage of Population Employed in Arts, Entertainment & Recreation in Atlanta, GA

Zip Code % Employed vs State vs National
1.303039.0%1.6%(+7.41)#42.1%(+6.95)#852
2.303224.0%1.6%(+2.43)#292.1%(+1.96)#3,268
3.303164.0%1.6%(+2.34)#342.1%(+1.88)#3,388
4.303103.5%1.6%(+1.89)#402.1%(+1.43)#4,099
5.303073.4%1.6%(+1.81)#432.1%(+1.35)#4,285
6.303133.3%1.6%(+1.63)#492.1%(+1.17)#4,678
7.303153.2%1.6%(+1.57)#512.1%(+1.11)#4,826
8.303243.1%1.6%(+1.47)#542.1%(+1.01)#5,090
9.303392.9%1.6%(+1.23)#672.1%(+0.771)#5,801
10.303422.8%1.6%(+1.20)#702.1%(+0.735)#5,925
11.303272.8%1.6%(+1.14)#742.1%(+0.680)#6,132
12.303062.7%1.6%(+1.03)#822.1%(+0.572)#6,539
13.303182.6%1.6%(+1.02)#832.1%(+0.562)#6,586
14.303322.4%1.6%(+0.824)#982.1%(+0.361)#7,447
15.303632.4%1.6%(+0.795)#1012.1%(+0.333)#7,574
16.303372.3%1.6%(+0.728)#1072.1%(+0.265)#7,889
17.303142.2%1.6%(+0.589)#1232.1%(+0.126)#8,590
18.303122.2%1.6%(+0.568)#1272.1%(+0.105)#8,715
19.303282.1%1.6%(+0.529)#1332.1%(+0.067)#8,930
20.303312.1%1.6%(+0.524)#1362.1%(+0.062)#8,962
21.303092.1%1.6%(+0.496)#1392.1%(+0.033)#9,123
22.303292.0%1.6%(+0.349)#1562.1%(-0.113)#9,959
23.303462.0%1.6%(+0.331)#1602.1%(-0.131)#10,069
24.303051.8%1.6%(+0.207)#1782.1%(-0.255)#10,828
25.303171.7%1.6%(+0.092)#1972.1%(-0.371)#11,656
26.303441.7%1.6%(+0.047)#2042.1%(-0.415)#11,962
27.303501.6%1.6%(-0.039)#2202.1%(-0.501)#12,599
28.303381.6%1.6%(-0.060)#2252.1%(-0.523)#12,782
29.303401.5%1.6%(-0.094)#2332.1%(-0.556)#13,060
30.303451.5%1.6%(-0.126)#2352.1%(-0.589)#13,266
31.303191.4%1.6%(-0.237)#2502.1%(-0.699)#14,116
32.303491.4%1.6%(-0.241)#2512.1%(-0.703)#14,136
33.303111.3%1.6%(-0.286)#2592.1%(-0.749)#14,488
34.303081.3%1.6%(-0.348)#2762.1%(-0.810)#14,913
35.303601.3%1.6%(-0.368)#2822.1%(-0.831)#15,089
36.303261.0%1.6%(-0.585)#3202.1%(-1.05)#16,686
37.303540.90%1.6%(-0.716)#3482.1%(-1.18)#17,651
38.303410.89%1.6%(-0.727)#3532.1%(-1.19)#17,734

Common Questions

What are the Top 10 Zip Codes with the Highest Percentage of Population Employed in Arts, Entertainment & Recreation in Atlanta, GA?
Top 10 Zip Codes with the Highest Percentage of Population Employed in Arts, Entertainment & Recreation in Atlanta, GA are:
#1
9.0%
#2
4.0%
#3
4.0%
#4
3.5%
#5
3.4%
#6
3.3%
#7
3.2%
#8
3.1%
#9
2.9%
#10
2.8%
What zip code has the Highest Percentage of Population Employed in Arts, Entertainment & Recreation in Atlanta, GA?
30303 has the Highest Percentage of Population Employed in Arts, Entertainment & Recreation in Atlanta, GA with 9.0%.
What is the Percentage of Population Employed in Arts, Entertainment & Recreation in Atlanta, GA?
Percentage of Population Employed in Arts, Entertainment & Recreation in Atlanta is 2.5%.
What is the Percentage of Population Employed in Arts, Entertainment & Recreation in Georgia?
Percentage of Population Employed in Arts, Entertainment & Recreation in Georgia is 1.6%.
What is the Percentage of Population Employed in Arts, Entertainment & Recreation in the United States?
Percentage of Population Employed in Arts, Entertainment & Recreation in the United States is 2.1%.