Zip Codes with the Highest Percentage of Population Employed in Farming, Fishing & Forestry in Lakeland, FL

RELATED REPORTS & OPTIONS

Farming, Fishing & Forestry
Population
Families and Households
Female Fertility
Female Fertility (Unmarried)
Race (Community Size)
Race (Percentage)
Ancestry (Community Size)
AfricanAmericanArabArmenianAustralianAustrianBahamianBangladeshiBarbadianBelgianBelizeanBhutaneseBlackfeetBolivianBrazilianBritishBritish West IndianBurmeseCanadianCape VerdeanCelticCentral AmericanCentral American IndianCherokeeChileanChippewaChoctawColombianCosta RicanCreekCroatianCubanCzechCzechoslovakianDanishDominicanDutchEastern EuropeanEcuadorianEnglishEuropeanFilipinoFinnishFrenchFrench CanadianGermanGreekGuamanian / ChamorroGuatemalanGuyaneseHaitianHonduranHungarianIcelanderIndian (Asian)IranianIrishItalianJamaicanJapaneseKoreanLaotianLebaneseLiberianLithuanianMalaysianMexicanMoroccanNative HawaiianNavajoNicaraguanNigerianNorthern EuropeanNorwegianPakistaniPalestinianPanamanianPennsylvania GermanPeruvianPolishPortuguesePuerto RicanRomanianRussianSalvadoranScandinavianScotch-IrishScottishSeminoleSerbianSlavicSlovakSloveneSouth AfricanSouth AmericanSouth American IndianSpaniardSpanishSri LankanSubsaharan AfricanSwedishSwissSyrianThaiTrinidadian and TobagonianU.S. Virgin IslanderUkrainianUruguayanVenezuelanWelshWest IndianYugoslavian
Ancestry (Percentage)
AfricanAmericanArabArmenianAustralianAustrianBahamianBangladeshiBarbadianBelgianBelizeanBhutaneseBlackfeetBolivianBrazilianBritishBritish West IndianBurmeseCanadianCape VerdeanCelticCentral AmericanCentral American IndianCherokeeChileanChippewaChoctawColombianCosta RicanCreekCroatianCubanCzechCzechoslovakianDanishDominicanDutchEastern EuropeanEcuadorianEnglishEuropeanFilipinoFinnishFrenchFrench CanadianGermanGreekGuamanian / ChamorroGuatemalanGuyaneseHaitianHonduranHungarianIcelanderIndian (Asian)IranianIrishItalianJamaicanJapaneseKoreanLaotianLebaneseLiberianLithuanianMalaysianMexicanMoroccanNative HawaiianNavajoNicaraguanNigerianNorthern EuropeanNorwegianPakistaniPalestinianPanamanianPennsylvania GermanPeruvianPolishPortuguesePuerto RicanRomanianRussianSalvadoranScandinavianScotch-IrishScottishSeminoleSerbianSlavicSlovakSloveneSouth AfricanSouth AmericanSouth American IndianSpaniardSpanishSri LankanSubsaharan AfricanSwedishSwissSyrianThaiTrinidadian and TobagonianU.S. Virgin IslanderUkrainianUruguayanVenezuelanWelshWest IndianYugoslavian
Immigrant Origin (Total)
Immigrant Origin (Percentage)
Income
Income (Families)
Income (Households)
Poverty
Poverty (Families)
Unemployment
Employment Occupations
Employment Industries
Employer Class
Commute Time
Commute Means
School Enrollment
Education by Degree Field
Occupancy
Finances
Physical Characteristics
Lakeland
Compare Zip Codes
Comparison Subject

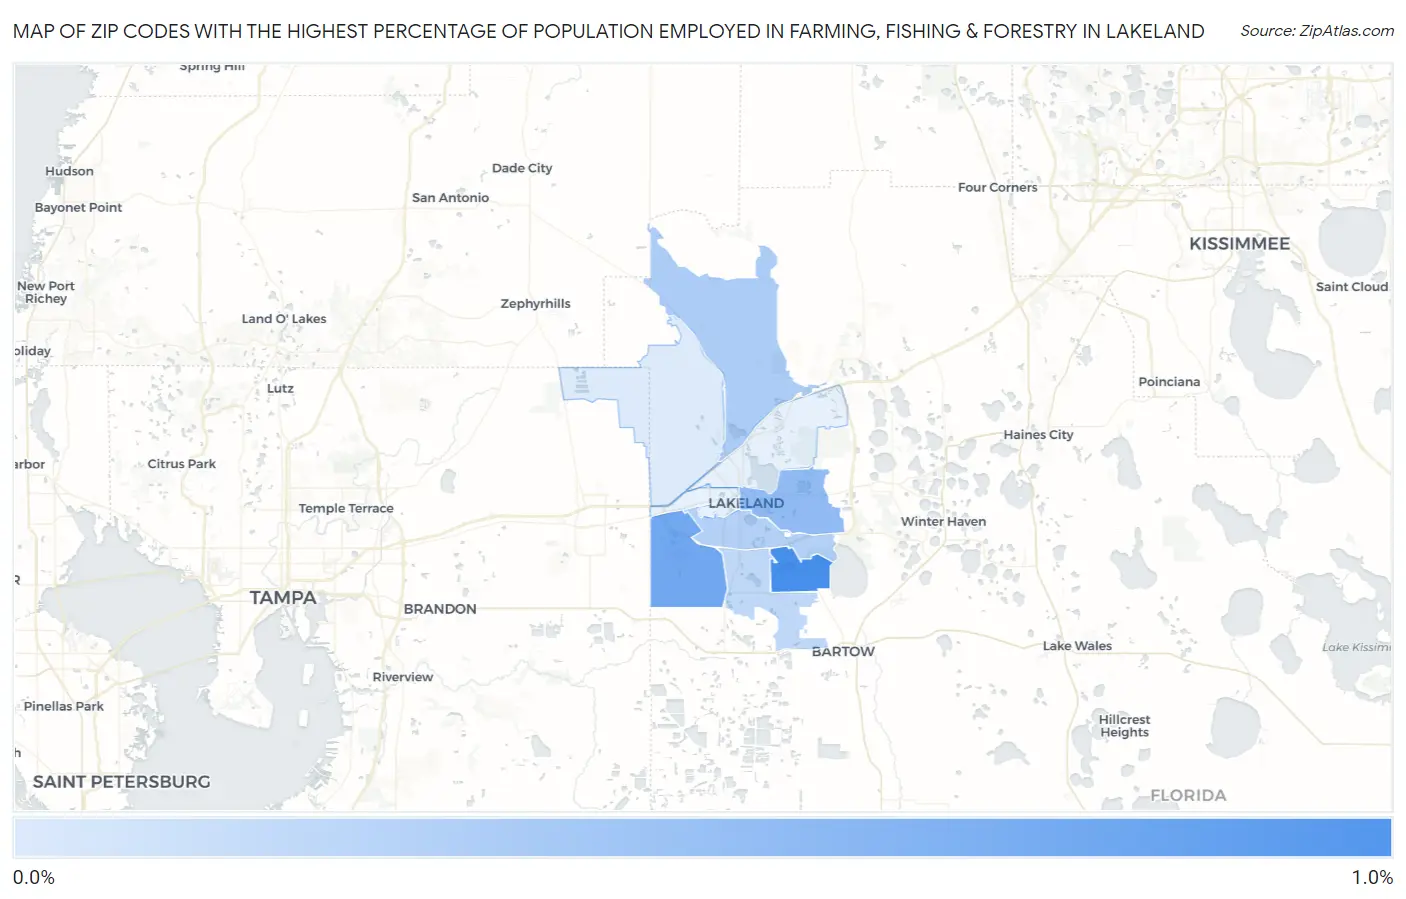
Map of Zip Codes with the Highest Percentage of Population Employed in Farming, Fishing & Forestry in Lakeland

0.0%
1.0%
Zip Codes with the Highest Percentage of Population Employed in Farming, Fishing & Forestry in Lakeland Map

Zip Codes with the Highest Percentage of Population Employed in Farming, Fishing & Forestry in Lakeland, FL

Zip Code % Employed vs State vs National
1.338120.87%0.47%(+0.402)#1980.61%(+0.265)#10,396
2.338110.66%0.47%(+0.189)#2380.61%(+0.052)#11,655
3.338010.50%0.47%(+0.028)#2950.61%(-0.109)#12,863
4.338090.37%0.47%(-0.103)#3510.61%(-0.240)#14,096
5.338030.32%0.47%(-0.144)#3670.61%(-0.281)#14,530
6.338130.27%0.47%(-0.195)#4000.61%(-0.332)#15,127
7.338100.12%0.47%(-0.346)#5210.61%(-0.483)#17,391

Common Questions

What are the Top 5 Zip Codes with the Highest Percentage of Population Employed in Farming, Fishing & Forestry in Lakeland, FL?
Top 5 Zip Codes with the Highest Percentage of Population Employed in Farming, Fishing & Forestry in Lakeland, FL are:
#1
0.87%
#2
0.66%
#3
0.50%
#4
0.37%
#5
0.32%
What zip code has the Highest Percentage of Population Employed in Farming, Fishing & Forestry in Lakeland, FL?
33812 has the Highest Percentage of Population Employed in Farming, Fishing & Forestry in Lakeland, FL with 0.87%.
What is the Percentage of Population Employed in Farming, Fishing & Forestry in Lakeland, FL?
Percentage of Population Employed in Farming, Fishing & Forestry in Lakeland is 0.32%.
What is the Percentage of Population Employed in Farming, Fishing & Forestry in Florida?
Percentage of Population Employed in Farming, Fishing & Forestry in Florida is 0.47%.
What is the Percentage of Population Employed in Farming, Fishing & Forestry in the United States?
Percentage of Population Employed in Farming, Fishing & Forestry in the United States is 0.61%.