Zip Codes with the Highest Percentage of Population Employed in Farming, Fishing & Forestry in Homestead, FL

RELATED REPORTS & OPTIONS

Farming, Fishing & Forestry
Population
Families and Households
Female Fertility
Female Fertility (Unmarried)
Race (Community Size)
Race (Percentage)
Ancestry (Community Size)
AfricanAmericanArabArgentineanBahamianBelizeanBhutaneseBlackfeetBolivianBrazilianBritishBritish West IndianBulgarianBurmeseCanadianCape VerdeanCentral AmericanCentral American IndianCherokeeChileanColombianCosta RicanCubanCzechDominicanDutchEastern EuropeanEcuadorianEnglishEuropeanFinnishFrenchFrench CanadianGermanGreekGuatemalanGuyaneseHaitianHonduranHungarianIndian (Asian)IrishItalianJamaicanJapaneseKoreanLebaneseLithuanianMalaysianMexicanMexican American IndianNicaraguanNigerianNorthern EuropeanNorwegianPanamanianPeruvianPolishPortuguesePuerto RicanRussianSalvadoranScandinavianScotch-IrishScottishSlavicSouth AmericanSouth American IndianSpaniardSpanishSri LankanSubsaharan AfricanSwedishSyrianThaiTrinidadian and TobagonianTurkishU.S. Virgin IslanderUruguayanVenezuelanVietnameseWelshWest Indian
Ancestry (Percentage)
AfricanAmericanArabArgentineanBahamianBelizeanBhutaneseBlackfeetBolivianBrazilianBritishBritish West IndianBulgarianBurmeseCanadianCape VerdeanCentral AmericanCentral American IndianCherokeeChileanColombianCosta RicanCubanCzechDominicanDutchEastern EuropeanEcuadorianEnglishEuropeanFinnishFrenchFrench CanadianGermanGreekGuatemalanGuyaneseHaitianHonduranHungarianIndian (Asian)IrishItalianJamaicanJapaneseKoreanLebaneseLithuanianMalaysianMexicanMexican American IndianNicaraguanNigerianNorthern EuropeanNorwegianPanamanianPeruvianPolishPortuguesePuerto RicanRussianSalvadoranScandinavianScotch-IrishScottishSlavicSouth AmericanSouth American IndianSpaniardSpanishSri LankanSubsaharan AfricanSwedishSyrianThaiTrinidadian and TobagonianTurkishU.S. Virgin IslanderUruguayanVenezuelanVietnameseWelshWest Indian
Immigrant Origin (Total)
Immigrant Origin (Percentage)
Income
Income (Families)
Income (Households)
Poverty
Poverty (Families)
Unemployment
Employment Occupations
Employment Industries
Employer Class
Commute Time
Commute Means
School Enrollment
Education by Degree Field
Occupancy
Finances
Physical Characteristics
Homestead
Compare Zip Codes
Comparison Subject

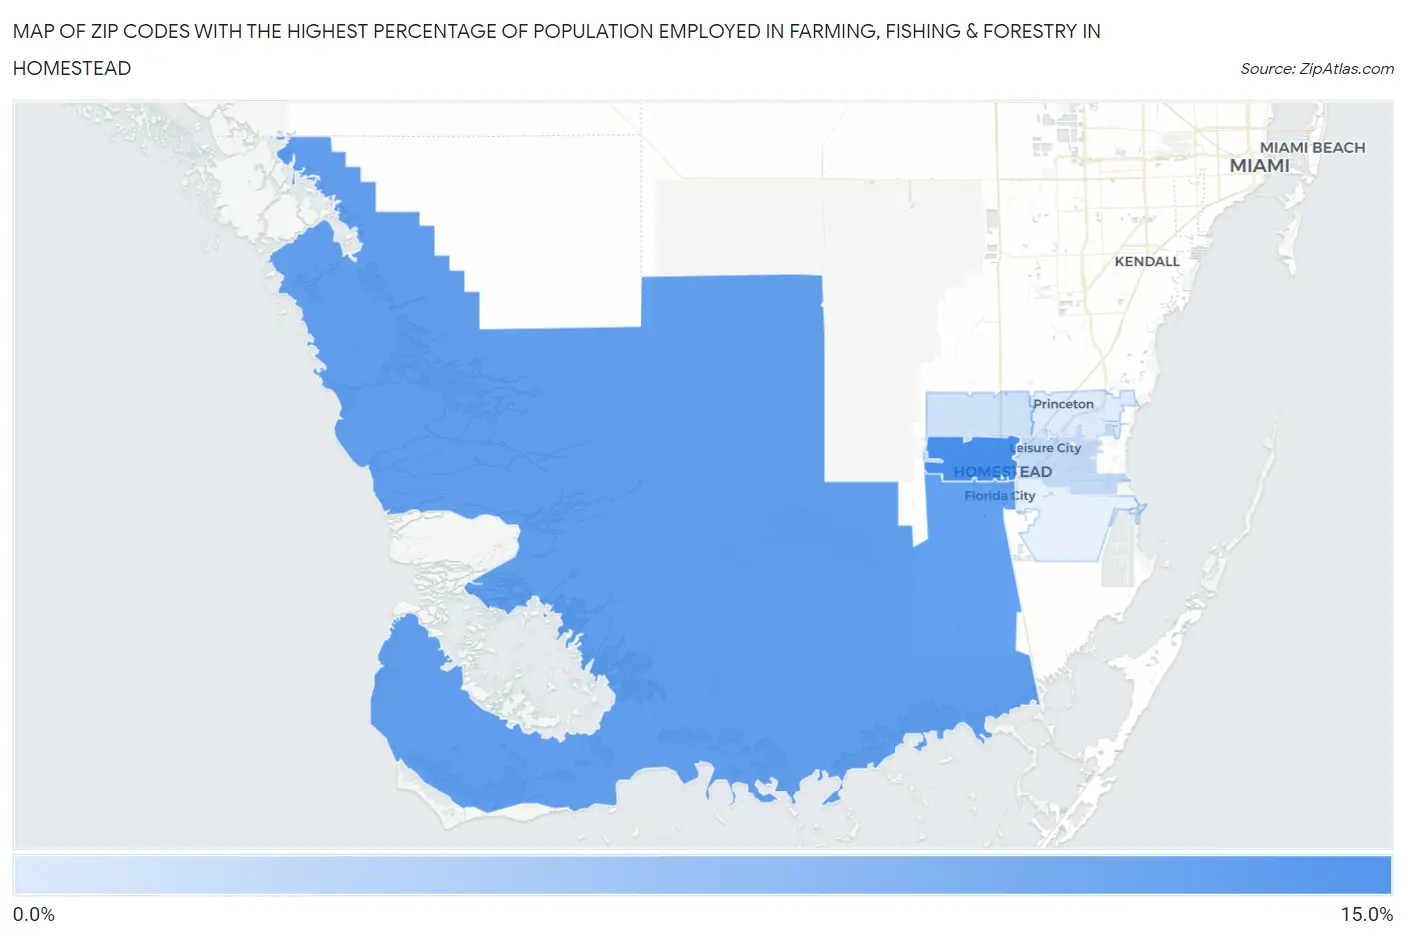
Map of Zip Codes with the Highest Percentage of Population Employed in Farming, Fishing & Forestry in Homestead

0.0%
15.0%
Zip Codes with the Highest Percentage of Population Employed in Farming, Fishing & Forestry in Homestead Map

Zip Codes with the Highest Percentage of Population Employed in Farming, Fishing & Forestry in Homestead, FL

Zip Code % Employed vs State vs National
1.3303011.5%0.47%(+11.1)#140.61%(+10.9)#983
2.330349.3%0.47%(+8.86)#230.61%(+8.73)#1,333
3.330332.2%0.47%(+1.77)#1020.61%(+1.63)#6,049
4.330311.5%0.47%(+0.999)#1310.61%(+0.862)#7,987
5.330320.51%0.47%(+0.038)#2900.61%(-0.099)#12,781

Common Questions

What are the Top 5 Zip Codes with the Highest Percentage of Population Employed in Farming, Fishing & Forestry in Homestead, FL?
Top 5 Zip Codes with the Highest Percentage of Population Employed in Farming, Fishing & Forestry in Homestead, FL are:
#1
11.5%
#2
9.3%
#3
2.2%
#4
1.5%
#5
0.51%
What zip code has the Highest Percentage of Population Employed in Farming, Fishing & Forestry in Homestead, FL?
33030 has the Highest Percentage of Population Employed in Farming, Fishing & Forestry in Homestead, FL with 11.5%.
What is the Percentage of Population Employed in Farming, Fishing & Forestry in Homestead, FL?
Percentage of Population Employed in Farming, Fishing & Forestry in Homestead is 5.7%.
What is the Percentage of Population Employed in Farming, Fishing & Forestry in Florida?
Percentage of Population Employed in Farming, Fishing & Forestry in Florida is 0.47%.
What is the Percentage of Population Employed in Farming, Fishing & Forestry in the United States?
Percentage of Population Employed in Farming, Fishing & Forestry in the United States is 0.61%.