Zip Codes with the Highest Percentage of Population Employed in Farming, Fishing & Forestry in Fort Myers, FL

RELATED REPORTS & OPTIONS

Farming, Fishing & Forestry
Population
Families and Households
Female Fertility
Female Fertility (Unmarried)
Race (Community Size)
Race (Percentage)
Ancestry (Community Size)
AfricanAlbanianAmericanApacheArabArgentineanArmenianAustralianAustrianBahamianBelgianBelizeanBhutaneseBolivianBrazilianBritishBritish West IndianBulgarianBurmeseCanadianCape VerdeanCelticCentral AmericanCentral American IndianCherokeeChileanChippewaChoctawColombianCosta RicanCroatianCubanCzechCzechoslovakianDanishDominicanDutchEastern EuropeanEcuadorianEgyptianEnglishEuropeanFilipinoFinnishFrenchFrench CanadianGermanGreekGuatemalanGuyaneseHaitianHonduranHungarianIndian (Asian)IndonesianIranianIrishIroquoisIsraeliItalianJamaicanKoreanLatvianLebaneseLithuanianMalaysianMalteseMexicanMexican American IndianMongolianMoroccanNative HawaiianNew ZealanderNicaraguanNigerianNorthern EuropeanNorwegianPakistaniPalestinianPanamanianParaguayanPennsylvania GermanPeruvianPolishPortuguesePotawatomiPuerto RicanRomanianRussianSalvadoranSamoanScandinavianScotch-IrishScottishSeminoleSerbianSiouxSlavicSlovakSloveneSouth AfricanSouth AmericanSpaniardSpanishSri LankanSubsaharan AfricanSwedishSwissSyrianThaiTrinidadian and TobagonianTurkishU.S. Virgin IslanderUkrainianUruguayanVenezuelanVietnameseWelshWest IndianYugoslavian
Ancestry (Percentage)
AfricanAlbanianAmericanApacheArabArgentineanArmenianAustralianAustrianBahamianBelgianBelizeanBhutaneseBolivianBrazilianBritishBritish West IndianBulgarianBurmeseCanadianCape VerdeanCelticCentral AmericanCentral American IndianCherokeeChileanChippewaChoctawColombianCosta RicanCroatianCubanCzechCzechoslovakianDanishDominicanDutchEastern EuropeanEcuadorianEgyptianEnglishEuropeanFilipinoFinnishFrenchFrench CanadianGermanGreekGuatemalanGuyaneseHaitianHonduranHungarianIndian (Asian)IndonesianIranianIrishIroquoisIsraeliItalianJamaicanKoreanLatvianLebaneseLithuanianMalaysianMalteseMexicanMexican American IndianMongolianMoroccanNative HawaiianNew ZealanderNicaraguanNigerianNorthern EuropeanNorwegianPakistaniPalestinianPanamanianParaguayanPennsylvania GermanPeruvianPolishPortuguesePotawatomiPuerto RicanRomanianRussianSalvadoranSamoanScandinavianScotch-IrishScottishSeminoleSerbianSiouxSlavicSlovakSloveneSouth AfricanSouth AmericanSpaniardSpanishSri LankanSubsaharan AfricanSwedishSwissSyrianThaiTrinidadian and TobagonianTurkishU.S. Virgin IslanderUkrainianUruguayanVenezuelanVietnameseWelshWest IndianYugoslavian
Immigrant Origin (Total)
AfricaArgentinaAsiaAustriaBahamasBangladeshBarbadosBelarusBelgiumBelizeBoliviaBosnia and HerzegovinaBrazilBurma / MyanmarCanadaCaribbeanCentral AmericaChileChinaColombiaCosta RicaCroatiaCubaCzechoslovakiaDominican RepublicEastern AfricaEastern AsiaEastern EuropeEcuadorEgyptEl SalvadorEnglandEuropeFijiFranceGermanyGreeceGuatemalaGuyanaHaitiHondurasHong KongHungaryIndiaIranIrelandIsraelItalyJamaicaJapanJordanKoreaLaosLatin AmericaLebanonLithuaniaMalaysiaMexicoMoldovaMoroccoNepalNetherlandsNicaraguaNorthern AfricaNorthern EuropeOceaniaPakistanPanamaPeruPhilippinesPolandPortugalRomaniaRussiaScotlandSierra LeoneSingaporeSouth AfricaSouth AmericaSouth Central AsiaSouth Eastern AsiaSouthern EuropeSpainSri LankaSwedenSwitzerlandSyriaThailandTrinidad and TobagoTurkeyUkraineUruguayVenezuelaVietnamWestern AfricaWestern AsiaWestern Europe
Immigrant Origin (Percentage)
AfricaArgentinaAsiaAustriaBahamasBangladeshBarbadosBelarusBelgiumBelizeBoliviaBosnia and HerzegovinaBrazilBurma / MyanmarCanadaCaribbeanCentral AmericaChileChinaColombiaCosta RicaCroatiaCubaCzechoslovakiaDominican RepublicEastern AfricaEastern AsiaEastern EuropeEcuadorEgyptEl SalvadorEnglandEuropeFijiFranceGermanyGreeceGuatemalaGuyanaHaitiHondurasHong KongHungaryIndiaIranIrelandIsraelItalyJamaicaJapanJordanKoreaLaosLatin AmericaLebanonLithuaniaMalaysiaMexicoMoldovaMoroccoNepalNetherlandsNicaraguaNorthern AfricaNorthern EuropeOceaniaPakistanPanamaPeruPhilippinesPolandPortugalRomaniaRussiaScotlandSierra LeoneSingaporeSouth AfricaSouth AmericaSouth Central AsiaSouth Eastern AsiaSouthern EuropeSpainSri LankaSwedenSwitzerlandSyriaThailandTrinidad and TobagoTurkeyUkraineUruguayVenezuelaVietnamWestern AfricaWestern AsiaWestern Europe
Income
Income (Families)
Income (Households)
Poverty
Poverty (Families)
Unemployment
Employment Occupations
Employment Industries
Employer Class
Commute Time
Commute Means
School Enrollment
Education by Degree Field
Occupancy
Finances
Physical Characteristics
Fort Myers
Compare Zip Codes
Comparison Subject

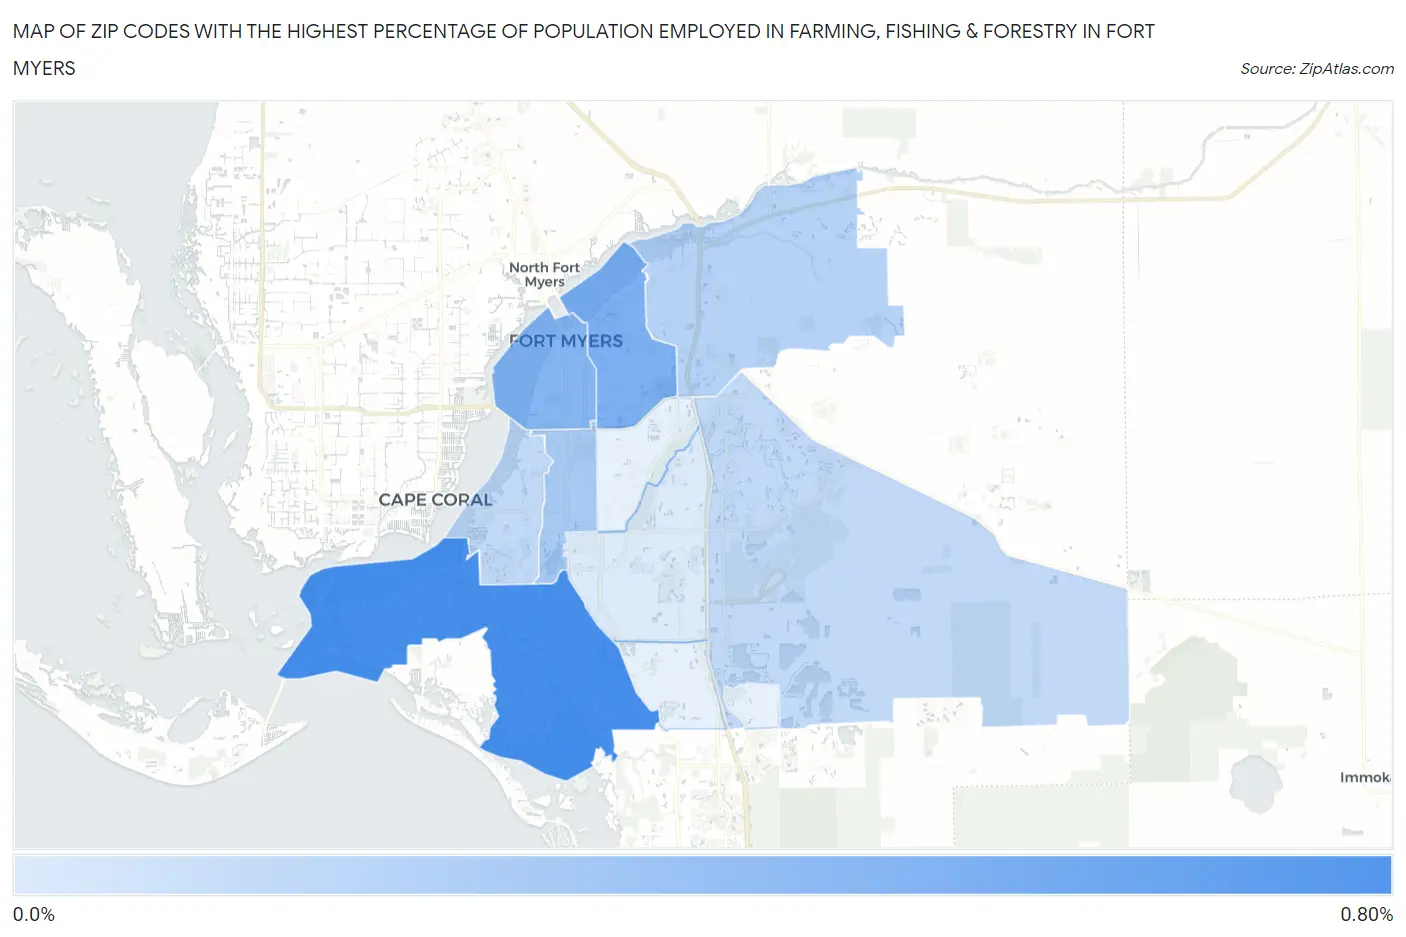
Map of Zip Codes with the Highest Percentage of Population Employed in Farming, Fishing & Forestry in Fort Myers

0.0%
0.80%
Zip Codes with the Highest Percentage of Population Employed in Farming, Fishing & Forestry in Fort Myers Map

Zip Codes with the Highest Percentage of Population Employed in Farming, Fishing & Forestry in Fort Myers, FL

Zip Code % Employed vs State vs National
1.339080.80%0.47%(+0.331)#2110.61%(+0.194)#10,783
2.339160.53%0.47%(+0.062)#2820.61%(-0.075)#12,595
3.339010.48%0.47%(+0.011)#2980.61%(-0.126)#13,031
4.339070.30%0.47%(-0.167)#3820.61%(-0.304)#14,812
5.339050.23%0.47%(-0.242)#4300.61%(-0.379)#15,744
6.339130.17%0.47%(-0.296)#4630.61%(-0.433)#16,534
7.339190.17%0.47%(-0.297)#4640.61%(-0.434)#16,543
8.339120.026%0.47%(-0.443)#6270.61%(-0.580)#19,003

Common Questions

What are the Top 10 Zip Codes with the Highest Percentage of Population Employed in Farming, Fishing & Forestry in Fort Myers, FL?
Top 10 Zip Codes with the Highest Percentage of Population Employed in Farming, Fishing & Forestry in Fort Myers, FL are:
#1
0.80%
#2
0.53%
#3
0.48%
#4
0.30%
#5
0.23%
#6
0.17%
#7
0.17%
#8
0.026%
#9
0.0%
#10
0.0%
What zip code has the Highest Percentage of Population Employed in Farming, Fishing & Forestry in Fort Myers, FL?
33908 has the Highest Percentage of Population Employed in Farming, Fishing & Forestry in Fort Myers, FL with 0.80%.
What is the Percentage of Population Employed in Farming, Fishing & Forestry in Fort Myers, FL?
Percentage of Population Employed in Farming, Fishing & Forestry in Fort Myers is 0.42%.
What is the Percentage of Population Employed in Farming, Fishing & Forestry in Florida?
Percentage of Population Employed in Farming, Fishing & Forestry in Florida is 0.47%.
What is the Percentage of Population Employed in Farming, Fishing & Forestry in the United States?
Percentage of Population Employed in Farming, Fishing & Forestry in the United States is 0.61%.