Zip Codes with the Highest Percentage of Population Employed in Agriculture, Fishing & Hunting in Cape Coral, FL
RELATED REPORTS & OPTIONS
Agriculture, Fishing & Hunting
Cape Coral
Compare Zip Codes
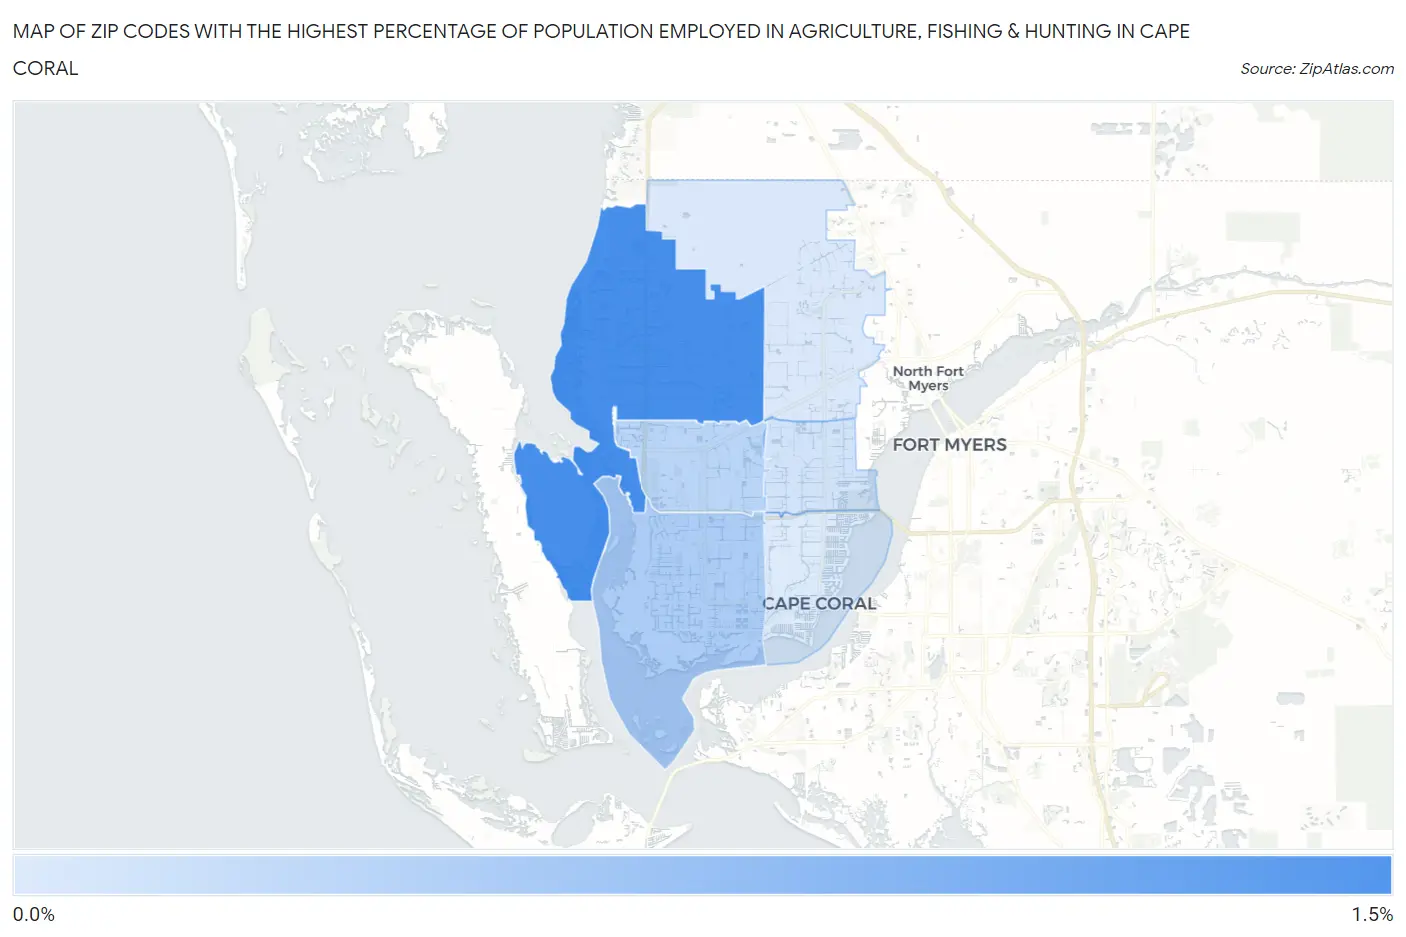
Map of Zip Codes with the Highest Percentage of Population Employed in Agriculture, Fishing & Hunting in Cape Coral
0.0%
1.5%
Zip Codes with the Highest Percentage of Population Employed in Agriculture, Fishing & Hunting in Cape Coral, FL
| Zip Code | % Employed | vs State | vs National | |
| 1. | 33993 | 1.4% | 0.75%(+0.665)#221 | 1.2%(+0.212)#14,595 |
| 2. | 33914 | 0.48% | 0.75%(-0.262)#428 | 1.2%(-0.715)#19,415 |
| 3. | 33991 | 0.37% | 0.75%(-0.373)#494 | 1.2%(-0.827)#20,404 |
| 4. | 33990 | 0.17% | 0.75%(-0.578)#642 | 1.2%(-1.03)#22,768 |
| 5. | 33909 | 0.078% | 0.75%(-0.668)#733 | 1.2%(-1.12)#23,982 |
| 6. | 33904 | 0.059% | 0.75%(-0.687)#747 | 1.2%(-1.14)#24,241 |
1
Common Questions
What are the Top 5 Zip Codes with the Highest Percentage of Population Employed in Agriculture, Fishing & Hunting in Cape Coral, FL?
Top 5 Zip Codes with the Highest Percentage of Population Employed in Agriculture, Fishing & Hunting in Cape Coral, FL are:
What zip code has the Highest Percentage of Population Employed in Agriculture, Fishing & Hunting in Cape Coral, FL?
33993 has the Highest Percentage of Population Employed in Agriculture, Fishing & Hunting in Cape Coral, FL with 1.4%.
What is the Percentage of Population Employed in Agriculture, Fishing & Hunting in Cape Coral, FL?
Percentage of Population Employed in Agriculture, Fishing & Hunting in Cape Coral is 0.29%.
What is the Percentage of Population Employed in Agriculture, Fishing & Hunting in Florida?
Percentage of Population Employed in Agriculture, Fishing & Hunting in Florida is 0.75%.
What is the Percentage of Population Employed in Agriculture, Fishing & Hunting in the United States?
Percentage of Population Employed in Agriculture, Fishing & Hunting in the United States is 1.2%.