Costa Rican vs Immigrants from Armenia Family Households
COMPARE
Costa Rican
Immigrants from Armenia
Family Households
Family Households Comparison
Costa Ricans
Immigrants from Armenia
65.9%
FAMILY HOUSEHOLDS
99.9/ 100
METRIC RATING
65th/ 347
METRIC RANK
63.5%
FAMILY HOUSEHOLDS
2.6/ 100
METRIC RATING
233rd/ 347
METRIC RANK
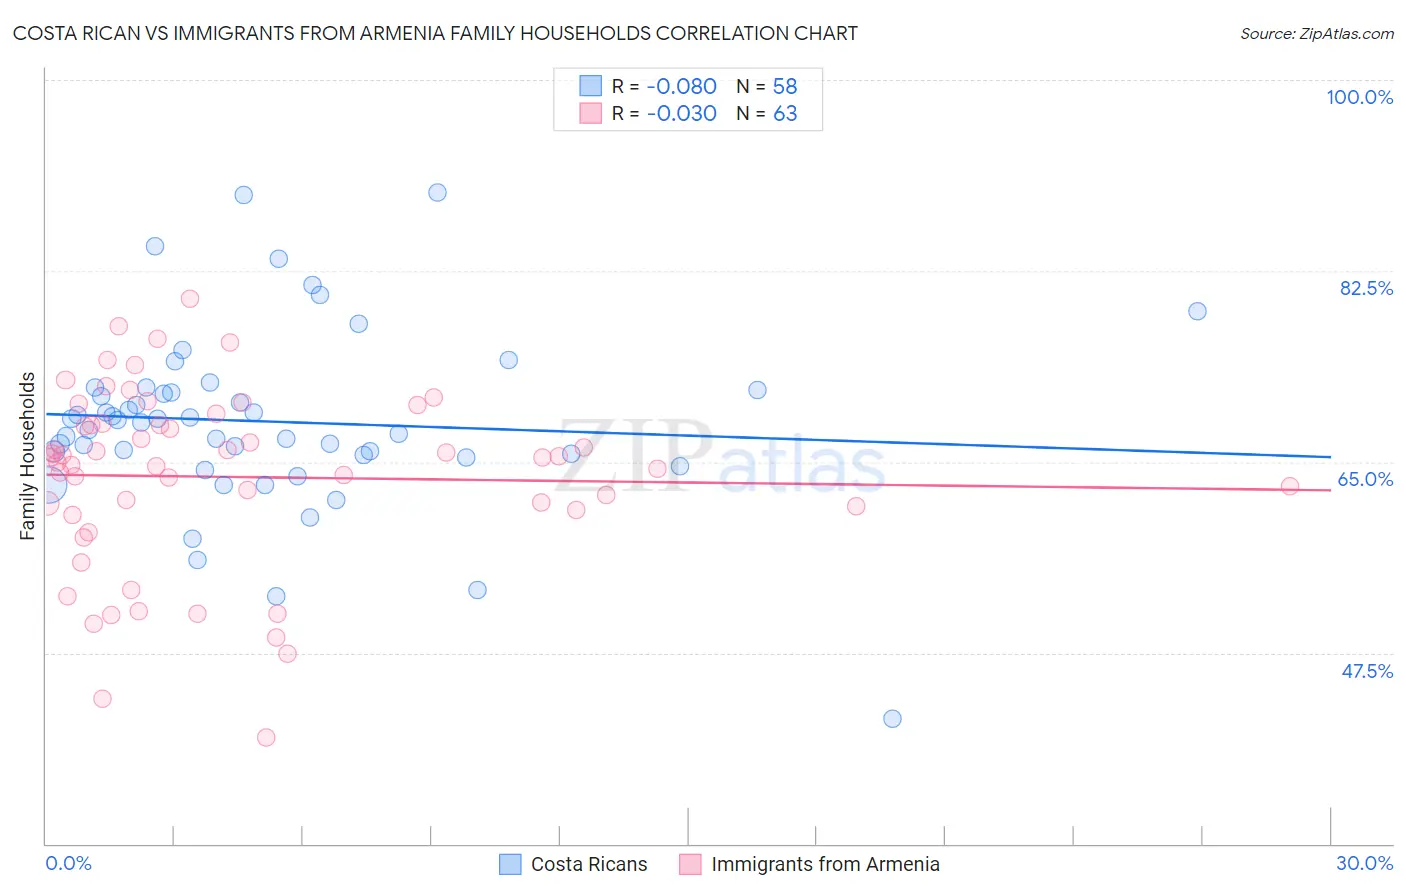
Costa Rican vs Immigrants from Armenia Family Households Correlation Chart
The statistical analysis conducted on geographies consisting of 253,469,677 people shows a slight negative correlation between the proportion of Costa Ricans and percentage of family households in the United States with a correlation coefficient (R) of -0.080 and weighted average of 65.9%. Similarly, the statistical analysis conducted on geographies consisting of 97,683,198 people shows no correlation between the proportion of Immigrants from Armenia and percentage of family households in the United States with a correlation coefficient (R) of -0.030 and weighted average of 63.5%, a difference of 3.8%.
Family Households Correlation Summary
| Measurement | Costa Rican | Immigrants from Armenia |
| Minimum | 41.4% | 39.7% |
| Maximum | 89.7% | 79.9% |
| Range | 48.2% | 40.2% |
| Mean | 68.7% | 63.6% |
| Median | 68.7% | 65.3% |
| Interquartile 25% (IQ1) | 65.6% | 60.6% |
| Interquartile 75% (IQ3) | 71.6% | 68.5% |
| Interquartile Range (IQR) | 6.0% | 7.9% |
| Standard Deviation (Sample) | 8.2% | 8.3% |
| Standard Deviation (Population) | 8.2% | 8.3% |
Similar Demographics by Family Households
Demographics Similar to Costa Ricans by Family Households
In terms of family households, the demographic groups most similar to Costa Ricans are Pima (65.9%, a difference of 0.010%), Fijian (65.9%, a difference of 0.040%), Filipino (65.9%, a difference of 0.040%), Japanese (65.9%, a difference of 0.060%), and Immigrants from Indonesia (66.0%, a difference of 0.070%).
| Demographics | Rating | Rank | Family Households |
| Immigrants | Asia | 100.0 /100 | #58 | Exceptional 66.1% |
| Immigrants | Korea | 100.0 /100 | #59 | Exceptional 66.0% |
| South Americans | 100.0 /100 | #60 | Exceptional 66.0% |
| Danes | 100.0 /100 | #61 | Exceptional 66.0% |
| Central Americans | 100.0 /100 | #62 | Exceptional 66.0% |
| Immigrants | Indonesia | 100.0 /100 | #63 | Exceptional 66.0% |
| Pima | 99.9 /100 | #64 | Exceptional 65.9% |
| Costa Ricans | 99.9 /100 | #65 | Exceptional 65.9% |
| Fijians | 99.9 /100 | #66 | Exceptional 65.9% |
| Filipinos | 99.9 /100 | #67 | Exceptional 65.9% |
| Japanese | 99.9 /100 | #68 | Exceptional 65.9% |
| Malaysians | 99.9 /100 | #69 | Exceptional 65.9% |
| Immigrants | Afghanistan | 99.9 /100 | #70 | Exceptional 65.9% |
| Bhutanese | 99.9 /100 | #71 | Exceptional 65.9% |
| Portuguese | 99.9 /100 | #72 | Exceptional 65.8% |
Demographics Similar to Immigrants from Armenia by Family Households
In terms of family households, the demographic groups most similar to Immigrants from Armenia are Immigrants from Northern Africa (63.5%, a difference of 0.010%), Finnish (63.5%, a difference of 0.030%), Immigrants from Greece (63.5%, a difference of 0.050%), Albanian (63.5%, a difference of 0.050%), and Immigrants from Brazil (63.6%, a difference of 0.060%).
| Demographics | Rating | Rank | Family Households |
| Immigrants | Bahamas | 4.2 /100 | #226 | Tragic 63.6% |
| Trinidadians and Tobagonians | 4.1 /100 | #227 | Tragic 63.6% |
| Blackfeet | 3.6 /100 | #228 | Tragic 63.6% |
| Bulgarians | 3.4 /100 | #229 | Tragic 63.6% |
| Immigrants | Brazil | 3.0 /100 | #230 | Tragic 63.6% |
| Immigrants | Greece | 2.9 /100 | #231 | Tragic 63.5% |
| Immigrants | Northern Africa | 2.6 /100 | #232 | Tragic 63.5% |
| Immigrants | Armenia | 2.6 /100 | #233 | Tragic 63.5% |
| Finns | 2.3 /100 | #234 | Tragic 63.5% |
| Albanians | 2.2 /100 | #235 | Tragic 63.5% |
| Ghanaians | 2.1 /100 | #236 | Tragic 63.5% |
| Comanche | 2.1 /100 | #237 | Tragic 63.5% |
| Immigrants | Zimbabwe | 2.0 /100 | #238 | Tragic 63.5% |
| Aleuts | 1.9 /100 | #239 | Tragic 63.4% |
| South Africans | 1.9 /100 | #240 | Tragic 63.4% |