Kiowa vs French 7th Grade
COMPARE
Kiowa
French
7th Grade
7th Grade Comparison
Kiowa
French
96.7%
7TH GRADE
99.1/ 100
METRIC RATING
85th/ 347
METRIC RANK
97.4%
7TH GRADE
100.0/ 100
METRIC RATING
25th/ 347
METRIC RANK
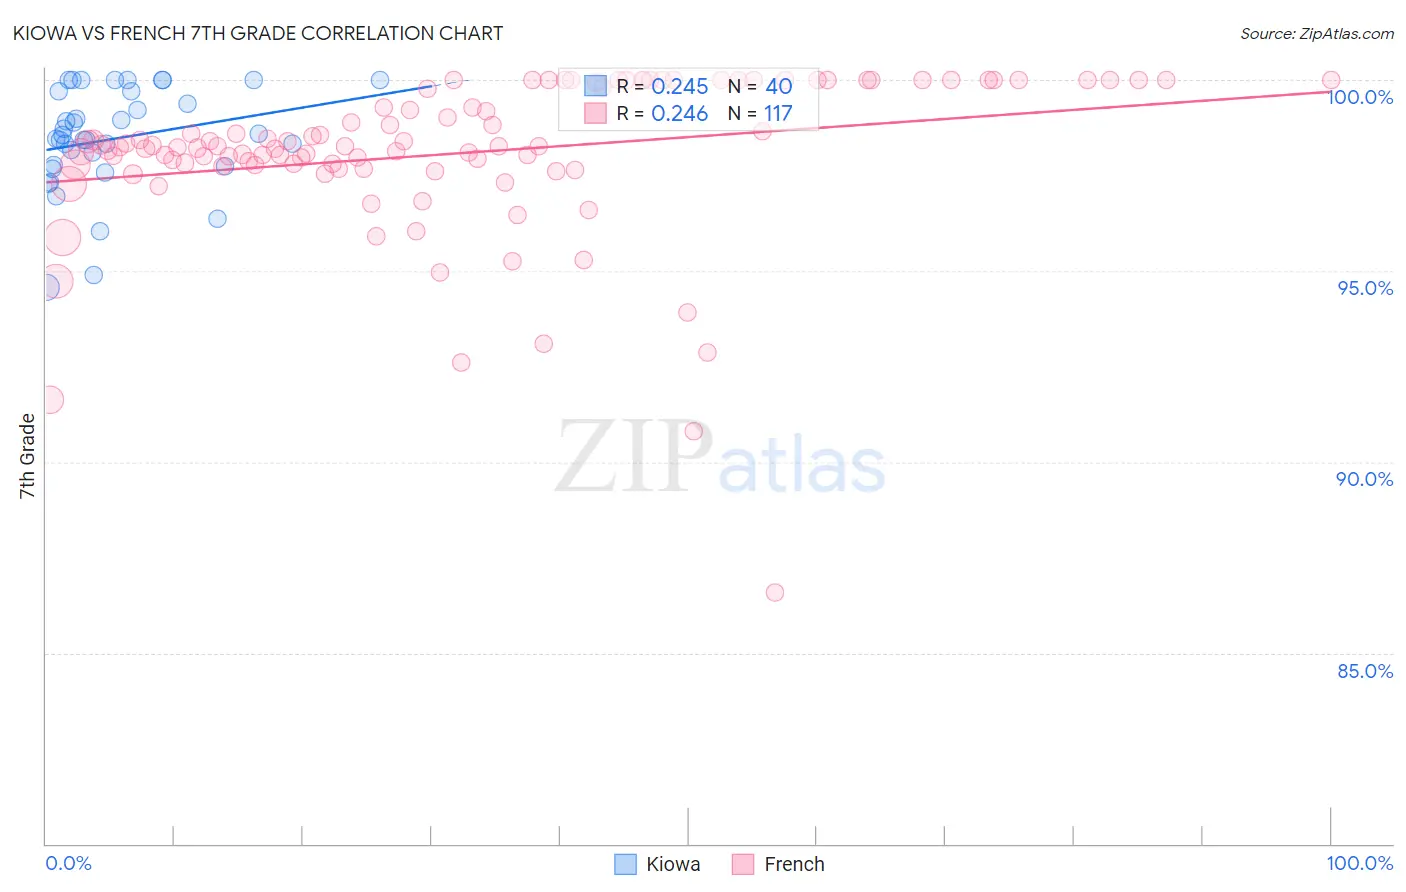
Kiowa vs French 7th Grade Correlation Chart
The statistical analysis conducted on geographies consisting of 56,100,633 people shows a weak positive correlation between the proportion of Kiowa and percentage of population with at least 7th grade education in the United States with a correlation coefficient (R) of 0.245 and weighted average of 96.7%. Similarly, the statistical analysis conducted on geographies consisting of 572,427,255 people shows a weak positive correlation between the proportion of French and percentage of population with at least 7th grade education in the United States with a correlation coefficient (R) of 0.246 and weighted average of 97.4%, a difference of 0.69%.
7th Grade Correlation Summary
| Measurement | Kiowa | French |
| Minimum | 94.6% | 86.6% |
| Maximum | 100.0% | 100.0% |
| Range | 5.4% | 13.4% |
| Mean | 98.5% | 98.1% |
| Median | 98.5% | 98.3% |
| Interquartile 25% (IQ1) | 97.8% | 97.8% |
| Interquartile 75% (IQ3) | 99.7% | 100.0% |
| Interquartile Range (IQR) | 1.9% | 2.2% |
| Standard Deviation (Sample) | 1.4% | 2.1% |
| Standard Deviation (Population) | 1.3% | 2.1% |
Similar Demographics by 7th Grade
Demographics Similar to Kiowa by 7th Grade
In terms of 7th grade, the demographic groups most similar to Kiowa are Romanian (96.7%, a difference of 0.0%), Chickasaw (96.7%, a difference of 0.010%), Icelander (96.7%, a difference of 0.010%), Turkish (96.7%, a difference of 0.010%), and Delaware (96.8%, a difference of 0.020%).
| Demographics | Rating | Rank | 7th Grade |
| Immigrants | Netherlands | 99.3 /100 | #78 | Exceptional 96.8% |
| Cypriots | 99.3 /100 | #79 | Exceptional 96.8% |
| Yugoslavians | 99.3 /100 | #80 | Exceptional 96.8% |
| Delaware | 99.2 /100 | #81 | Exceptional 96.8% |
| Chickasaw | 99.2 /100 | #82 | Exceptional 96.7% |
| Icelanders | 99.1 /100 | #83 | Exceptional 96.7% |
| Romanians | 99.1 /100 | #84 | Exceptional 96.7% |
| Kiowa | 99.1 /100 | #85 | Exceptional 96.7% |
| Turks | 99.1 /100 | #86 | Exceptional 96.7% |
| Immigrants | Belgium | 99.0 /100 | #87 | Exceptional 96.7% |
| Puget Sound Salish | 99.0 /100 | #88 | Exceptional 96.7% |
| Cree | 99.0 /100 | #89 | Exceptional 96.7% |
| Immigrants | South Africa | 98.9 /100 | #90 | Exceptional 96.7% |
| Osage | 98.9 /100 | #91 | Exceptional 96.7% |
| Immigrants | Western Europe | 98.9 /100 | #92 | Exceptional 96.7% |
Demographics Similar to French by 7th Grade
In terms of 7th grade, the demographic groups most similar to French are Welsh (97.4%, a difference of 0.0%), Scotch-Irish (97.4%, a difference of 0.010%), Danish (97.4%, a difference of 0.010%), Croatian (97.4%, a difference of 0.020%), and French Canadian (97.4%, a difference of 0.030%).
| Demographics | Rating | Rank | 7th Grade |
| Tlingit-Haida | 100.0 /100 | #18 | Exceptional 97.5% |
| Lithuanians | 100.0 /100 | #19 | Exceptional 97.5% |
| Yup'ik | 100.0 /100 | #20 | Exceptional 97.4% |
| Inupiat | 100.0 /100 | #21 | Exceptional 97.4% |
| French Canadians | 100.0 /100 | #22 | Exceptional 97.4% |
| Croatians | 100.0 /100 | #23 | Exceptional 97.4% |
| Welsh | 100.0 /100 | #24 | Exceptional 97.4% |
| French | 100.0 /100 | #25 | Exceptional 97.4% |
| Scotch-Irish | 100.0 /100 | #26 | Exceptional 97.4% |
| Danes | 100.0 /100 | #27 | Exceptional 97.4% |
| Sioux | 100.0 /100 | #28 | Exceptional 97.4% |
| Scandinavians | 100.0 /100 | #29 | Exceptional 97.4% |
| Czechs | 100.0 /100 | #30 | Exceptional 97.4% |
| Europeans | 100.0 /100 | #31 | Exceptional 97.3% |
| Italians | 100.0 /100 | #32 | Exceptional 97.3% |