Zip Codes with the Highest Percentage of Population Employed in Transportation in Wilmington, DE
RELATED REPORTS & OPTIONS
Transportation
Wilmington
Compare Zip Codes
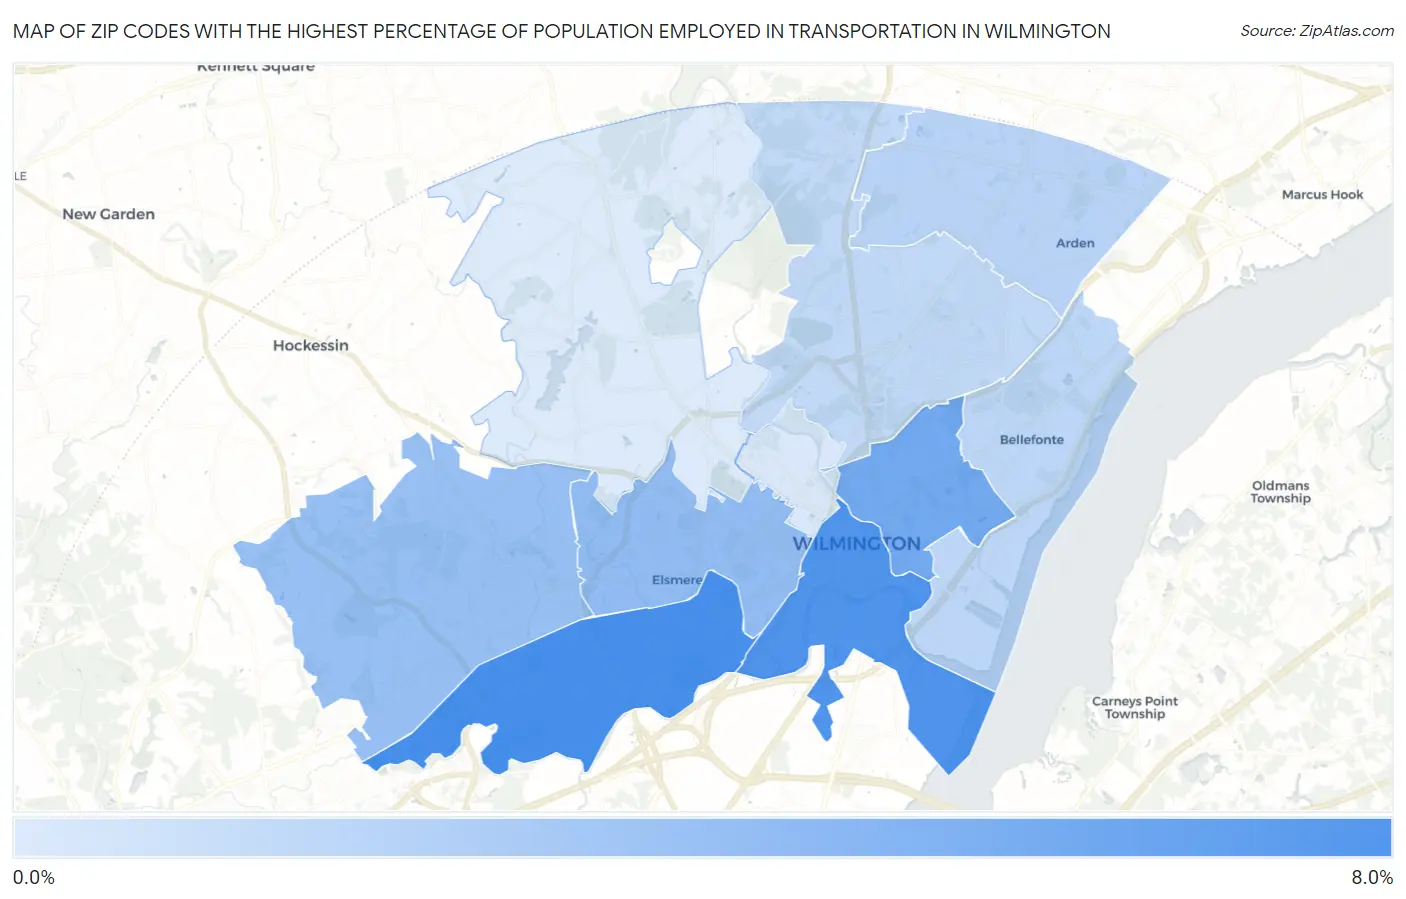
Map of Zip Codes with the Highest Percentage of Population Employed in Transportation in Wilmington
0.0%
8.0%
Zip Codes with the Highest Percentage of Population Employed in Transportation in Wilmington, DE
| Zip Code | % Employed | vs State | vs National | |
| 1. | 19804 | 7.4% | 4.1%(+3.24)#6 | 3.8%(+3.55)#4,717 |
| 2. | 19801 | 7.0% | 4.1%(+2.86)#8 | 3.8%(+3.17)#5,366 |
| 3. | 19802 | 5.4% | 4.1%(+1.24)#15 | 3.8%(+1.55)#9,152 |
| 4. | 19805 | 4.1% | 4.1%(-0.033)#26 | 3.8%(+0.273)#13,939 |
| 5. | 19808 | 3.7% | 4.1%(-0.386)#32 | 3.8%(-0.080)#15,648 |
| 6. | 19810 | 2.4% | 4.1%(-1.76)#44 | 3.8%(-1.46)#22,216 |
| 7. | 19809 | 2.1% | 4.1%(-1.99)#47 | 3.8%(-1.68)#23,136 |
| 8. | 19803 | 2.0% | 4.1%(-2.12)#48 | 3.8%(-1.82)#23,674 |
| 9. | 19806 | 0.91% | 4.1%(-3.21)#54 | 3.8%(-2.90)#27,039 |
| 10. | 19807 | 0.79% | 4.1%(-3.34)#55 | 3.8%(-3.03)#27,311 |
1
Common Questions
What are the Top 5 Zip Codes with the Highest Percentage of Population Employed in Transportation in Wilmington, DE?
Top 5 Zip Codes with the Highest Percentage of Population Employed in Transportation in Wilmington, DE are:
What zip code has the Highest Percentage of Population Employed in Transportation in Wilmington, DE?
19804 has the Highest Percentage of Population Employed in Transportation in Wilmington, DE with 7.4%.
What is the Percentage of Population Employed in Transportation in Wilmington, DE?
Percentage of Population Employed in Transportation in Wilmington is 4.6%.
What is the Percentage of Population Employed in Transportation in Delaware?
Percentage of Population Employed in Transportation in Delaware is 4.1%.
What is the Percentage of Population Employed in Transportation in the United States?
Percentage of Population Employed in Transportation in the United States is 3.8%.