Zip Codes with the Highest Percentage of Population Employed in Farming, Fishing & Forestry in Wilmington, DE
RELATED REPORTS & OPTIONS
Farming, Fishing & Forestry
Wilmington
Compare Zip Codes
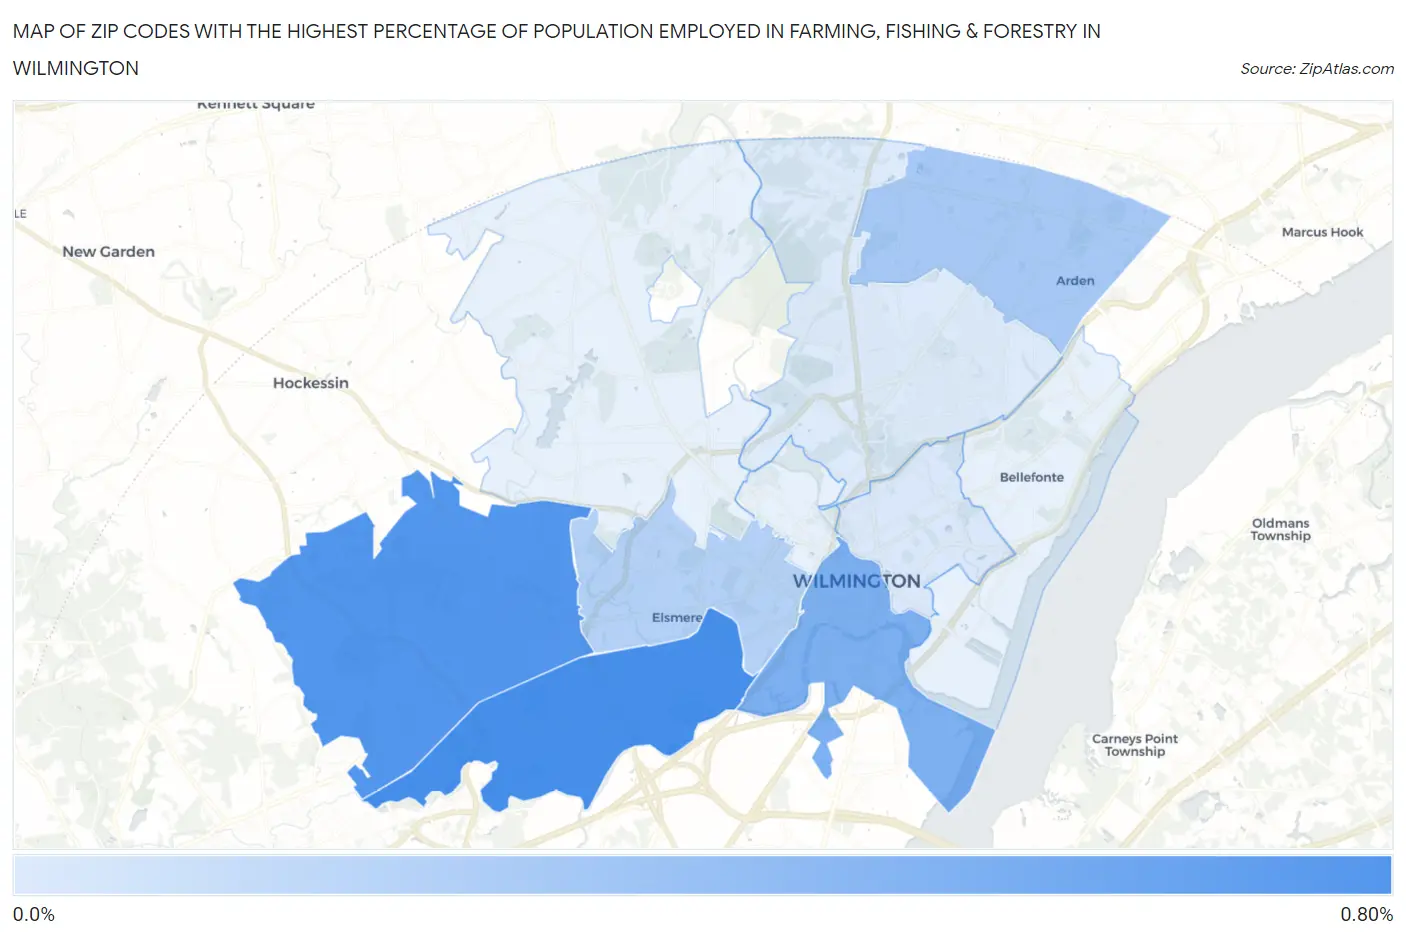
Map of Zip Codes with the Highest Percentage of Population Employed in Farming, Fishing & Forestry in Wilmington
0.0%
0.80%
Zip Codes with the Highest Percentage of Population Employed in Farming, Fishing & Forestry in Wilmington, DE
| Zip Code | % Employed | vs State | vs National | |
| 1. | 19804 | 0.65% | 0.46%(+0.187)#16 | 0.61%(+0.046)#11,689 |
| 2. | 19808 | 0.61% | 0.46%(+0.145)#18 | 0.61%(+0.003)#11,974 |
| 3. | 19801 | 0.44% | 0.46%(-0.024)#22 | 0.61%(-0.165)#13,382 |
| 4. | 19810 | 0.27% | 0.46%(-0.198)#30 | 0.61%(-0.339)#15,206 |
| 5. | 19805 | 0.21% | 0.46%(-0.250)#33 | 0.61%(-0.391)#15,922 |
| 6. | 19802 | 0.056% | 0.46%(-0.408)#35 | 0.61%(-0.549)#18,550 |
| 7. | 19803 | 0.049% | 0.46%(-0.415)#37 | 0.61%(-0.557)#18,684 |
1
Common Questions
What are the Top 5 Zip Codes with the Highest Percentage of Population Employed in Farming, Fishing & Forestry in Wilmington, DE?
Top 5 Zip Codes with the Highest Percentage of Population Employed in Farming, Fishing & Forestry in Wilmington, DE are:
What zip code has the Highest Percentage of Population Employed in Farming, Fishing & Forestry in Wilmington, DE?
19804 has the Highest Percentage of Population Employed in Farming, Fishing & Forestry in Wilmington, DE with 0.65%.
What is the Percentage of Population Employed in Farming, Fishing & Forestry in Wilmington, DE?
Percentage of Population Employed in Farming, Fishing & Forestry in Wilmington is 0.14%.
What is the Percentage of Population Employed in Farming, Fishing & Forestry in Delaware?
Percentage of Population Employed in Farming, Fishing & Forestry in Delaware is 0.46%.
What is the Percentage of Population Employed in Farming, Fishing & Forestry in the United States?
Percentage of Population Employed in Farming, Fishing & Forestry in the United States is 0.61%.