Zip Codes with the Highest Percentage of Population Employed in Agriculture, Fishing & Hunting in Dover, DE
RELATED REPORTS & OPTIONS
Agriculture, Fishing & Hunting
Dover
Compare Zip Codes
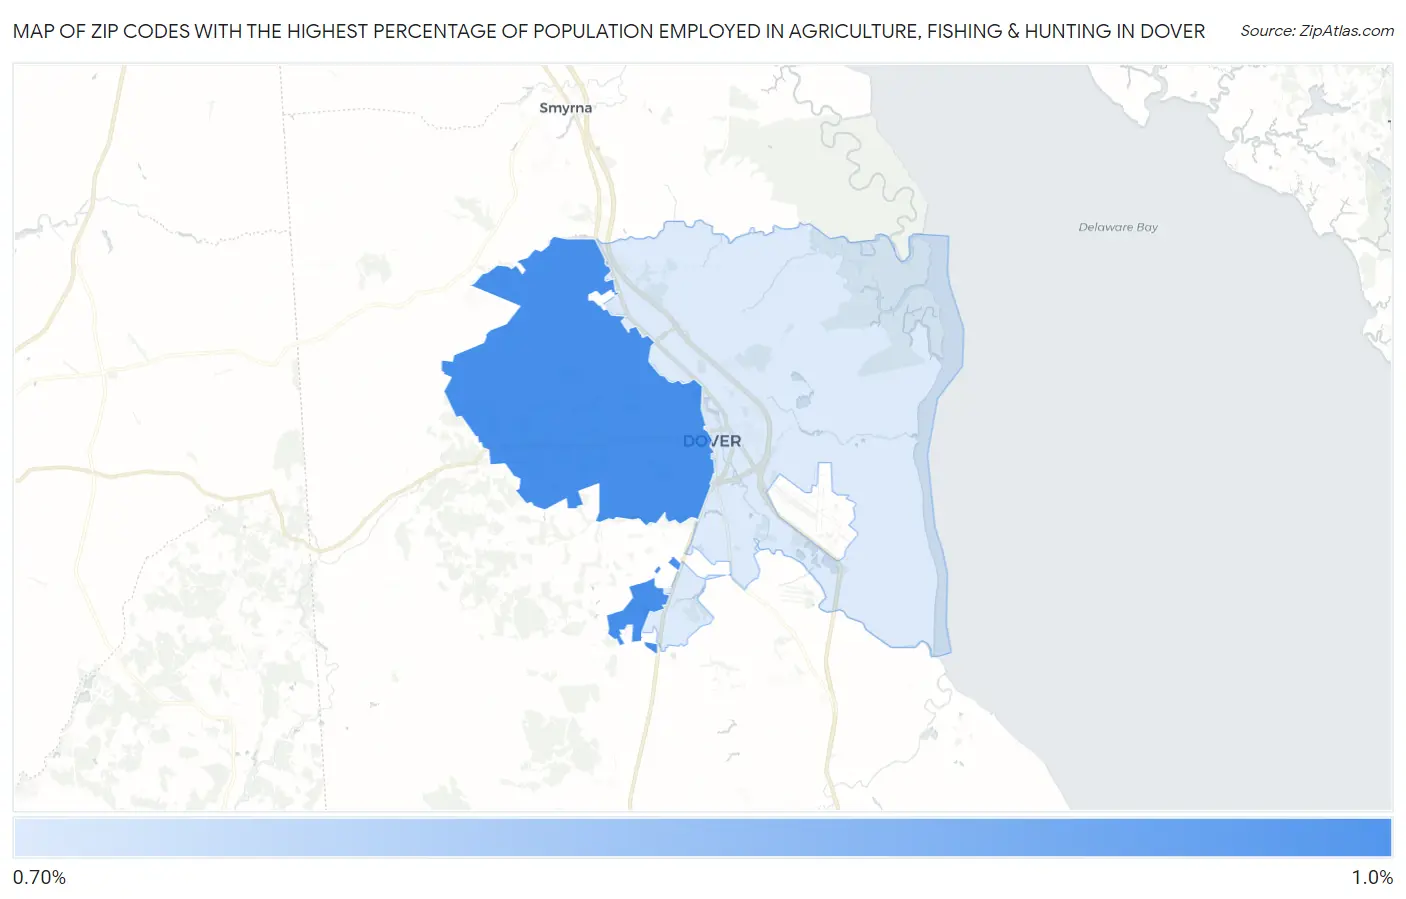
Map of Zip Codes with the Highest Percentage of Population Employed in Agriculture, Fishing & Hunting in Dover
0.0%
1.0%
Zip Codes with the Highest Percentage of Population Employed in Agriculture, Fishing & Hunting in Dover, DE
| Zip Code | % Employed | vs State | vs National | |
| 1. | 19904 | 0.92% | 1.0%(-0.123)#28 | 1.2%(-0.284)#16,634 |
| 2. | 19901 | 0.70% | 1.0%(-0.335)#32 | 1.2%(-0.496)#17,832 |
1
Common Questions
What are the Top Zip Codes with the Highest Percentage of Population Employed in Agriculture, Fishing & Hunting in Dover, DE?
Top Zip Codes with the Highest Percentage of Population Employed in Agriculture, Fishing & Hunting in Dover, DE are:
What zip code has the Highest Percentage of Population Employed in Agriculture, Fishing & Hunting in Dover, DE?
19904 has the Highest Percentage of Population Employed in Agriculture, Fishing & Hunting in Dover, DE with 0.92%.
What is the Percentage of Population Employed in Agriculture, Fishing & Hunting in Dover, DE?
Percentage of Population Employed in Agriculture, Fishing & Hunting in Dover is 0.12%.
What is the Percentage of Population Employed in Agriculture, Fishing & Hunting in Delaware?
Percentage of Population Employed in Agriculture, Fishing & Hunting in Delaware is 1.0%.
What is the Percentage of Population Employed in Agriculture, Fishing & Hunting in the United States?
Percentage of Population Employed in Agriculture, Fishing & Hunting in the United States is 1.2%.