Cities with the Highest Poverty Level in Delaware
RELATED REPORTS & OPTIONS
Highest Poverty
Delaware
Compare Cities
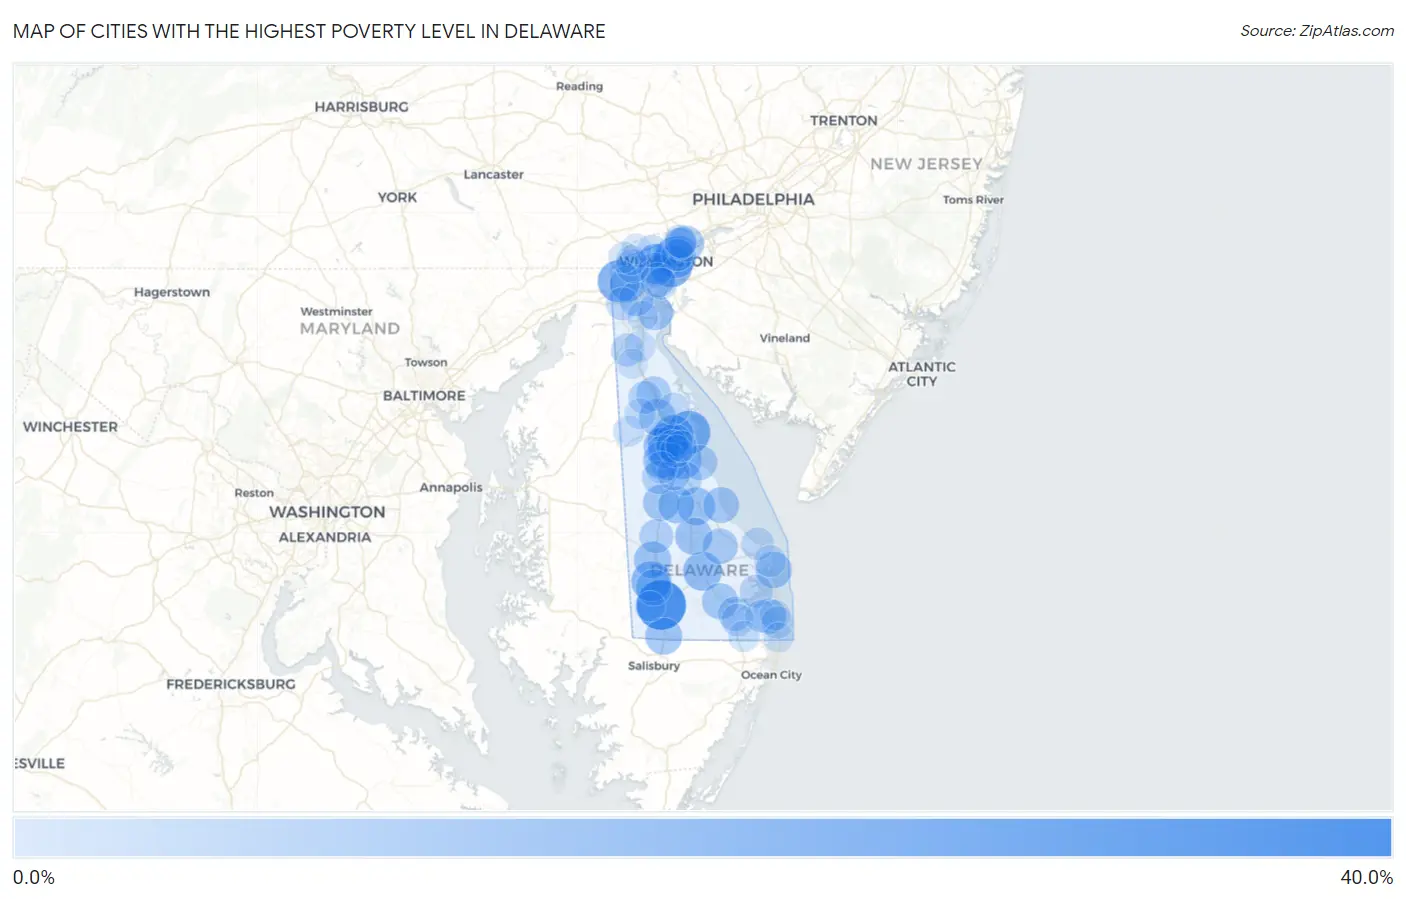
Map of Cities with the Highest Poverty Level in Delaware
0.0%
40.0%
Cities with the Highest Poverty Level in Delaware
| City | Poverty | vs State | vs National | |
| 1. | Laurel | 39.6% | 11.1%(+28.5)#1 | 12.5%(+27.0)#1,735 |
| 2. | Little Creek | 26.8% | 11.1%(+15.7)#2 | 12.5%(+14.3)#4,376 |
| 3. | Newark | 24.4% | 11.1%(+13.3)#3 | 12.5%(+11.9)#5,297 |
| 4. | Wilmington | 24.3% | 11.1%(+13.1)#4 | 12.5%(+11.7)#5,364 |
| 5. | Edgemoor | 23.5% | 11.1%(+12.4)#5 | 12.5%(+11.0)#5,695 |
| 6. | Elsmere | 20.4% | 11.1%(+9.26)#6 | 12.5%(+7.85)#7,406 |
| 7. | Seaford | 20.2% | 11.1%(+9.11)#7 | 12.5%(+7.70)#7,504 |
| 8. | Dover | 20.0% | 11.1%(+8.88)#8 | 12.5%(+7.47)#7,620 |
| 9. | Rodney Village | 19.9% | 11.1%(+8.82)#9 | 12.5%(+7.40)#7,677 |
| 10. | Georgetown | 17.8% | 11.1%(+6.69)#10 | 12.5%(+5.28)#9,143 |
| 11. | Magnolia | 16.8% | 11.1%(+5.67)#11 | 12.5%(+4.26)#9,937 |
| 12. | Wyoming | 16.2% | 11.1%(+5.03)#12 | 12.5%(+3.62)#10,499 |
| 13. | Milford | 16.0% | 11.1%(+4.83)#13 | 12.5%(+3.42)#10,655 |
| 14. | Kent Acres | 15.8% | 11.1%(+4.65)#14 | 12.5%(+3.24)#10,804 |
| 15. | Woodside East | 14.9% | 11.1%(+3.76)#15 | 12.5%(+2.35)#11,665 |
| 16. | Ellendale | 14.8% | 11.1%(+3.66)#16 | 12.5%(+2.24)#11,760 |
| 17. | Cheswold | 14.7% | 11.1%(+3.58)#17 | 12.5%(+2.17)#11,846 |
| 18. | Bridgeville | 14.4% | 11.1%(+3.31)#18 | 12.5%(+1.90)#12,096 |
| 19. | Delmar | 14.4% | 11.1%(+3.27)#19 | 12.5%(+1.86)#12,124 |
| 20. | Woodside | 13.8% | 11.1%(+2.71)#20 | 12.5%(+1.30)#12,646 |
| 21. | Harrington | 13.3% | 11.1%(+2.19)#21 | 12.5%(+0.781)#13,183 |
| 22. | Houston | 13.2% | 11.1%(+2.07)#22 | 12.5%(+0.655)#13,312 |
| 23. | Dewey Beach | 13.1% | 11.1%(+1.97)#23 | 12.5%(+0.557)#13,398 |
| 24. | Blades | 12.9% | 11.1%(+1.79)#24 | 12.5%(+0.382)#13,597 |
| 25. | Millsboro | 12.8% | 11.1%(+1.64)#25 | 12.5%(+0.232)#13,746 |
| 26. | Brookside | 12.2% | 11.1%(+1.10)#26 | 12.5%(-0.307)#14,319 |
| 27. | Slaughter Beach | 12.2% | 11.1%(+1.09)#27 | 12.5%(-0.321)#14,327 |
| 28. | Claymont | 11.8% | 11.1%(+0.675)#28 | 12.5%(-0.736)#14,801 |
| 29. | Milton | 11.4% | 11.1%(+0.313)#29 | 12.5%(-1.10)#15,232 |
| 30. | Delaware City | 11.3% | 11.1%(+0.212)#30 | 12.5%(-1.20)#15,382 |
| 31. | Ocean View | 11.0% | 11.1%(-0.121)#31 | 12.5%(-1.53)#15,780 |
| 32. | Bowers | 10.1% | 11.1%(-1.00)#32 | 12.5%(-2.42)#16,919 |
| 33. | Smyrna | 10.0% | 11.1%(-1.13)#33 | 12.5%(-2.55)#17,097 |
| 34. | Newport | 9.9% | 11.1%(-1.25)#34 | 12.5%(-2.67)#17,248 |
| 35. | Wilmington Manor | 9.8% | 11.1%(-1.33)#35 | 12.5%(-2.74)#17,345 |
| 36. | Bear | 9.3% | 11.1%(-1.78)#36 | 12.5%(-3.19)#17,928 |
| 37. | Dagsboro | 8.9% | 11.1%(-2.25)#37 | 12.5%(-3.66)#18,558 |
| 38. | Greenwood | 8.7% | 11.1%(-2.41)#38 | 12.5%(-3.82)#18,795 |
| 39. | Frederica | 8.4% | 11.1%(-2.73)#39 | 12.5%(-4.14)#19,234 |
| 40. | Pike Creek Valley | 7.9% | 11.1%(-3.26)#40 | 12.5%(-4.67)#19,915 |
| 41. | Felton | 7.7% | 11.1%(-3.46)#41 | 12.5%(-4.88)#20,211 |
| 42. | Clayton | 7.2% | 11.1%(-3.90)#42 | 12.5%(-5.31)#20,826 |
| 43. | Camden | 7.2% | 11.1%(-3.91)#43 | 12.5%(-5.33)#20,842 |
| 44. | Riverview | 7.0% | 11.1%(-4.12)#44 | 12.5%(-5.53)#21,129 |
| 45. | Middletown | 6.8% | 11.1%(-4.35)#45 | 12.5%(-5.76)#21,481 |
| 46. | Long Neck | 6.7% | 11.1%(-4.41)#46 | 12.5%(-5.82)#21,553 |
| 47. | Glasgow | 6.6% | 11.1%(-4.57)#47 | 12.5%(-5.98)#21,785 |
| 48. | Arden | 6.1% | 11.1%(-5.02)#48 | 12.5%(-6.43)#22,455 |
| 49. | Lewes | 5.8% | 11.1%(-5.30)#49 | 12.5%(-6.71)#22,872 |
| 50. | Frankford | 5.7% | 11.1%(-5.42)#50 | 12.5%(-6.83)#23,053 |
| 51. | Millville | 5.6% | 11.1%(-5.56)#51 | 12.5%(-6.97)#23,243 |
| 52. | Highland Acres | 5.5% | 11.1%(-5.57)#52 | 12.5%(-6.98)#23,274 |
| 53. | Rising Sun Lebanon | 5.4% | 11.1%(-5.71)#53 | 12.5%(-7.12)#23,465 |
| 54. | South Bethany | 5.3% | 11.1%(-5.82)#54 | 12.5%(-7.23)#23,641 |
| 55. | Viola | 5.1% | 11.1%(-6.06)#55 | 12.5%(-7.47)#23,966 |
| 56. | Greenville | 5.0% | 11.1%(-6.16)#56 | 12.5%(-7.58)#24,116 |
| 57. | Bellefonte | 4.9% | 11.1%(-6.20)#57 | 12.5%(-7.61)#24,144 |
| 58. | Ardencroft | 4.7% | 11.1%(-6.39)#58 | 12.5%(-7.80)#24,419 |
| 59. | Leipsic | 4.7% | 11.1%(-6.44)#59 | 12.5%(-7.86)#24,497 |
| 60. | Rehoboth Beach | 4.6% | 11.1%(-6.52)#60 | 12.5%(-7.93)#24,600 |
| 61. | New Castle | 4.3% | 11.1%(-6.78)#61 | 12.5%(-8.19)#24,980 |
| 62. | Ardentown | 4.1% | 11.1%(-7.03)#62 | 12.5%(-8.44)#25,299 |
| 63. | Dover Base Housing | 3.3% | 11.1%(-7.83)#63 | 12.5%(-9.24)#26,413 |
| 64. | Selbyville | 3.1% | 11.1%(-7.99)#64 | 12.5%(-9.40)#26,627 |
| 65. | Hartly | 3.1% | 11.1%(-8.02)#65 | 12.5%(-9.43)#26,658 |
| 66. | North Star | 2.9% | 11.1%(-8.18)#66 | 12.5%(-9.60)#26,850 |
| 67. | Odessa | 2.8% | 11.1%(-8.30)#67 | 12.5%(-9.71)#26,978 |
| 68. | Kenton | 2.8% | 11.1%(-8.37)#68 | 12.5%(-9.78)#27,061 |
| 69. | Bethany Beach | 2.6% | 11.1%(-8.49)#69 | 12.5%(-9.90)#27,197 |
| 70. | Lincoln | 2.5% | 11.1%(-8.62)#70 | 12.5%(-10.0)#27,337 |
| 71. | St Georges | 2.1% | 11.1%(-8.98)#71 | 12.5%(-10.4)#27,723 |
| 72. | Hockessin | 1.9% | 11.1%(-9.27)#72 | 12.5%(-10.7)#28,016 |
| 73. | Pike Creek | 1.6% | 11.1%(-9.48)#73 | 12.5%(-10.9)#28,188 |
| 74. | Bethel | 1.6% | 11.1%(-9.53)#74 | 12.5%(-10.9)#28,231 |
| 75. | Townsend | 1.5% | 11.1%(-9.61)#75 | 12.5%(-11.0)#28,301 |
| 76. | Fenwick Island | 1.1% | 11.1%(-9.98)#76 | 12.5%(-11.4)#28,567 |
1
Common Questions
What are the Top 10 Cities with the Highest Poverty Level in Delaware?
Top 10 Cities with the Highest Poverty Level in Delaware are:
#1
39.6%
#2
26.8%
#3
24.4%
#4
24.3%
#5
23.5%
#6
20.4%
#7
20.2%
#8
20.0%
#9
19.9%
#10
17.8%
What city has the Highest Poverty Level in Delaware?
Laurel has the Highest Poverty Level in Delaware with 39.6%.
What is the Poverty Level in the State of Delaware?
Poverty Level in Delaware is 11.1%.
What is the Poverty Level in the United States?
Poverty Level in the United States is 12.5%.