Zip Codes with the Highest Percentage of Households Heated by Electricity in Storrs Mansfield, CT
RELATED REPORTS & OPTIONS
Electrical Heating
Storrs Mansfield
Compare Zip Codes
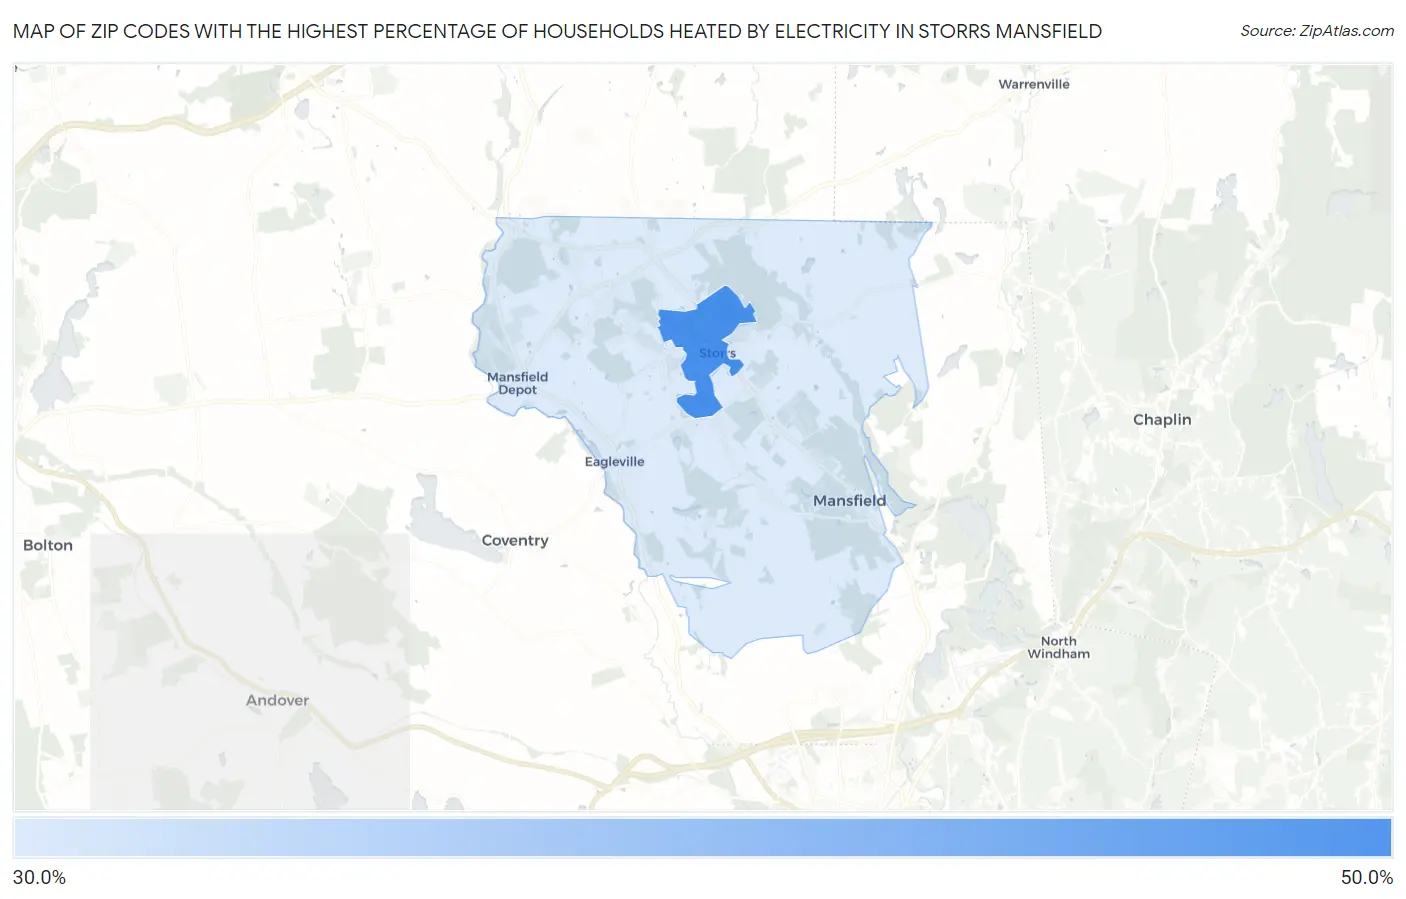
Map of Zip Codes with the Highest Percentage of Households Heated by Electricity in Storrs Mansfield
0.0%
50.0%
Zip Codes with the Highest Percentage of Households Heated by Electricity in Storrs Mansfield, CT
| Zip Code | Electrical Heating | vs State | vs National | |
| 1. | 06269 | 42.1% | 17.3%(+24.8)#6 | 40.2%(+1.90)#12,111 |
| 2. | 06268 | 32.8% | 17.3%(+15.5)#16 | 40.2%(-7.40)#14,970 |
1
Common Questions
What are the Top Zip Codes with the Highest Percentage of Households Heated by Electricity in Storrs Mansfield, CT?
Top Zip Codes with the Highest Percentage of Households Heated by Electricity in Storrs Mansfield, CT are:
What zip code has the Highest Percentage of Households Heated by Electricity in Storrs Mansfield, CT?
06269 has the Highest Percentage of Households Heated by Electricity in Storrs Mansfield, CT with 42.1%.
What is the Percentage of Households Heated by Electricity in Connecticut?
Percentage of Households Heated by Electricity in Connecticut is 17.3%.
What is the Percentage of Households Heated by Electricity in the United States?
Percentage of Households Heated by Electricity in the United States is 40.2%.