Zip Codes with the Highest Percentage of Population Employed in Arts, Entertainment & Recreation in Stamford, CT

RELATED REPORTS & OPTIONS

Arts, Entertainment & Recreation
Population
Families and Households
Female Fertility
Female Fertility (Unmarried)
Race (Community Size)
Race (Percentage)
Ancestry (Community Size)
AfricanAlbanianAmericanArabArgentineanArmenianAustralianAustrianBarbadianBelgianBhutaneseBolivianBrazilianBritishBritish West IndianBulgarianBurmeseCanadianCentral AmericanCentral American IndianCherokeeChileanColombianCosta RicanCroatianCubanCzechCzechoslovakianDanishDominicanDutchEastern EuropeanEcuadorianEgyptianEnglishEuropeanFilipinoFinnishFrenchFrench CanadianGermanGhanaianGreekGuatemalanGuyaneseHaitianHonduranHungarianIndian (Asian)IranianIraqiIrishIsraeliItalianJamaicanKoreanLaotianLatvianLebaneseLithuanianMalteseMexicanMexican American IndianMongolianMoroccanNicaraguanNigerianNorthern EuropeanNorwegianPakistaniPalestinianParaguayanPeruvianPolishPortuguesePuerto RicanRomanianRussianSalvadoranScandinavianScotch-IrishScottishSerbianSlovakSloveneSouth AfricanSouth AmericanSouth American IndianSpaniardSri LankanSubsaharan AfricanSwedishSwissSyrianThaiTrinidadian and TobagonianUkrainianUruguayanVenezuelanWelshWest IndianYugoslavian
Ancestry (Percentage)
AfricanAlbanianAmericanArabArgentineanArmenianAustralianAustrianBarbadianBelgianBhutaneseBolivianBrazilianBritishBritish West IndianBulgarianBurmeseCanadianCentral AmericanCentral American IndianCherokeeChileanColombianCosta RicanCroatianCubanCzechCzechoslovakianDanishDominicanDutchEastern EuropeanEcuadorianEgyptianEnglishEuropeanFilipinoFinnishFrenchFrench CanadianGermanGhanaianGreekGuatemalanGuyaneseHaitianHonduranHungarianIndian (Asian)IranianIraqiIrishIsraeliItalianJamaicanKoreanLaotianLatvianLebaneseLithuanianMalteseMexicanMexican American IndianMongolianMoroccanNicaraguanNigerianNorthern EuropeanNorwegianPakistaniPalestinianParaguayanPeruvianPolishPortuguesePuerto RicanRomanianRussianSalvadoranScandinavianScotch-IrishScottishSerbianSlovakSloveneSouth AfricanSouth AmericanSouth American IndianSpaniardSri LankanSubsaharan AfricanSwedishSwissSyrianThaiTrinidadian and TobagonianUkrainianUruguayanVenezuelanWelshWest IndianYugoslavian
Immigrant Origin (Total)
Immigrant Origin (Percentage)
Income
Income (Families)
Income (Households)
Poverty
Poverty (Families)
Unemployment
Employment Occupations
Employment Industries
Employer Class
Commute Time
Commute Means
School Enrollment
Education by Degree Field
Occupancy
Finances
Physical Characteristics
Stamford
Compare Zip Codes
Comparison Subject

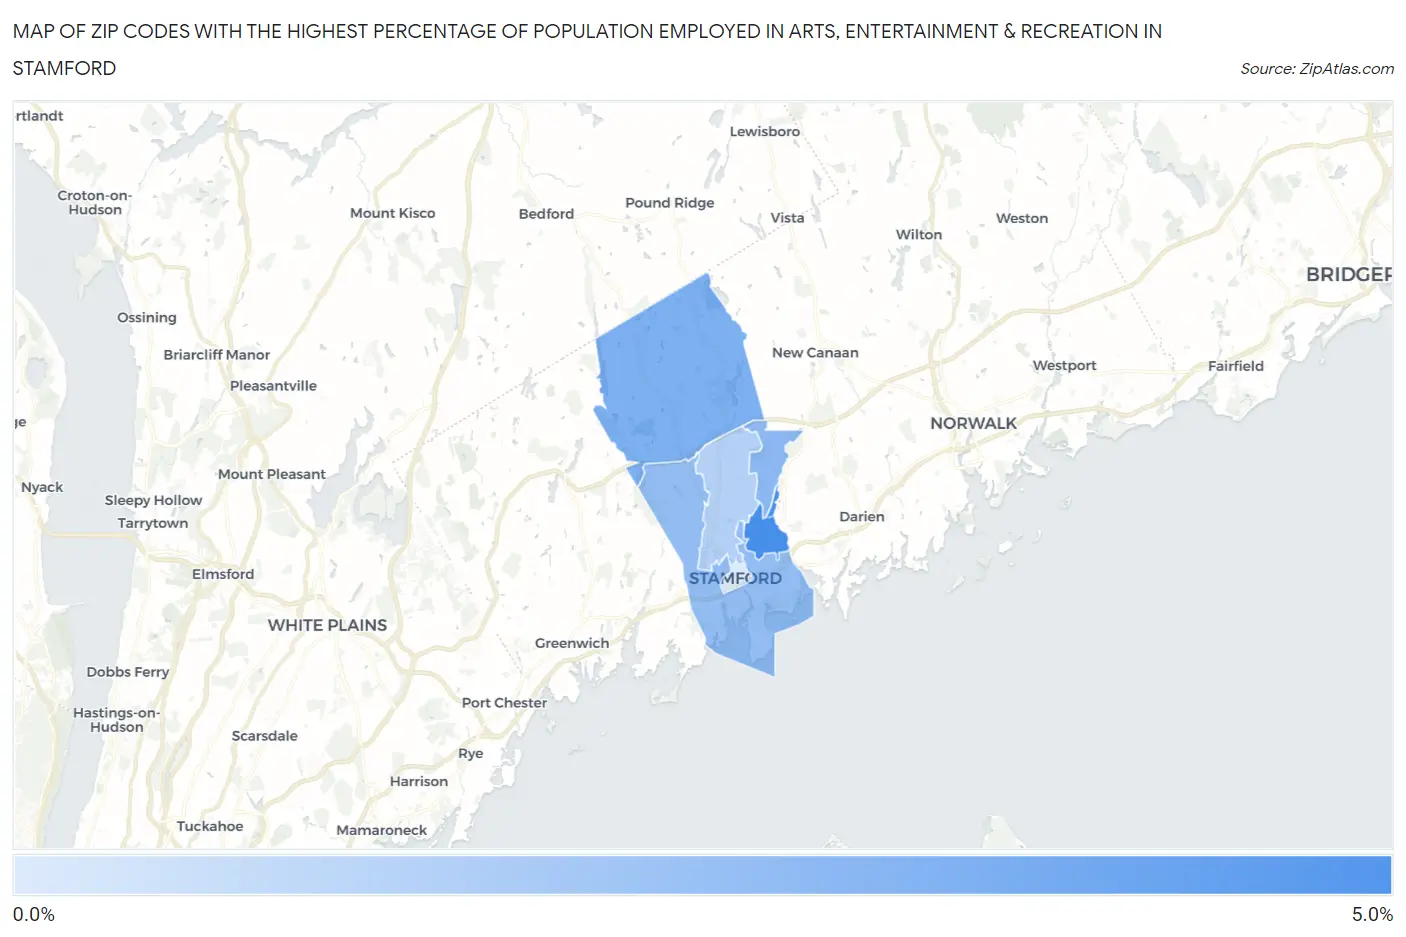
Map of Zip Codes with the Highest Percentage of Population Employed in Arts, Entertainment & Recreation in Stamford

0.0%
5.0%
Zip Codes with the Highest Percentage of Population Employed in Arts, Entertainment & Recreation in Stamford Map

Zip Codes with the Highest Percentage of Population Employed in Arts, Entertainment & Recreation in Stamford, CT

Zip Code % Employed vs State vs National
1.069064.5%2.5%(+2.02)#392.1%(+2.41)#2,752
2.069033.1%2.5%(+0.670)#752.1%(+1.06)#4,938
3.069072.8%2.5%(+0.292)#952.1%(+0.685)#6,107
4.069022.6%2.5%(+0.109)#1062.1%(+0.501)#6,824
5.069051.8%2.5%(-0.685)#1532.1%(-0.292)#11,078
6.069010.74%2.5%(-1.74)#2272.1%(-1.34)#18,861

Common Questions

What are the Top 5 Zip Codes with the Highest Percentage of Population Employed in Arts, Entertainment & Recreation in Stamford, CT?
Top 5 Zip Codes with the Highest Percentage of Population Employed in Arts, Entertainment & Recreation in Stamford, CT are:
#1
4.5%
#2
3.1%
#3
2.8%
#4
2.6%
#5
1.8%
What zip code has the Highest Percentage of Population Employed in Arts, Entertainment & Recreation in Stamford, CT?
06906 has the Highest Percentage of Population Employed in Arts, Entertainment & Recreation in Stamford, CT with 4.5%.
What is the Percentage of Population Employed in Arts, Entertainment & Recreation in Stamford, CT?
Percentage of Population Employed in Arts, Entertainment & Recreation in Stamford is 2.5%.
What is the Percentage of Population Employed in Arts, Entertainment & Recreation in Connecticut?
Percentage of Population Employed in Arts, Entertainment & Recreation in Connecticut is 2.5%.
What is the Percentage of Population Employed in Arts, Entertainment & Recreation in the United States?
Percentage of Population Employed in Arts, Entertainment & Recreation in the United States is 2.1%.