Zip Codes with the Highest Percentage of Black / African American Population in Greenwich, CT
RELATED REPORTS & OPTIONS
Black / African American
Greenwich
Compare Zip Codes
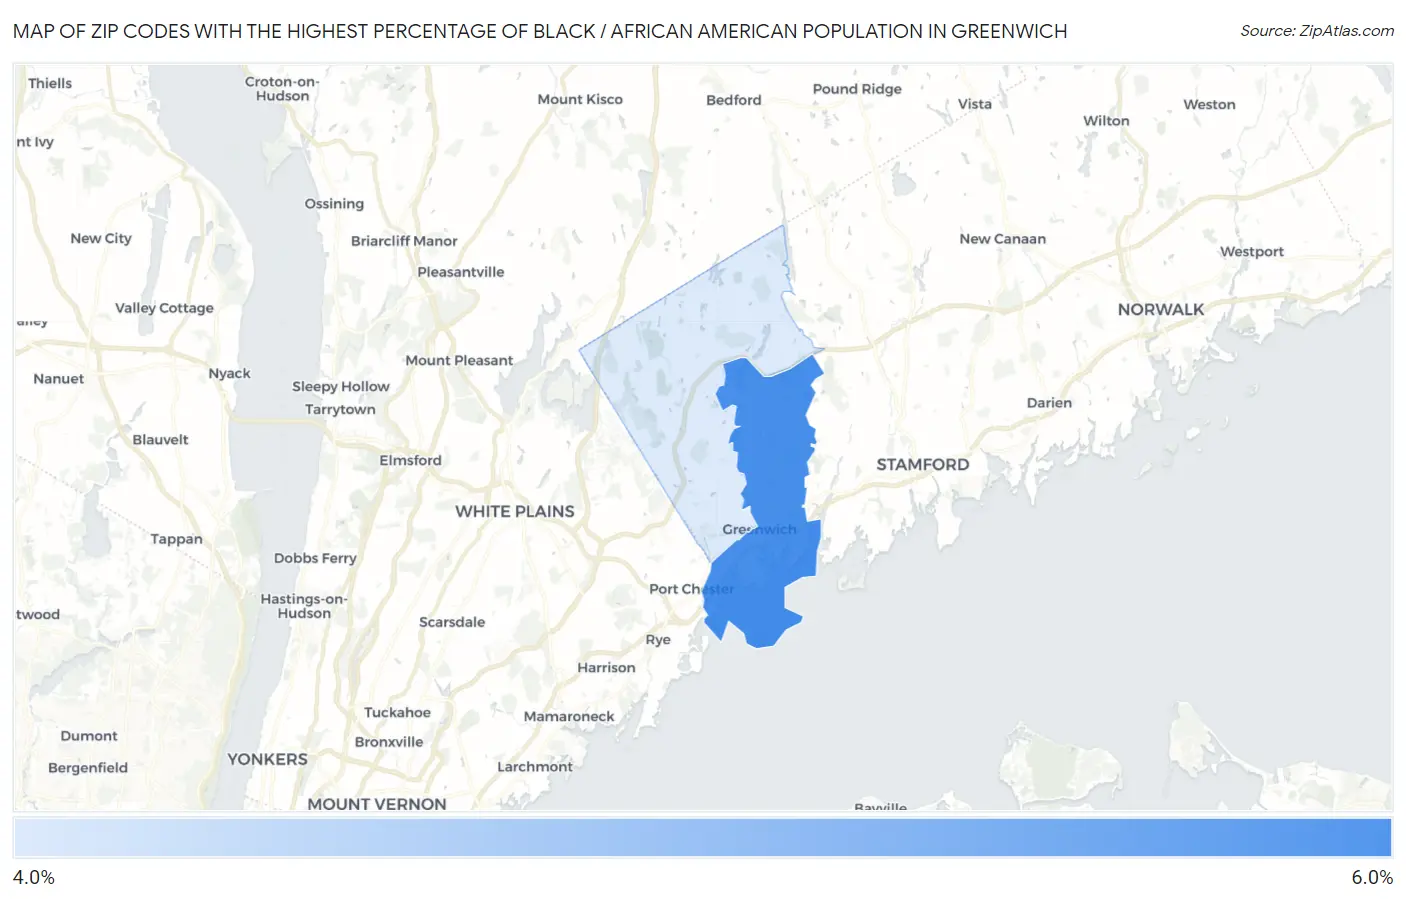
Map of Zip Codes with the Highest Percentage of Black / African American Population in Greenwich
4.3%
5.3%
Zip Codes with the Highest Percentage of Black / African American Population in Greenwich, CT
| Zip Code | Black / African American | vs State | vs National | |
| 1. | 06830 | 5.3% | 10.7%(-5.36)#83 | 12.5%(-7.16)#9,296 |
| 2. | 06831 | 4.3% | 10.7%(-6.34)#103 | 12.5%(-8.14)#10,177 |
1
Common Questions
What are the Top Zip Codes with the Highest Percentage of Black / African American Population in Greenwich, CT?
Top Zip Codes with the Highest Percentage of Black / African American Population in Greenwich, CT are:
What zip code has the Highest Percentage of Black / African American Population in Greenwich, CT?
06830 has the Highest Percentage of Black / African American Population in Greenwich, CT with 5.3%.
What is the Percentage of Black / African American Population in Greenwich, CT?
Percentage of Black / African American Population in Greenwich is 6.4%.
What is the Percentage of Black / African American Population in Connecticut?
Percentage of Black / African American Population in Connecticut is 10.7%.
What is the Percentage of Black / African American Population in the United States?
Percentage of Black / African American Population in the United States is 12.5%.