Zip Codes with the Highest Percentage of Population Employed in Farming, Fishing & Forestry in Bridgeport, CT
RELATED REPORTS & OPTIONS
Farming, Fishing & Forestry
Bridgeport
Compare Zip Codes
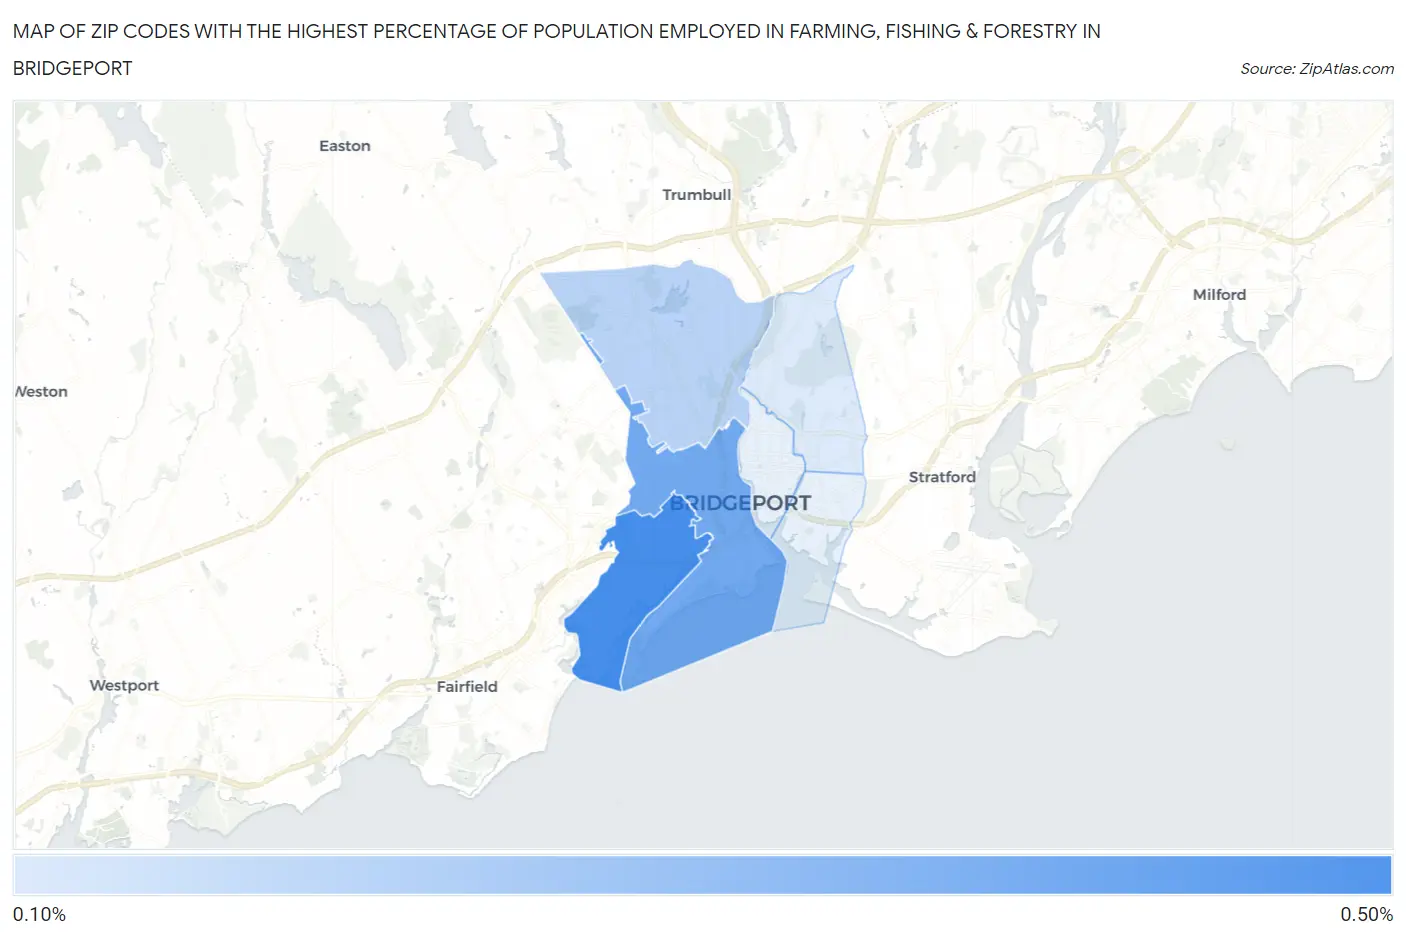
Map of Zip Codes with the Highest Percentage of Population Employed in Farming, Fishing & Forestry in Bridgeport
0.0%
0.50%
Zip Codes with the Highest Percentage of Population Employed in Farming, Fishing & Forestry in Bridgeport, CT
| Zip Code | % Employed | vs State | vs National | |
| 1. | 06605 | 0.43% | 0.18%(+0.251)#42 | 0.61%(-0.177)#13,512 |
| 2. | 06604 | 0.34% | 0.18%(+0.164)#52 | 0.61%(-0.263)#14,341 |
| 3. | 06606 | 0.20% | 0.18%(+0.025)#76 | 0.61%(-0.403)#16,094 |
| 4. | 06610 | 0.13% | 0.18%(-0.050)#95 | 0.61%(-0.477)#17,293 |
1
Common Questions
What are the Top 5 Zip Codes with the Highest Percentage of Population Employed in Farming, Fishing & Forestry in Bridgeport, CT?
Top 5 Zip Codes with the Highest Percentage of Population Employed in Farming, Fishing & Forestry in Bridgeport, CT are:
What zip code has the Highest Percentage of Population Employed in Farming, Fishing & Forestry in Bridgeport, CT?
06605 has the Highest Percentage of Population Employed in Farming, Fishing & Forestry in Bridgeport, CT with 0.43%.
What is the Percentage of Population Employed in Farming, Fishing & Forestry in Bridgeport, CT?
Percentage of Population Employed in Farming, Fishing & Forestry in Bridgeport is 0.24%.
What is the Percentage of Population Employed in Farming, Fishing & Forestry in Connecticut?
Percentage of Population Employed in Farming, Fishing & Forestry in Connecticut is 0.18%.
What is the Percentage of Population Employed in Farming, Fishing & Forestry in the United States?
Percentage of Population Employed in Farming, Fishing & Forestry in the United States is 0.61%.