Woodland Park, CO
Woodland Park Map
Woodland Park Overview
7,911
TOTAL POPULATION
4,094
MALE POPULATION
3,817
FEMALE POPULATION
107.26
MALES / 100 FEMALES
93.23
FEMALES / 100 MALES
43.1
MEDIAN AGE
3.0
AVG FAMILY SIZE
2.4
AVG HOUSEHOLD SIZE
$43,146
PER CAPITA INCOME
$98,813
AVG FAMILY INCOME
$89,341
AVG HOUSEHOLD INCOME
55.2%
WAGE / INCOME GAP [ % ]
44.8¢/ $1
WAGE / INCOME GAP [ $ ]
0.39
INEQUALITY / GINI INDEX
3,946
LABOR FORCE [ PEOPLE ]
59.6%
PERCENT IN LABOR FORCE
3.8%
UNEMPLOYMENT RATE
Woodland Park Zip Codes
Woodland Park Area Codes
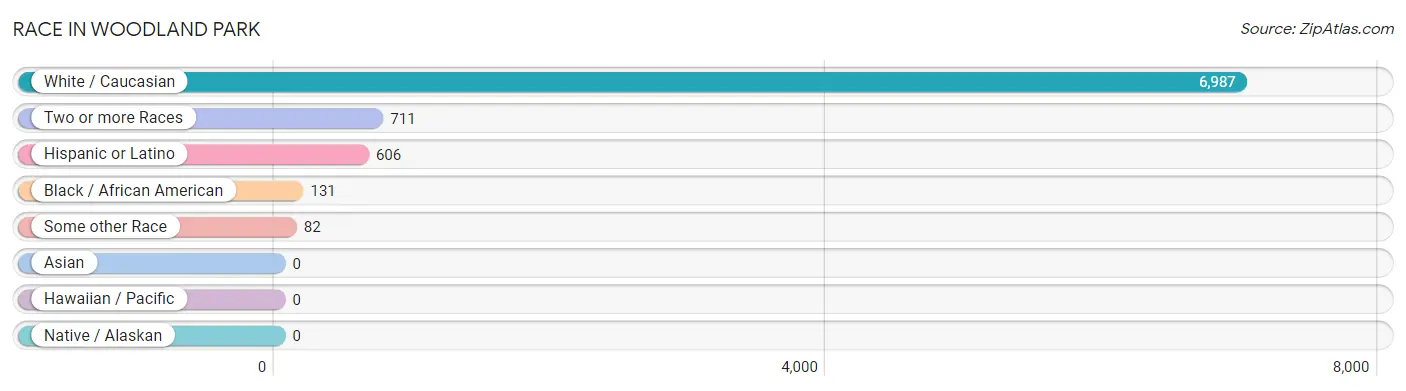
Race in Woodland Park
The most populous races in Woodland Park are White / Caucasian (6,987 | 88.3%), Two or more Races (711 | 9.0%), and Hispanic or Latino (606 | 7.7%).
| Race | # Population | % Population |
| Asian | 0 | 0.0% |
| Black / African American | 131 | 1.7% |
| Hawaiian / Pacific | 0 | 0.0% |
| Hispanic or Latino | 606 | 7.7% |
| Native / Alaskan | 0 | 0.0% |
| White / Caucasian | 6,987 | 88.3% |
| Two or more Races | 711 | 9.0% |
| Some other Race | 82 | 1.0% |
| Total | 7,911 | 100.0% |
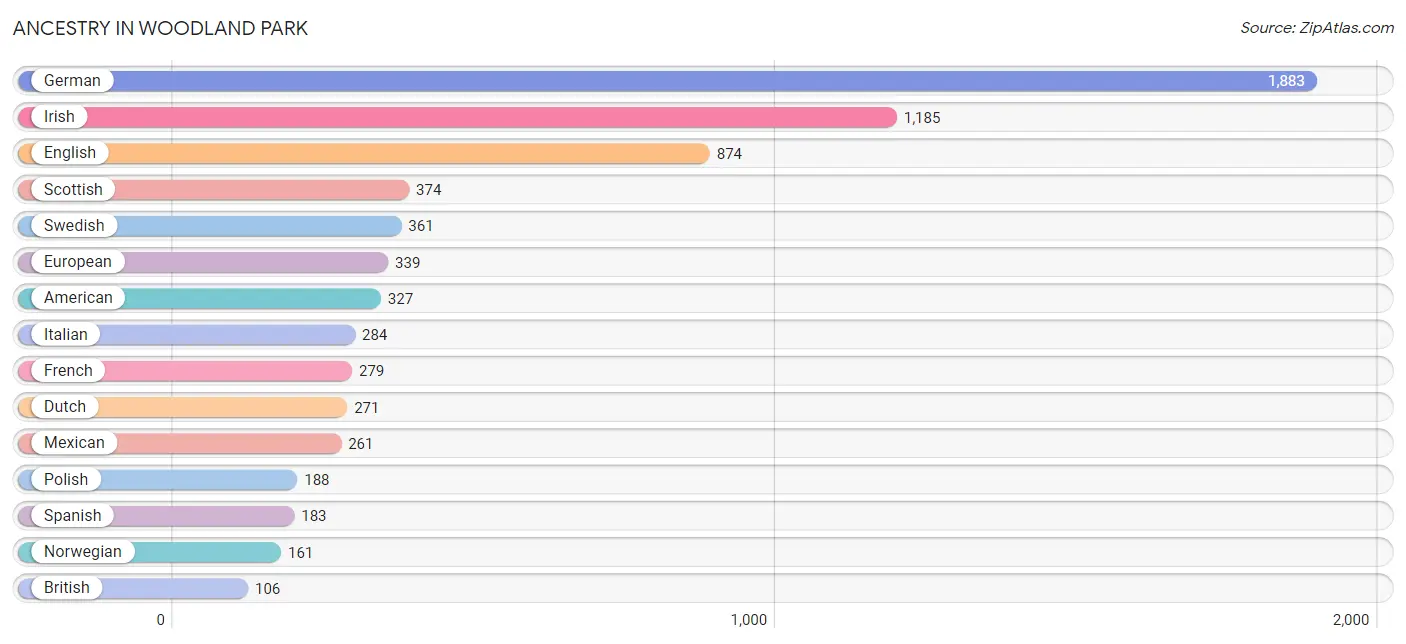
Ancestry in Woodland Park
The most populous ancestries reported in Woodland Park are German (1,883 | 23.8%), Irish (1,185 | 15.0%), English (874 | 11.1%), Scottish (374 | 4.7%), and Swedish (361 | 4.6%), together accounting for 59.1% of all Woodland Park residents.
| Ancestry | # Population | % Population |
| African | 53 | 0.7% |
| American | 327 | 4.1% |
| Arab | 20 | 0.3% |
| Armenian | 12 | 0.2% |
| Austrian | 9 | 0.1% |
| Belgian | 4 | 0.1% |
| British | 106 | 1.3% |
| Burmese | 18 | 0.2% |
| Canadian | 44 | 0.6% |
| Cherokee | 35 | 0.4% |
| Croatian | 11 | 0.1% |
| Czech | 13 | 0.2% |
| Czechoslovakian | 8 | 0.1% |
| Danish | 98 | 1.2% |
| Delaware | 9 | 0.1% |
| Dutch | 271 | 3.4% |
| Eastern European | 20 | 0.3% |
| Egyptian | 7 | 0.1% |
| English | 874 | 11.1% |
| Estonian | 8 | 0.1% |
| European | 339 | 4.3% |
| Finnish | 32 | 0.4% |
| French | 279 | 3.5% |
| French Canadian | 33 | 0.4% |
| German | 1,883 | 23.8% |
| Greek | 13 | 0.2% |
| Hungarian | 6 | 0.1% |
| Irish | 1,185 | 15.0% |
| Italian | 284 | 3.6% |
| Laotian | 41 | 0.5% |
| Lebanese | 13 | 0.2% |
| Mexican | 261 | 3.3% |
| Northern European | 16 | 0.2% |
| Norwegian | 161 | 2.0% |
| Palestinian | 7 | 0.1% |
| Polish | 188 | 2.4% |
| Portuguese | 11 | 0.1% |
| Puerto Rican | 45 | 0.6% |
| Russian | 78 | 1.0% |
| Scandinavian | 104 | 1.3% |
| Scotch-Irish | 90 | 1.1% |
| Scottish | 374 | 4.7% |
| Slovak | 18 | 0.2% |
| Spaniard | 54 | 0.7% |
| Spanish | 183 | 2.3% |
| Subsaharan African | 53 | 0.7% |
| Swedish | 361 | 4.6% |
| Swiss | 11 | 0.1% |
| Welsh | 11 | 0.1% | View All 49 Rows |
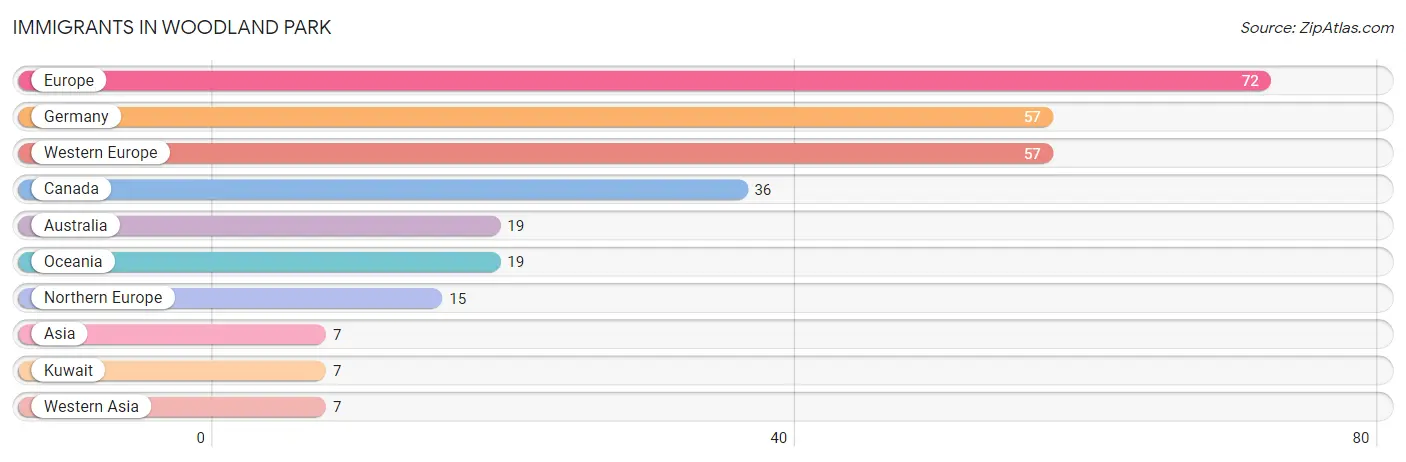
Immigrants in Woodland Park
The most numerous immigrant groups reported in Woodland Park came from Europe (72 | 0.9%), Germany (57 | 0.7%), Western Europe (57 | 0.7%), Canada (36 | 0.5%), and Australia (19 | 0.2%), together accounting for 3.0% of all Woodland Park residents.
| Immigration Origin | # Population | % Population |
| Asia | 7 | 0.1% |
| Australia | 19 | 0.2% |
| Canada | 36 | 0.5% |
| Europe | 72 | 0.9% |
| Germany | 57 | 0.7% |
| Kuwait | 7 | 0.1% |
| Northern Europe | 15 | 0.2% |
| Oceania | 19 | 0.2% |
| Western Asia | 7 | 0.1% |
| Western Europe | 57 | 0.7% | View All 10 Rows |
Sex and Age in Woodland Park
Sex and Age in Woodland Park
The most populous age groups in Woodland Park are 60 to 64 Years (363 | 8.9%) for men and 60 to 64 Years (439 | 11.5%) for women.
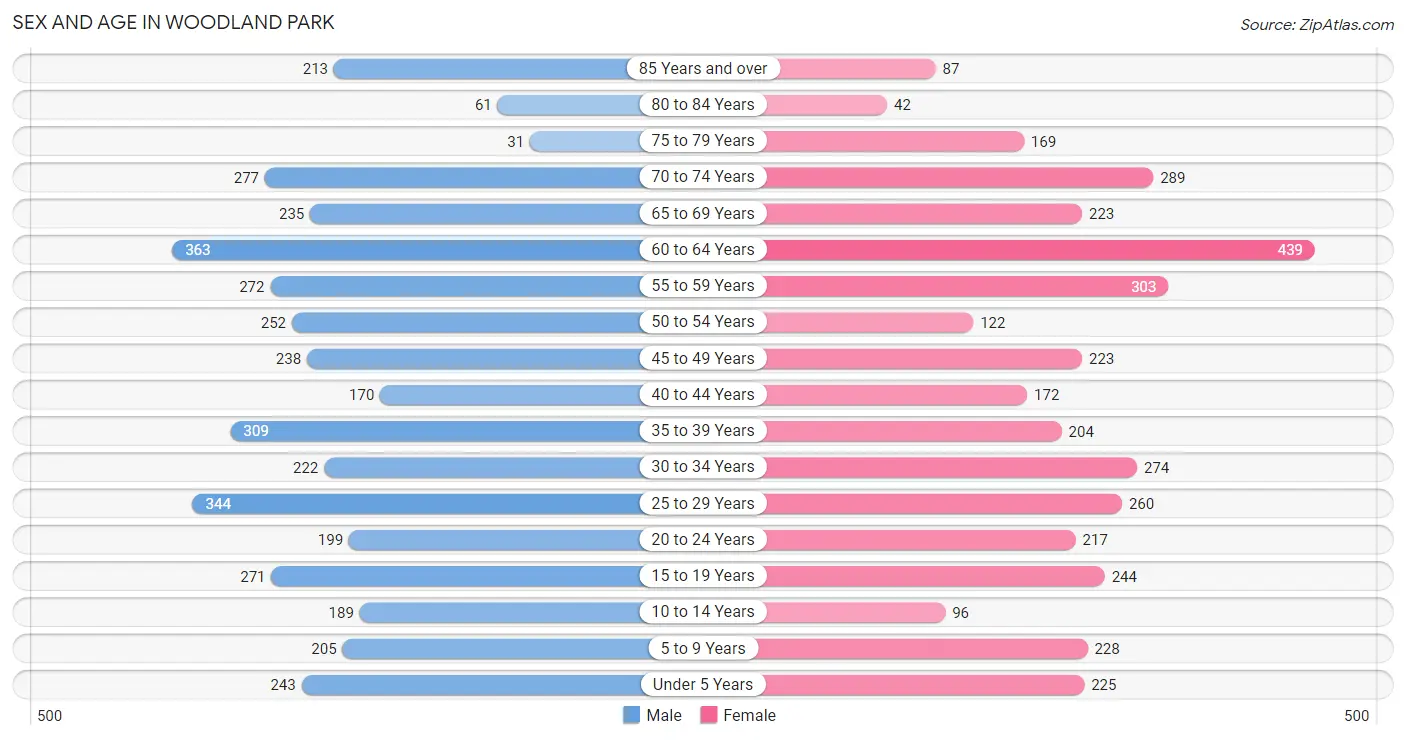
| Age Bracket | Male | Female |
| Under 5 Years | 243 (5.9%) | 225 (5.9%) |
| 5 to 9 Years | 205 (5.0%) | 228 (6.0%) |
| 10 to 14 Years | 189 (4.6%) | 96 (2.5%) |
| 15 to 19 Years | 271 (6.6%) | 244 (6.4%) |
| 20 to 24 Years | 199 (4.9%) | 217 (5.7%) |
| 25 to 29 Years | 344 (8.4%) | 260 (6.8%) |
| 30 to 34 Years | 222 (5.4%) | 274 (7.2%) |
| 35 to 39 Years | 309 (7.5%) | 204 (5.3%) |
| 40 to 44 Years | 170 (4.2%) | 172 (4.5%) |
| 45 to 49 Years | 238 (5.8%) | 223 (5.8%) |
| 50 to 54 Years | 252 (6.2%) | 122 (3.2%) |
| 55 to 59 Years | 272 (6.6%) | 303 (7.9%) |
| 60 to 64 Years | 363 (8.9%) | 439 (11.5%) |
| 65 to 69 Years | 235 (5.7%) | 223 (5.8%) |
| 70 to 74 Years | 277 (6.8%) | 289 (7.6%) |
| 75 to 79 Years | 31 (0.8%) | 169 (4.4%) |
| 80 to 84 Years | 61 (1.5%) | 42 (1.1%) |
| 85 Years and over | 213 (5.2%) | 87 (2.3%) |
| Total | 4,094 (100.0%) | 3,817 (100.0%) |
Families and Households in Woodland Park
Median Family Size in Woodland Park
The median family size in Woodland Park is 2.95 persons per family, with single female/mother families (151 | 6.9%) accounting for the largest median family size of 3.26 persons per family. On the other hand, single male/father families (159 | 7.3%) represent the smallest median family size with 2.18 persons per family.
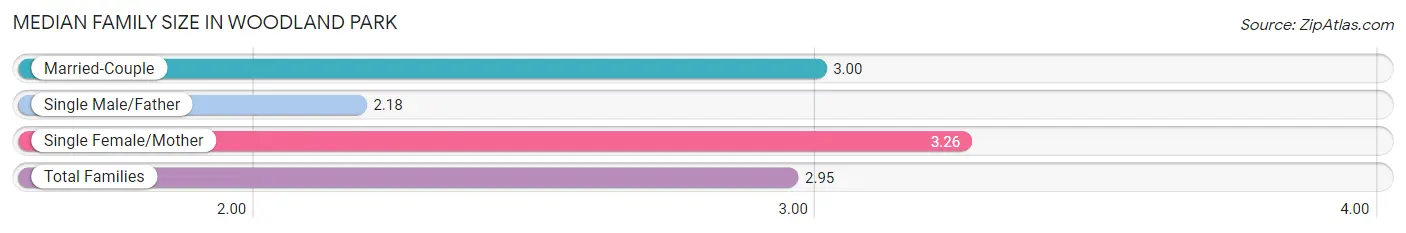
| Family Type | # Families | Family Size |
| Married-Couple | 1,874 (85.8%) | 3.00 |
| Single Male/Father | 159 (7.3%) | 2.18 |
| Single Female/Mother | 151 (6.9%) | 3.26 |
| Total Families | 2,184 (100.0%) | 2.95 |
Median Household Size in Woodland Park
The median household size in Woodland Park is 2.42 persons per household, with single female/mother households (151 | 4.6%) accounting for the largest median household size of 3.45 persons per household. non-family households (1,081 | 33.1%) represent the smallest median household size with 1.26 persons per household.
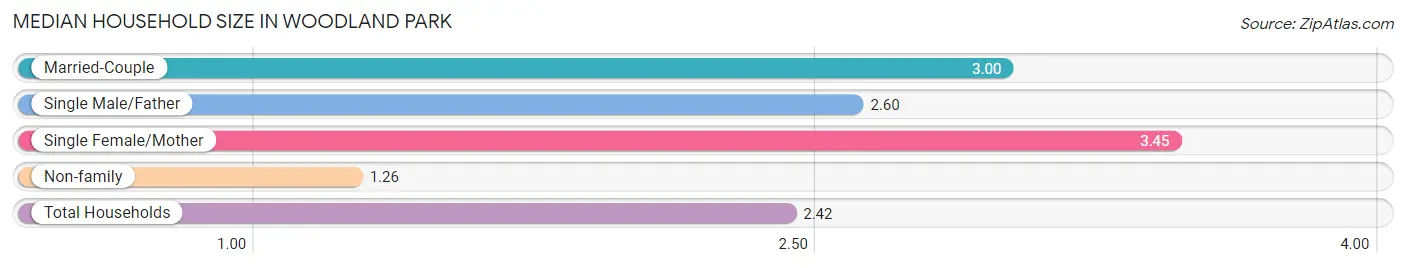
| Household Type | # Households | Household Size |
| Married-Couple | 1,874 (57.4%) | 3.00 |
| Single Male/Father | 159 (4.9%) | 2.60 |
| Single Female/Mother | 151 (4.6%) | 3.45 |
| Non-family | 1,081 (33.1%) | 1.26 |
| Total Households | 3,265 (100.0%) | 2.42 |
Household Size by Marriage Status in Woodland Park
Out of a total of 3,265 households in Woodland Park, 2,184 (66.9%) are family households, while 1,081 (33.1%) are nonfamily households. The most numerous type of family households are 2-person households, comprising 1,175, and the most common type of nonfamily households are 1-person households, comprising 917.
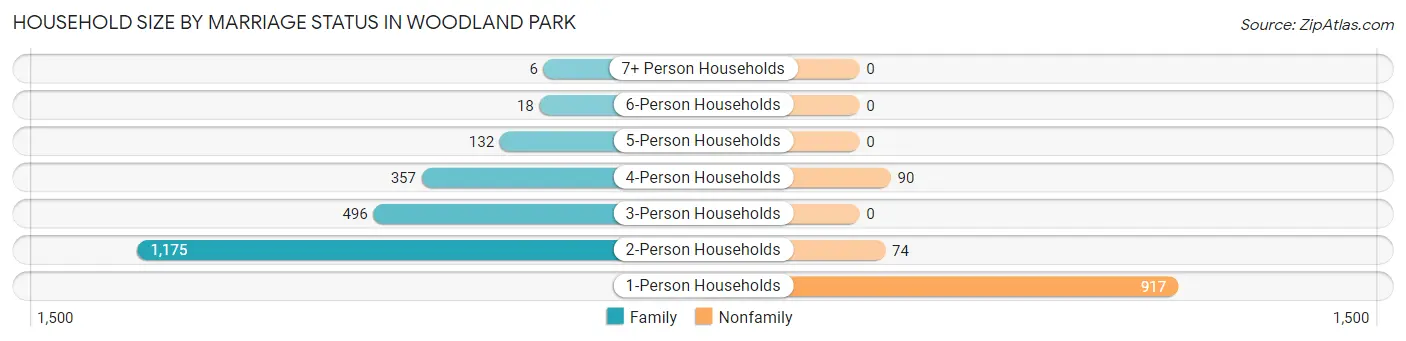
| Household Size | Family Households | Nonfamily Households |
| 1-Person Households | - | 917 (28.1%) |
| 2-Person Households | 1,175 (36.0%) | 74 (2.3%) |
| 3-Person Households | 496 (15.2%) | 0 (0.0%) |
| 4-Person Households | 357 (10.9%) | 90 (2.8%) |
| 5-Person Households | 132 (4.0%) | 0 (0.0%) |
| 6-Person Households | 18 (0.5%) | 0 (0.0%) |
| 7+ Person Households | 6 (0.2%) | 0 (0.0%) |
| Total | 2,184 (66.9%) | 1,081 (33.1%) |
Female Fertility in Woodland Park
Fertility by Age in Woodland Park
| Age Bracket | Women with Births | Births / 1,000 Women |
| 15 to 19 years | 0 (0.0%) | 0.0 |
| 20 to 34 years | 0 (0.0%) | 0.0 |
| 35 to 50 years | 0 (0.0%) | 0.0 |
| Total | 0 (0.0%) | 0.0 |
Fertility by Age by Marriage Status in Woodland Park
| Age Bracket | Married | Unmarried |
| 15 to 19 years | 0 (0.0%) | 0 (0.0%) |
| 20 to 34 years | 0 (0.0%) | 0 (0.0%) |
| 35 to 50 years | 0 (0.0%) | 0 (0.0%) |
| Total | 0 (0.0%) | 0 (0.0%) |
Fertility by Education in Woodland Park
| Educational Attainment | Women with Births | Births / 1,000 Women |
| Less than High School | 0 (0.0%) | 0.0 |
| High School Diploma | 0 (0.0%) | 0.0 |
| College or Associate's Degree | 0 (0.0%) | 0.0 |
| Bachelor's Degree | 0 (0.0%) | 0.0 |
| Graduate Degree | 0 (0.0%) | 0.0 |
| Total | 0 (0.0%) | 0.0 |
Fertility by Education by Marriage Status in Woodland Park
| Educational Attainment | Married | Unmarried |
| Less than High School | 0 (0.0%) | 0 (0.0%) |
| High School Diploma | 0 (0.0%) | 0 (0.0%) |
| College or Associate's Degree | 0 (0.0%) | 0 (0.0%) |
| Bachelor's Degree | 0 (0.0%) | 0 (0.0%) |
| Graduate Degree | 0 (0.0%) | 0 (0.0%) |
| Total | 0 (0.0%) | 0 (0.0%) |
Income in Woodland Park
Income Overview in Woodland Park
Per Capita Income in Woodland Park is $43,146, while median incomes of families and households are $98,813 and $89,341 respectively.
| Characteristic | Number | Measure |
| Per Capita Income | 7,911 | $43,146 |
| Median Family Income | 2,184 | $98,813 |
| Mean Family Income | 2,184 | $114,064 |
| Median Household Income | 3,265 | $89,341 |
| Mean Household Income | 3,265 | $104,018 |
| Income Deficit | 2,184 | $0 |
| Wage / Income Gap (%) | 7,911 | 55.20% |
| Wage / Income Gap ($) | 7,911 | 44.80¢ per $1 |
| Gini / Inequality Index | 7,911 | 0.39 |
Earnings by Sex in Woodland Park
Average Earnings in Woodland Park are $42,132, $56,051 for men and $25,110 for women, a difference of 55.2%.
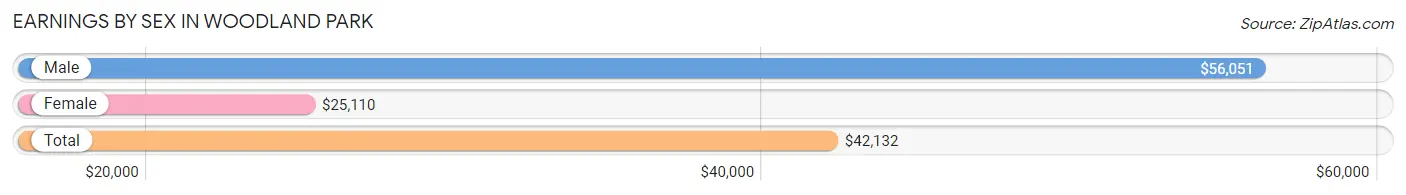
| Sex | Number | Average Earnings |
| Male | 2,300 (53.8%) | $56,051 |
| Female | 1,971 (46.2%) | $25,110 |
| Total | 4,271 (100.0%) | $42,132 |
Earnings by Sex by Income Bracket in Woodland Park
The most common earnings brackets in Woodland Park are $100,000+ for men (598 | 26.0%) and $2,499 or less for women (211 | 10.7%).
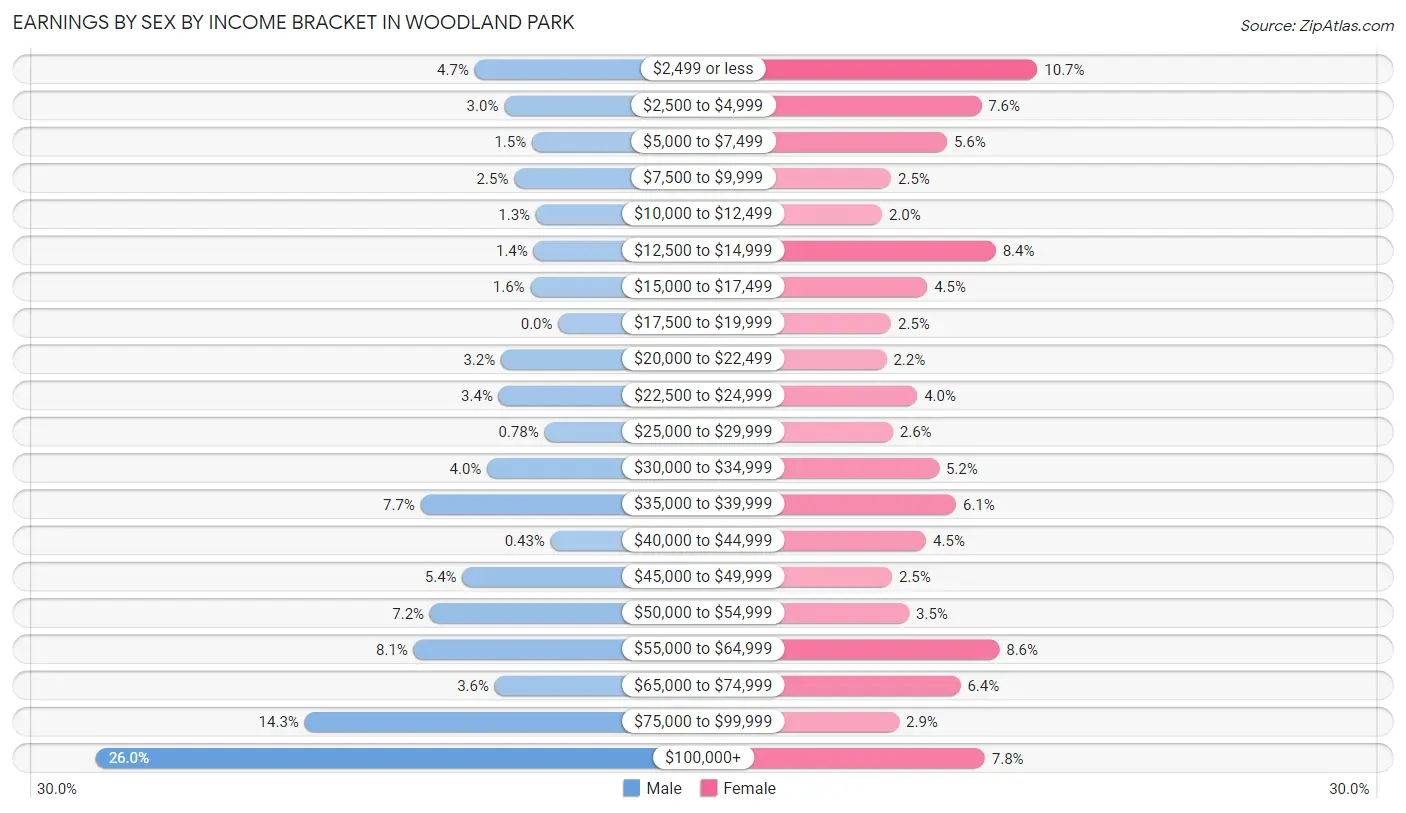
| Income | Male | Female |
| $2,499 or less | 108 (4.7%) | 211 (10.7%) |
| $2,500 to $4,999 | 70 (3.0%) | 149 (7.6%) |
| $5,000 to $7,499 | 34 (1.5%) | 111 (5.6%) |
| $7,500 to $9,999 | 57 (2.5%) | 49 (2.5%) |
| $10,000 to $12,499 | 29 (1.3%) | 39 (2.0%) |
| $12,500 to $14,999 | 32 (1.4%) | 165 (8.4%) |
| $15,000 to $17,499 | 36 (1.6%) | 89 (4.5%) |
| $17,500 to $19,999 | 0 (0.0%) | 49 (2.5%) |
| $20,000 to $22,499 | 74 (3.2%) | 44 (2.2%) |
| $22,500 to $24,999 | 77 (3.4%) | 78 (4.0%) |
| $25,000 to $29,999 | 18 (0.8%) | 51 (2.6%) |
| $30,000 to $34,999 | 92 (4.0%) | 102 (5.2%) |
| $35,000 to $39,999 | 178 (7.7%) | 121 (6.1%) |
| $40,000 to $44,999 | 10 (0.4%) | 88 (4.5%) |
| $45,000 to $49,999 | 124 (5.4%) | 50 (2.5%) |
| $50,000 to $54,999 | 166 (7.2%) | 69 (3.5%) |
| $55,000 to $64,999 | 187 (8.1%) | 169 (8.6%) |
| $65,000 to $74,999 | 82 (3.6%) | 126 (6.4%) |
| $75,000 to $99,999 | 328 (14.3%) | 58 (2.9%) |
| $100,000+ | 598 (26.0%) | 153 (7.8%) |
| Total | 2,300 (100.0%) | 1,971 (100.0%) |
Earnings by Sex by Educational Attainment in Woodland Park
Average earnings in Woodland Park are $63,350 for men and $35,663 for women, a difference of 43.7%. Men with an educational attainment of bachelor's degree enjoy the highest average annual earnings of $107,981, while those with high school diploma education earn the least with $45,794. Women with an educational attainment of bachelor's degree earn the most with the average annual earnings of $68,333, while those with high school diploma education have the smallest earnings of $24,405.
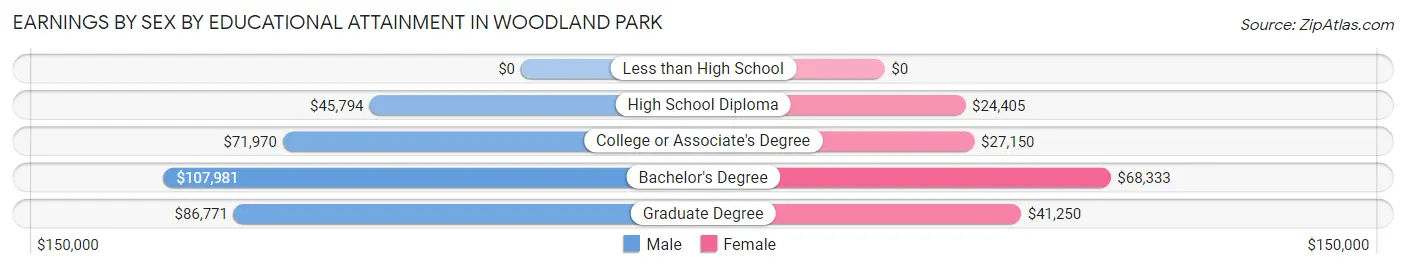
| Educational Attainment | Male Income | Female Income |
| Less than High School | - | - |
| High School Diploma | $45,794 | $24,405 |
| College or Associate's Degree | $71,970 | $27,150 |
| Bachelor's Degree | $107,981 | $68,333 |
| Graduate Degree | $86,771 | $41,250 |
| Total | $63,350 | $35,663 |
Family Income in Woodland Park
Family Income Brackets in Woodland Park
According to the Woodland Park family income data, there are 622 families falling into the $100,000 to $149,999 income range, which is the most common income bracket and makes up 28.5% of all families.
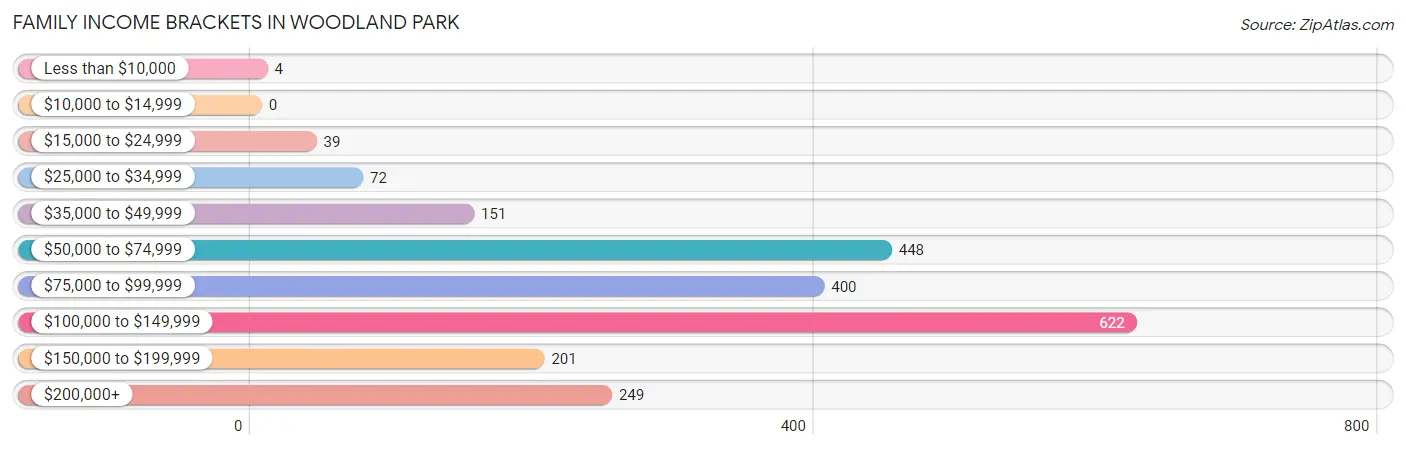
| Income Bracket | # Families | % Families |
| Less than $10,000 | 4 | 0.2% |
| $10,000 to $14,999 | 0 | 0.0% |
| $15,000 to $24,999 | 39 | 1.8% |
| $25,000 to $34,999 | 72 | 3.3% |
| $35,000 to $49,999 | 151 | 6.9% |
| $50,000 to $74,999 | 448 | 20.5% |
| $75,000 to $99,999 | 400 | 18.3% |
| $100,000 to $149,999 | 622 | 28.5% |
| $150,000 to $199,999 | 201 | 9.2% |
| $200,000+ | 249 | 11.4% |
Family Income by Famaliy Size in Woodland Park
3-person families (416 | 19.1%) account for the highest median family income in Woodland Park with $115,152 per family, while 2-person families (1,266 | 58.0%) have the highest median income of $43,438 per family member.
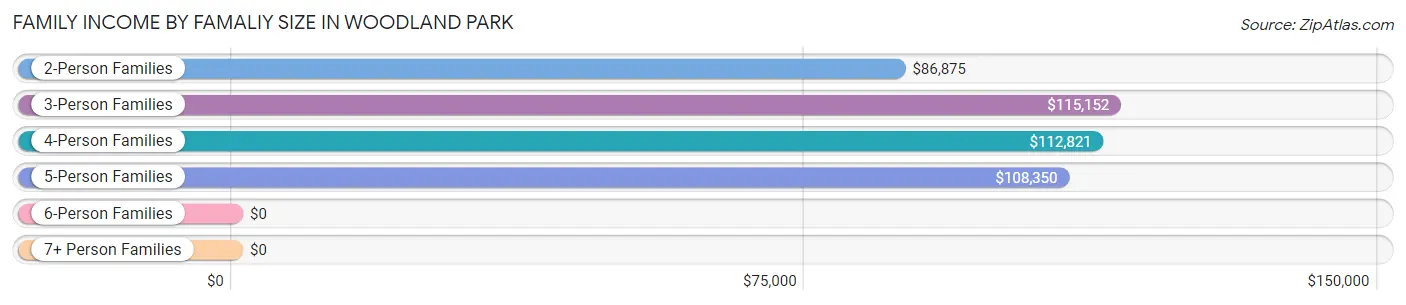
| Income Bracket | # Families | Median Income |
| 2-Person Families | 1,266 (58.0%) | $86,875 |
| 3-Person Families | 416 (19.1%) | $115,152 |
| 4-Person Families | 352 (16.1%) | $112,821 |
| 5-Person Families | 132 (6.0%) | $108,350 |
| 6-Person Families | 12 (0.5%) | $0 |
| 7+ Person Families | 6 (0.3%) | $0 |
| Total | 2,184 (100.0%) | $98,813 |
Family Income by Number of Earners in Woodland Park
The median family income in Woodland Park is $98,813, with families comprising 2 earners (851) having the highest median family income of $128,365, while families with no earners (378) have the lowest median family income of $71,071, accounting for 39.0% and 17.3% of families, respectively.
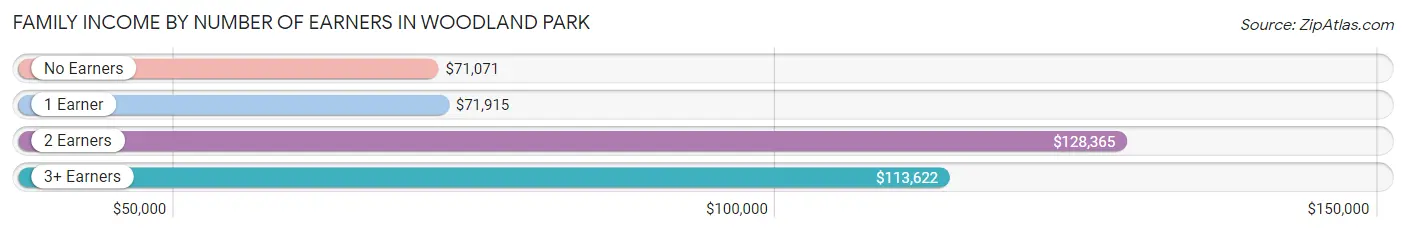
| Number of Earners | # Families | Median Income |
| No Earners | 378 (17.3%) | $71,071 |
| 1 Earner | 686 (31.4%) | $71,915 |
| 2 Earners | 851 (39.0%) | $128,365 |
| 3+ Earners | 269 (12.3%) | $113,622 |
| Total | 2,184 (100.0%) | $98,813 |
Household Income in Woodland Park
Household Income Brackets in Woodland Park
With 872 households falling in the category, the $100,000 to $149,999 income range is the most frequent in Woodland Park, accounting for 26.7% of all households.
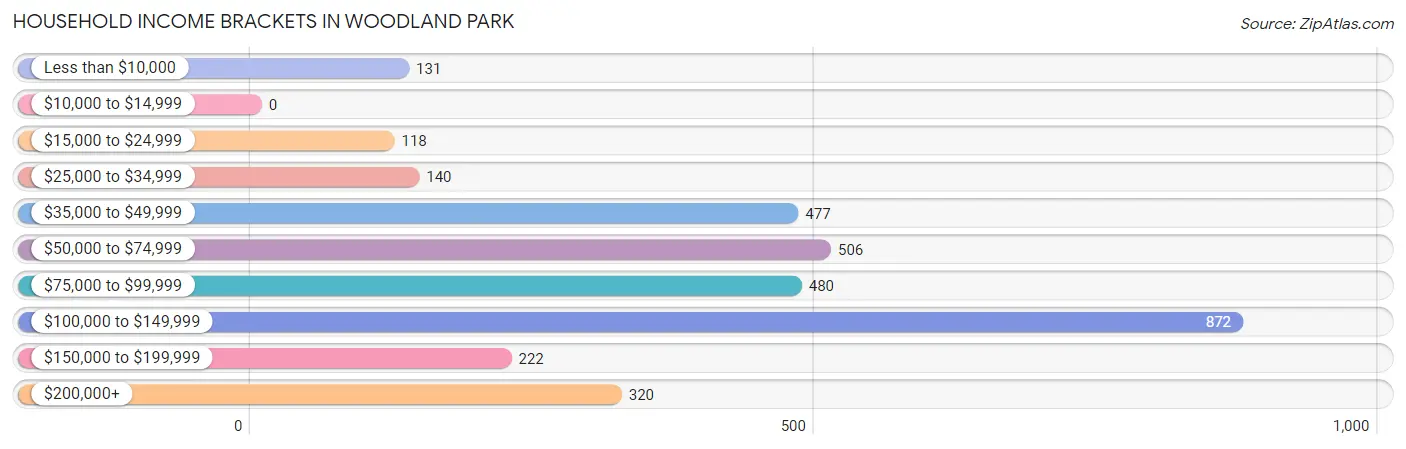
| Income Bracket | # Households | % Households |
| Less than $10,000 | 131 | 4.0% |
| $10,000 to $14,999 | 0 | 0.0% |
| $15,000 to $24,999 | 118 | 3.6% |
| $25,000 to $34,999 | 140 | 4.3% |
| $35,000 to $49,999 | 477 | 14.6% |
| $50,000 to $74,999 | 506 | 15.5% |
| $75,000 to $99,999 | 480 | 14.7% |
| $100,000 to $149,999 | 872 | 26.7% |
| $150,000 to $199,999 | 222 | 6.8% |
| $200,000+ | 320 | 9.8% |
Household Income by Householder Age in Woodland Park
The median household income in Woodland Park is $89,341, with the highest median household income of $109,935 found in the 45 to 64 years age bracket for the primary householder. A total of 1,224 households (37.5%) fall into this category. Meanwhile, the 15 to 24 years age bracket for the primary householder has the lowest median household income of $0, with 163 households (5.0%) in this group.
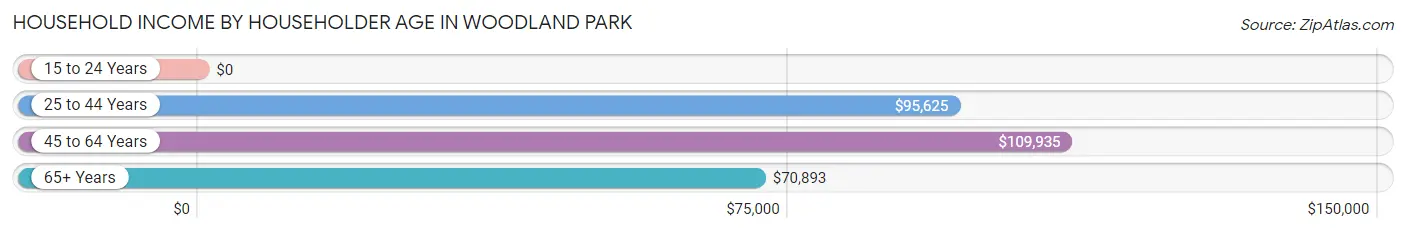
| Income Bracket | # Households | Median Income |
| 15 to 24 Years | 163 (5.0%) | $0 |
| 25 to 44 Years | 863 (26.4%) | $95,625 |
| 45 to 64 Years | 1,224 (37.5%) | $109,935 |
| 65+ Years | 1,015 (31.1%) | $70,893 |
| Total | 3,265 (100.0%) | $89,341 |
Poverty in Woodland Park
Income Below Poverty by Sex and Age in Woodland Park
With 4.6% poverty level for males and 10.2% for females among the residents of Woodland Park, 5 year old males and 18 to 24 year old females are the most vulnerable to poverty, with 10 males (30.3%) and 157 females (58.2%) in their respective age groups living below the poverty level.
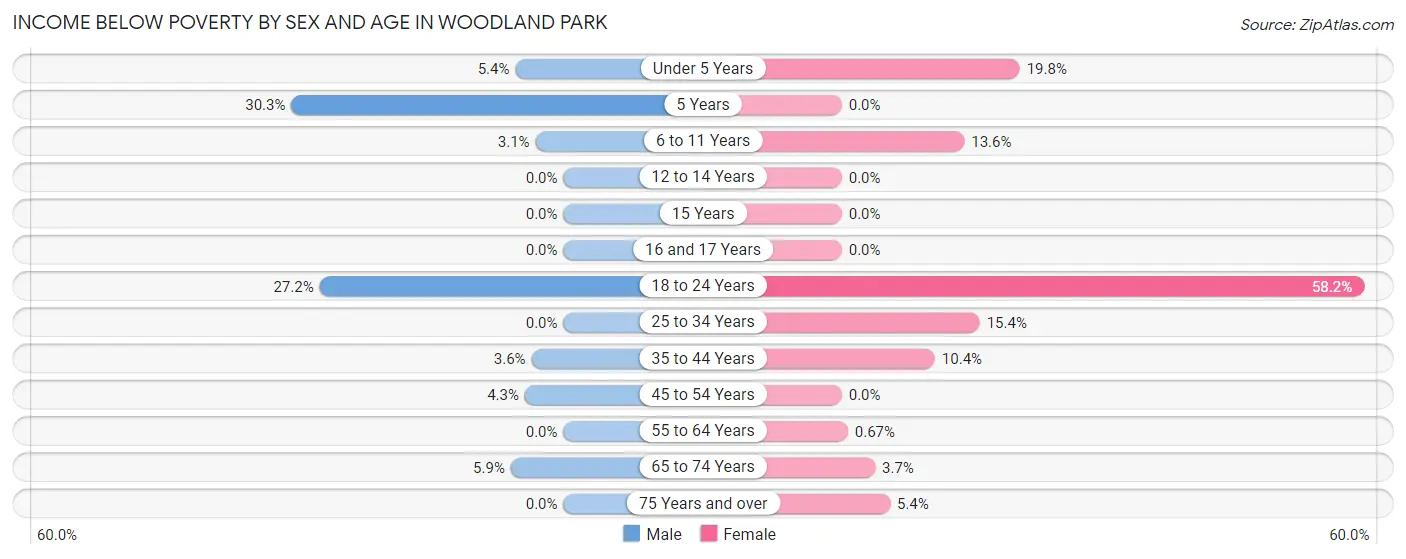
| Age Bracket | Male | Female |
| Under 5 Years | 13 (5.3%) | 43 (19.8%) |
| 5 Years | 10 (30.3%) | 0 (0.0%) |
| 6 to 11 Years | 8 (3.1%) | 27 (13.6%) |
| 12 to 14 Years | 0 (0.0%) | 0 (0.0%) |
| 15 Years | 0 (0.0%) | 0 (0.0%) |
| 16 and 17 Years | 0 (0.0%) | 0 (0.0%) |
| 18 to 24 Years | 91 (27.2%) | 157 (58.2%) |
| 25 to 34 Years | 0 (0.0%) | 82 (15.4%) |
| 35 to 44 Years | 17 (3.5%) | 39 (10.4%) |
| 45 to 54 Years | 21 (4.3%) | 0 (0.0%) |
| 55 to 64 Years | 0 (0.0%) | 5 (0.7%) |
| 65 to 74 Years | 30 (5.9%) | 19 (3.7%) |
| 75 Years and over | 0 (0.0%) | 16 (5.4%) |
| Total | 190 (4.6%) | 388 (10.2%) |
Income Above Poverty by Sex and Age in Woodland Park
According to the poverty statistics in Woodland Park, males aged 12 to 14 years and females aged 5 years are the age groups that are most secure financially, with 100.0% of males and 100.0% of females in these age groups living above the poverty line.
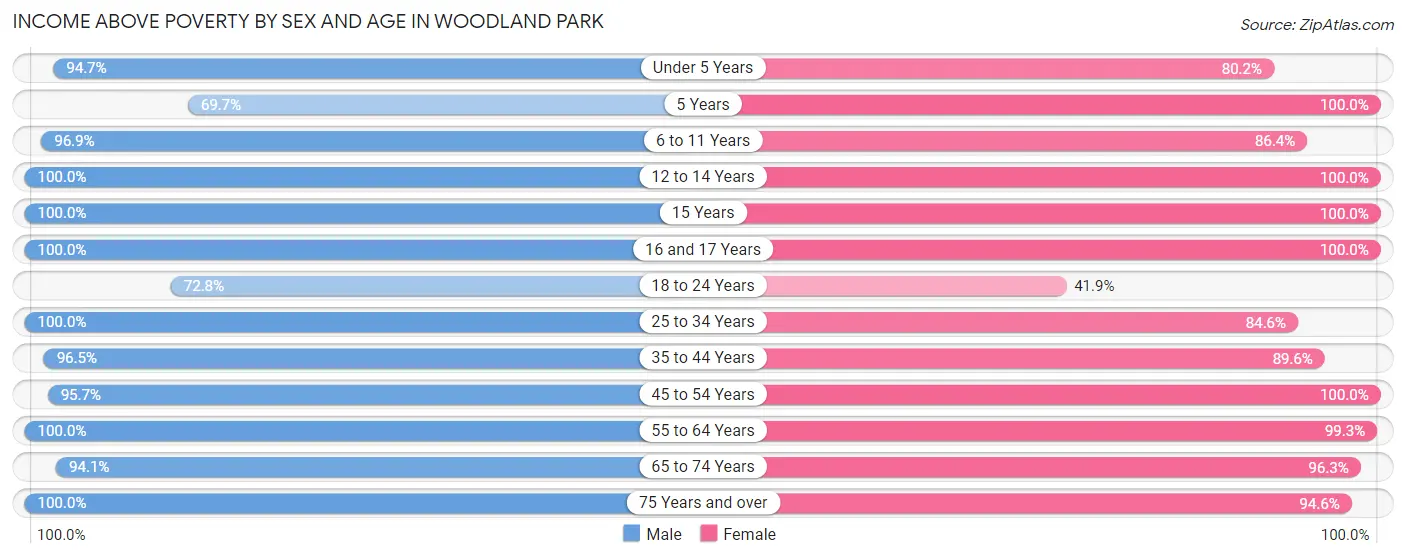
| Age Bracket | Male | Female |
| Under 5 Years | 230 (94.7%) | 174 (80.2%) |
| 5 Years | 23 (69.7%) | 73 (100.0%) |
| 6 to 11 Years | 249 (96.9%) | 171 (86.4%) |
| 12 to 14 Years | 96 (100.0%) | 53 (100.0%) |
| 15 Years | 39 (100.0%) | 66 (100.0%) |
| 16 and 17 Years | 96 (100.0%) | 125 (100.0%) |
| 18 to 24 Years | 244 (72.8%) | 113 (41.8%) |
| 25 to 34 Years | 566 (100.0%) | 452 (84.6%) |
| 35 to 44 Years | 462 (96.5%) | 337 (89.6%) |
| 45 to 54 Years | 469 (95.7%) | 345 (100.0%) |
| 55 to 64 Years | 635 (100.0%) | 737 (99.3%) |
| 65 to 74 Years | 482 (94.1%) | 493 (96.3%) |
| 75 Years and over | 305 (100.0%) | 282 (94.6%) |
| Total | 3,896 (95.4%) | 3,421 (89.8%) |
Income Below Poverty Among Married-Couple Families in Woodland Park
The poverty statistics for married-couple families in Woodland Park show that 1.1% or 20 of the total 1,874 families live below the poverty line. Families with 3 or 4 children have the highest poverty rate of 22.4%, comprising of 13 families. On the other hand, families with 1 or 2 children have the lowest poverty rate of 0.0%, which includes 0 families.
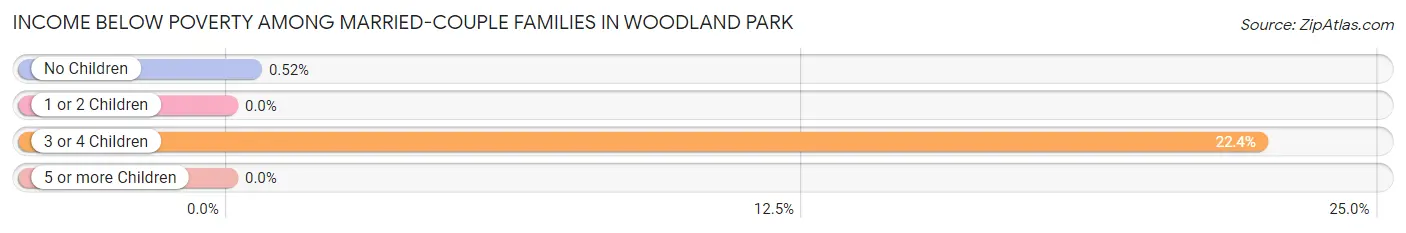
| Children | Above Poverty | Below Poverty |
| No Children | 1,328 (99.5%) | 7 (0.5%) |
| 1 or 2 Children | 475 (100.0%) | 0 (0.0%) |
| 3 or 4 Children | 45 (77.6%) | 13 (22.4%) |
| 5 or more Children | 6 (100.0%) | 0 (0.0%) |
| Total | 1,854 (98.9%) | 20 (1.1%) |
Income Below Poverty Among Single-Parent Households in Woodland Park
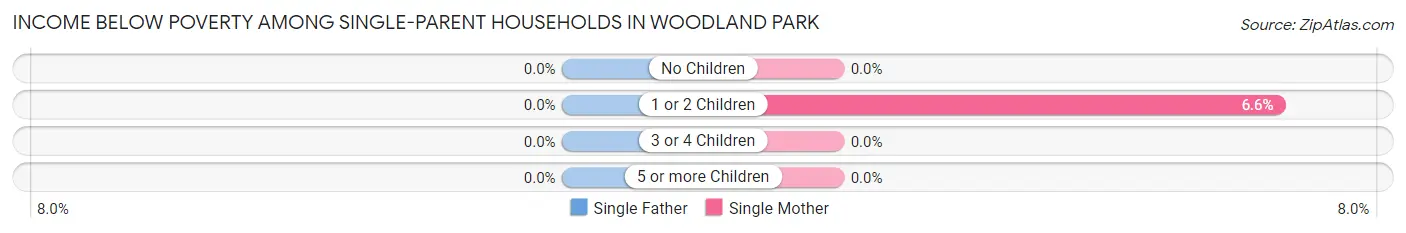
| Children | Single Father | Single Mother |
| No Children | 0 (0.0%) | 0 (0.0%) |
| 1 or 2 Children | 0 (0.0%) | 5 (6.6%) |
| 3 or 4 Children | 0 (0.0%) | 0 (0.0%) |
| 5 or more Children | 0 (0.0%) | 0 (0.0%) |
| Total | 0 (0.0%) | 5 (3.3%) |
Income Below Poverty Among Married-Couple vs Single-Parent Households in Woodland Park
The poverty data for Woodland Park shows that 20 of the married-couple family households (1.1%) and 5 of the single-parent households (1.6%) are living below the poverty level. Within the married-couple family households, those with 3 or 4 children have the highest poverty rate, with 13 households (22.4%) falling below the poverty line. Among the single-parent households, those with 1 or 2 children have the highest poverty rate, with 5 household (2.4%) living below poverty.
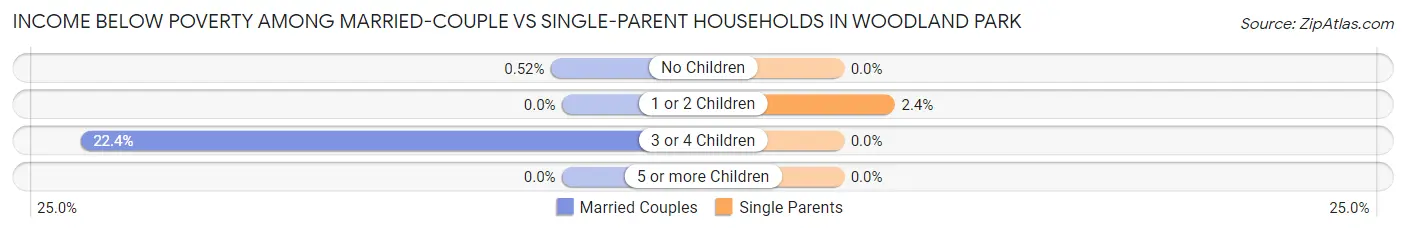
| Children | Married-Couple Families | Single-Parent Households |
| No Children | 7 (0.5%) | 0 (0.0%) |
| 1 or 2 Children | 0 (0.0%) | 5 (2.4%) |
| 3 or 4 Children | 13 (22.4%) | 0 (0.0%) |
| 5 or more Children | 0 (0.0%) | 0 (0.0%) |
| Total | 20 (1.1%) | 5 (1.6%) |
Employment Characteristics in Woodland Park
Employment by Class of Employer in Woodland Park
Among the 3,718 employed individuals in Woodland Park, private company employees (2,203 | 59.3%), not-for-profit organizations (578 | 15.5%), and self-employed (not incorporated) (377 | 10.1%) make up the most common classes of employment.
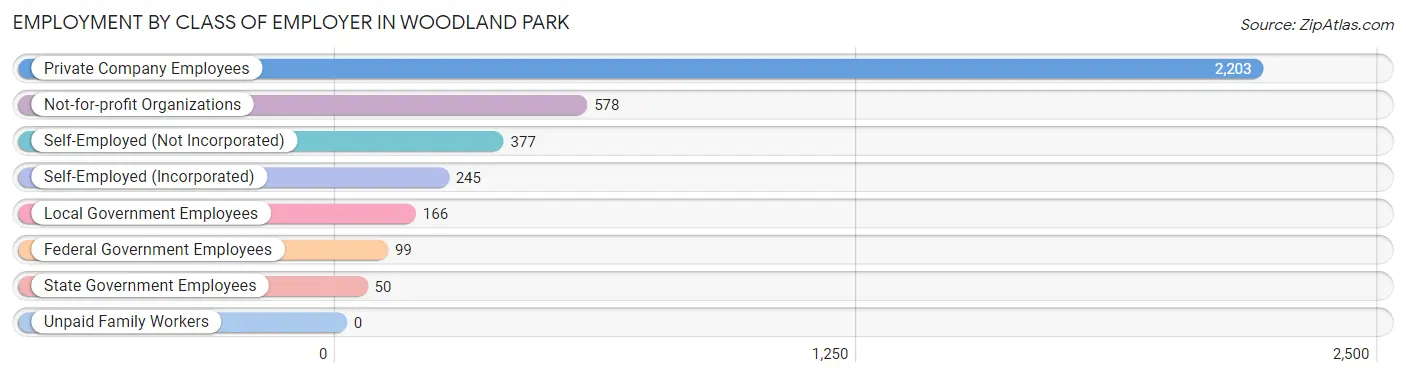
| Employer Class | # Employees | % Employees |
| Private Company Employees | 2,203 | 59.3% |
| Self-Employed (Incorporated) | 245 | 6.6% |
| Self-Employed (Not Incorporated) | 377 | 10.1% |
| Not-for-profit Organizations | 578 | 15.5% |
| Local Government Employees | 166 | 4.5% |
| State Government Employees | 50 | 1.3% |
| Federal Government Employees | 99 | 2.7% |
| Unpaid Family Workers | 0 | 0.0% |
| Total | 3,718 | 100.0% |
Employment Status by Age in Woodland Park
According to the labor force statistics for Woodland Park, out of the total population over 16 years of age (6,620), 59.6% or 3,946 individuals are in the labor force, with 3.8% or 150 of them unemployed. The age group with the highest labor force participation rate is 45 to 54 years, with 88.5% or 739 individuals in the labor force. Within the labor force, the 16 to 19 years age range has the highest percentage of unemployed individuals, with 29.9% or 38 of them being unemployed.
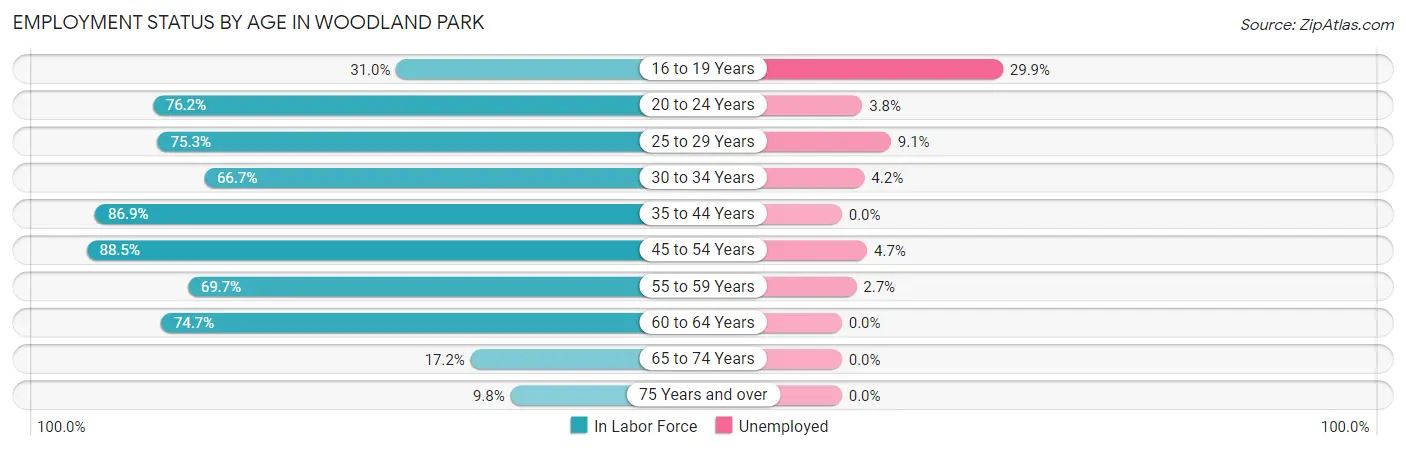
| Age Bracket | In Labor Force | Unemployed |
| 16 to 19 Years | 127 (31.0%) | 38 (29.9%) |
| 20 to 24 Years | 317 (76.2%) | 12 (3.8%) |
| 25 to 29 Years | 455 (75.3%) | 41 (9.1%) |
| 30 to 34 Years | 331 (66.7%) | 14 (4.2%) |
| 35 to 44 Years | 743 (86.9%) | 0 (0.0%) |
| 45 to 54 Years | 739 (88.5%) | 35 (4.7%) |
| 55 to 59 Years | 401 (69.7%) | 11 (2.7%) |
| 60 to 64 Years | 599 (74.7%) | 0 (0.0%) |
| 65 to 74 Years | 176 (17.2%) | 0 (0.0%) |
| 75 Years and over | 59 (9.8%) | 0 (0.0%) |
| Total | 3,946 (59.6%) | 150 (3.8%) |
Employment Status by Educational Attainment in Woodland Park
According to labor force statistics for Woodland Park, 78.4% of individuals (3,267) out of the total population between 25 and 64 years of age (4,167) are in the labor force, with 3.1% or 101 of them being unemployed. The group with the highest labor force participation rate are those with the educational attainment of college / associate degree, with 81.9% or 1,483 individuals in the labor force. Within the labor force, individuals with bachelor's degree or higher education have the highest percentage of unemployment, with 5.8% or 73 of them being unemployed.
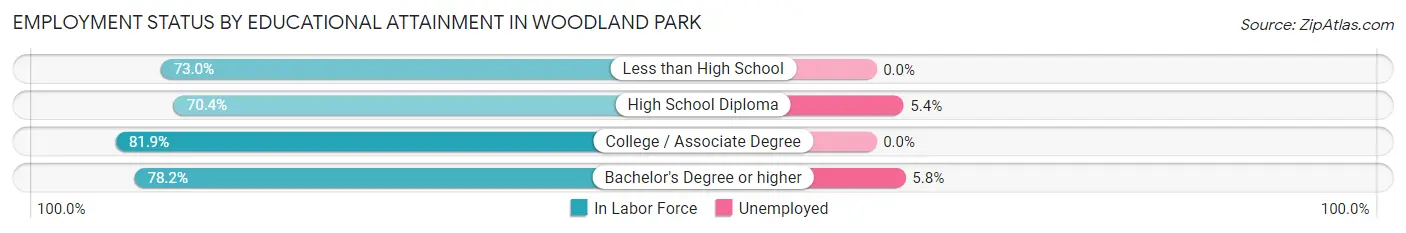
| Educational Attainment | In Labor Force | Unemployed |
| Less than High School | 27 (73.0%) | 0 (0.0%) |
| High School Diploma | 500 (70.4%) | 38 (5.4%) |
| College / Associate Degree | 1,483 (81.9%) | 0 (0.0%) |
| Bachelor's Degree or higher | 1,258 (78.2%) | 93 (5.8%) |
| Total | 3,267 (78.4%) | 129 (3.1%) |
Employment Occupations by Sex in Woodland Park
Management, Business, Science and Arts Occupations
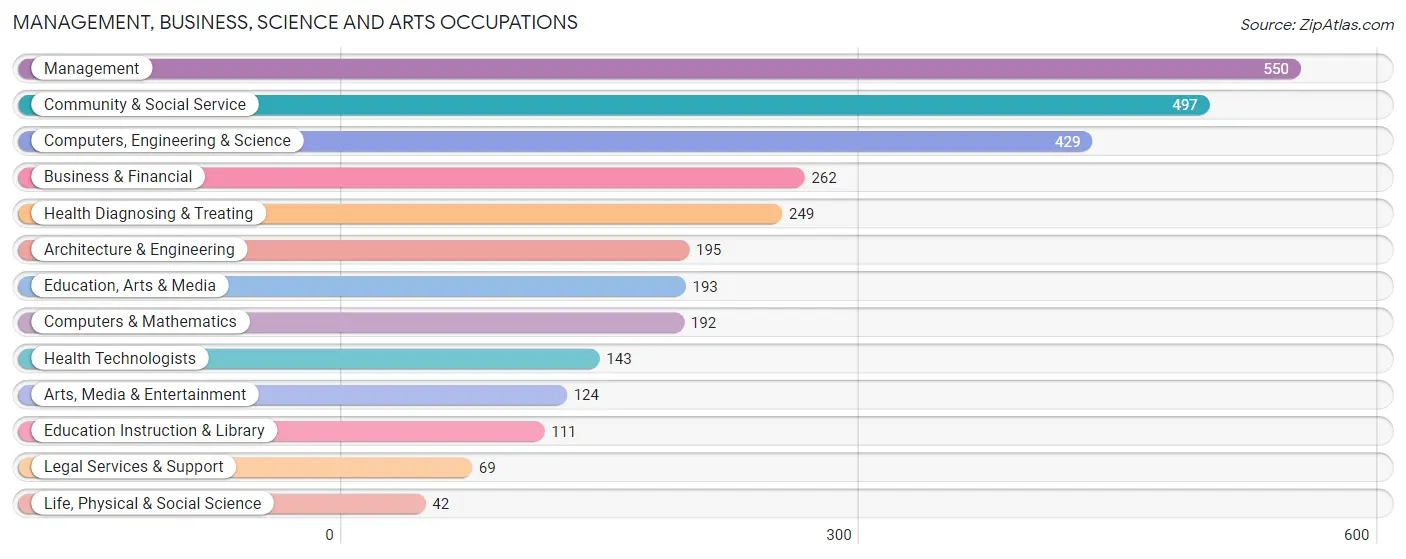
The most common Management, Business, Science and Arts occupations in Woodland Park are Management (550 | 14.6%), Community & Social Service (497 | 13.2%), Computers, Engineering & Science (429 | 11.4%), Business & Financial (262 | 7.0%), and Health Diagnosing & Treating (249 | 6.6%).
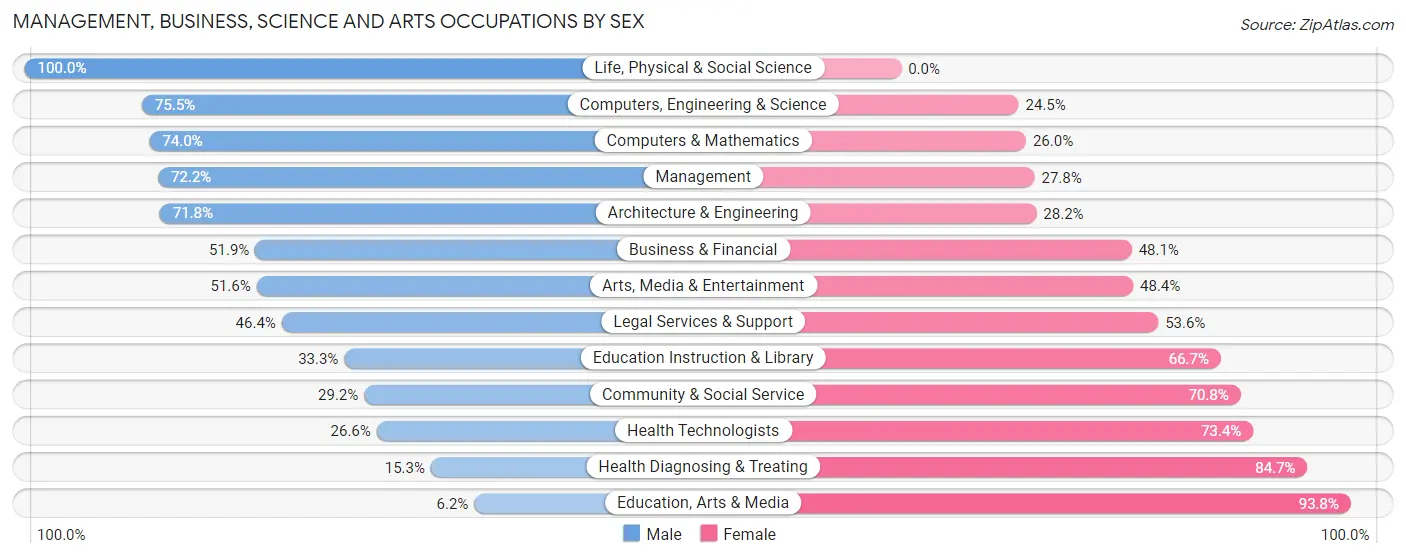
Management, Business, Science and Arts Occupations by Sex
Within the Management, Business, Science and Arts occupations in Woodland Park, the most male-oriented occupations are Life, Physical & Social Science (100.0%), Computers, Engineering & Science (75.5%), and Computers & Mathematics (74.0%), while the most female-oriented occupations are Education, Arts & Media (93.8%), Health Diagnosing & Treating (84.7%), and Health Technologists (73.4%).
| Occupation | Male | Female |
| Management | 397 (72.2%) | 153 (27.8%) |
| Business & Financial | 136 (51.9%) | 126 (48.1%) |
| Computers, Engineering & Science | 324 (75.5%) | 105 (24.5%) |
| Computers & Mathematics | 142 (74.0%) | 50 (26.0%) |
| Architecture & Engineering | 140 (71.8%) | 55 (28.2%) |
| Life, Physical & Social Science | 42 (100.0%) | 0 (0.0%) |
| Community & Social Service | 145 (29.2%) | 352 (70.8%) |
| Education, Arts & Media | 12 (6.2%) | 181 (93.8%) |
| Legal Services & Support | 32 (46.4%) | 37 (53.6%) |
| Education Instruction & Library | 37 (33.3%) | 74 (66.7%) |
| Arts, Media & Entertainment | 64 (51.6%) | 60 (48.4%) |
| Health Diagnosing & Treating | 38 (15.3%) | 211 (84.7%) |
| Health Technologists | 38 (26.6%) | 105 (73.4%) |
| Total (Category) | 1,040 (52.3%) | 947 (47.7%) |
| Total (Overall) | 2,044 (54.2%) | 1,728 (45.8%) |
Services Occupations
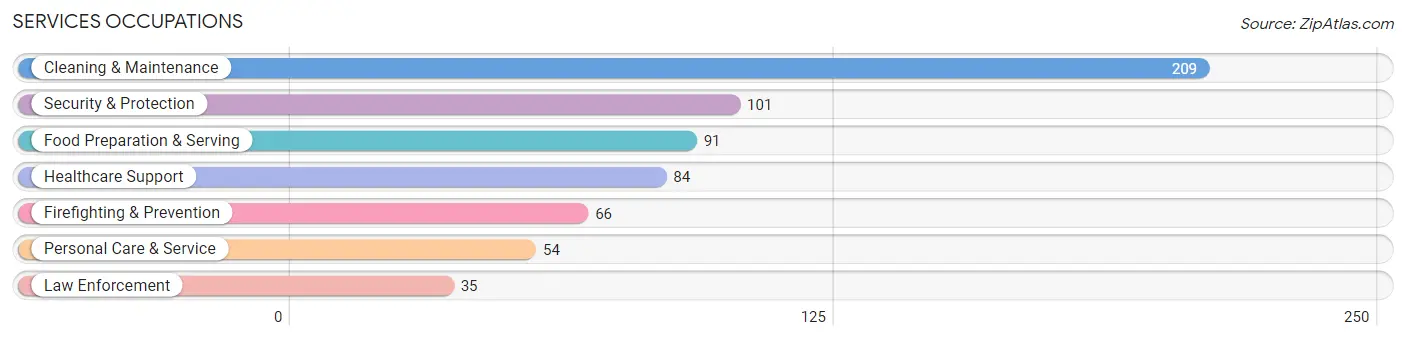
The most common Services occupations in Woodland Park are Cleaning & Maintenance (209 | 5.5%), Security & Protection (101 | 2.7%), Food Preparation & Serving (91 | 2.4%), Healthcare Support (84 | 2.2%), and Firefighting & Prevention (66 | 1.8%).
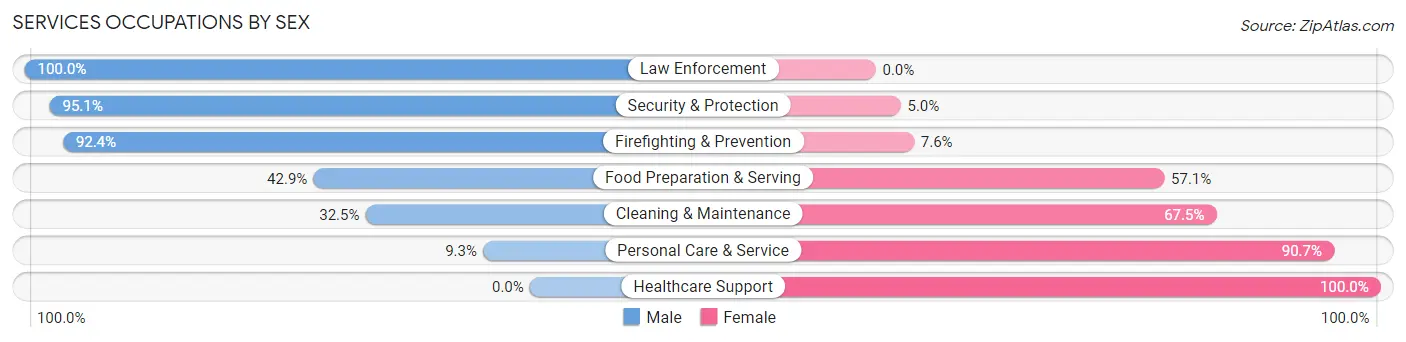
Services Occupations by Sex
Within the Services occupations in Woodland Park, the most male-oriented occupations are Law Enforcement (100.0%), Security & Protection (95.1%), and Firefighting & Prevention (92.4%), while the most female-oriented occupations are Healthcare Support (100.0%), Personal Care & Service (90.7%), and Cleaning & Maintenance (67.5%).
| Occupation | Male | Female |
| Healthcare Support | 0 (0.0%) | 84 (100.0%) |
| Security & Protection | 96 (95.1%) | 5 (5.0%) |
| Firefighting & Prevention | 61 (92.4%) | 5 (7.6%) |
| Law Enforcement | 35 (100.0%) | 0 (0.0%) |
| Food Preparation & Serving | 39 (42.9%) | 52 (57.1%) |
| Cleaning & Maintenance | 68 (32.5%) | 141 (67.5%) |
| Personal Care & Service | 5 (9.3%) | 49 (90.7%) |
| Total (Category) | 208 (38.6%) | 331 (61.4%) |
| Total (Overall) | 2,044 (54.2%) | 1,728 (45.8%) |
Sales and Office Occupations
The most common Sales and Office occupations in Woodland Park are Office & Administration (282 | 7.5%), and Sales & Related (225 | 6.0%).
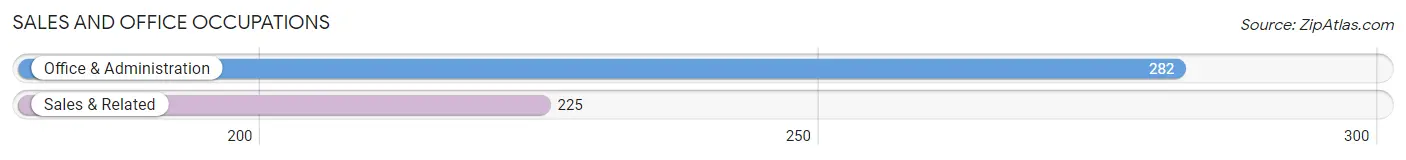
Sales and Office Occupations by Sex
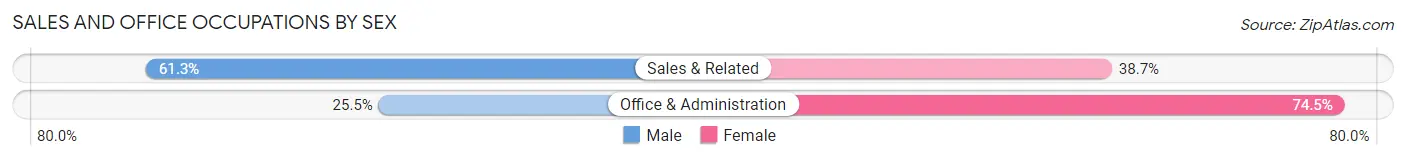
| Occupation | Male | Female |
| Sales & Related | 138 (61.3%) | 87 (38.7%) |
| Office & Administration | 72 (25.5%) | 210 (74.5%) |
| Total (Category) | 210 (41.4%) | 297 (58.6%) |
| Total (Overall) | 2,044 (54.2%) | 1,728 (45.8%) |
Natural Resources, Construction and Maintenance Occupations
The most common Natural Resources, Construction and Maintenance occupations in Woodland Park are Construction & Extraction (226 | 6.0%), Installation, Maintenance & Repair (83 | 2.2%), and Farming, Fishing & Forestry (10 | 0.3%).
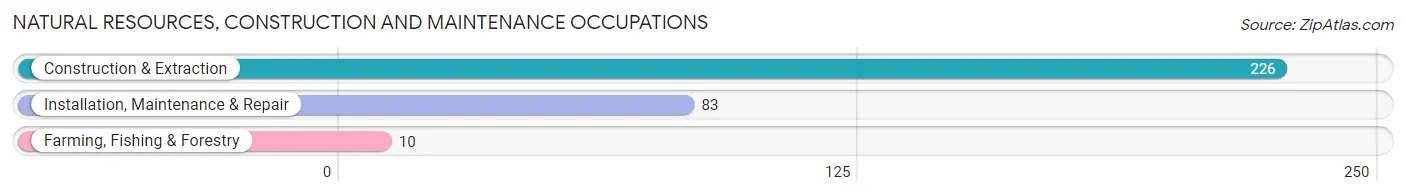
Natural Resources, Construction and Maintenance Occupations by Sex
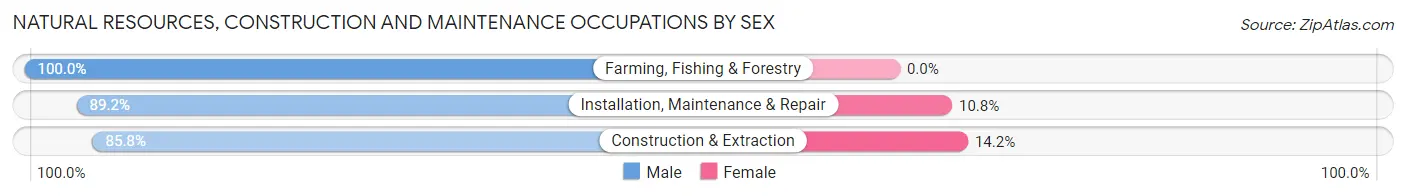
| Occupation | Male | Female |
| Farming, Fishing & Forestry | 10 (100.0%) | 0 (0.0%) |
| Construction & Extraction | 194 (85.8%) | 32 (14.2%) |
| Installation, Maintenance & Repair | 74 (89.2%) | 9 (10.8%) |
| Total (Category) | 278 (87.2%) | 41 (12.9%) |
| Total (Overall) | 2,044 (54.2%) | 1,728 (45.8%) |
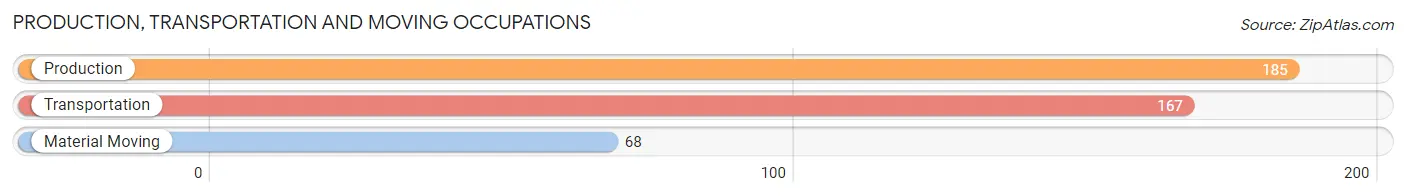
Production, Transportation and Moving Occupations
The most common Production, Transportation and Moving occupations in Woodland Park are Production (185 | 4.9%), Transportation (167 | 4.4%), and Material Moving (68 | 1.8%).
Production, Transportation and Moving Occupations by Sex
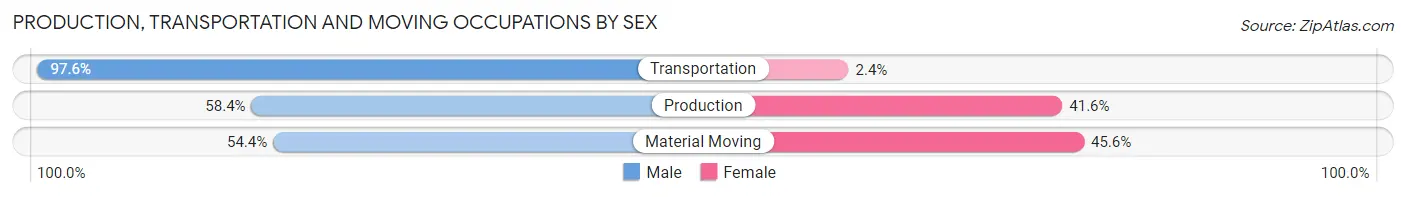
| Occupation | Male | Female |
| Production | 108 (58.4%) | 77 (41.6%) |
| Transportation | 163 (97.6%) | 4 (2.4%) |
| Material Moving | 37 (54.4%) | 31 (45.6%) |
| Total (Category) | 308 (73.3%) | 112 (26.7%) |
| Total (Overall) | 2,044 (54.2%) | 1,728 (45.8%) |
Employment Industries by Sex in Woodland Park
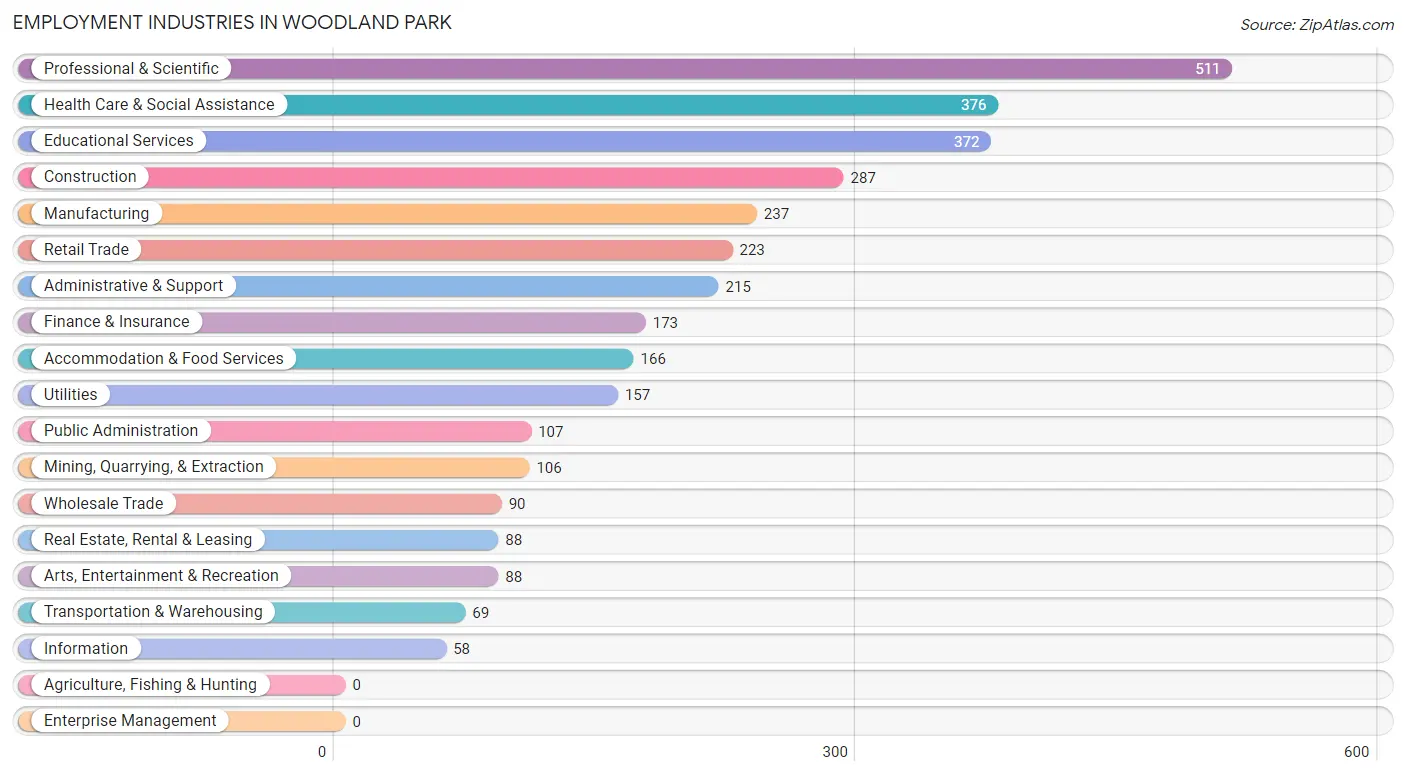
Employment Industries in Woodland Park
The major employment industries in Woodland Park include Professional & Scientific (511 | 13.6%), Health Care & Social Assistance (376 | 10.0%), Educational Services (372 | 9.9%), Construction (287 | 7.6%), and Manufacturing (237 | 6.3%).
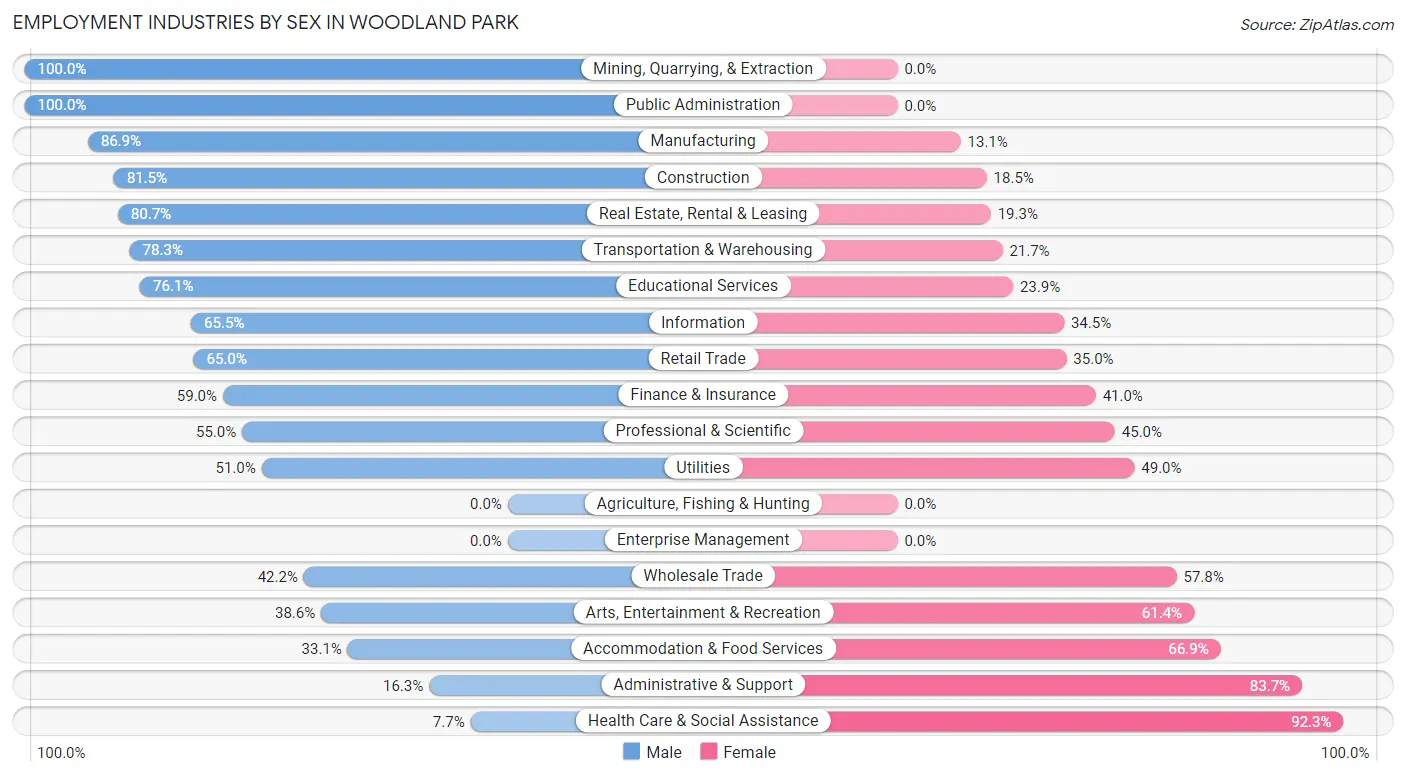
Employment Industries by Sex in Woodland Park
The Woodland Park industries that see more men than women are Mining, Quarrying, & Extraction (100.0%), Public Administration (100.0%), and Manufacturing (86.9%), whereas the industries that tend to have a higher number of women are Health Care & Social Assistance (92.3%), Administrative & Support (83.7%), and Accommodation & Food Services (66.9%).
| Industry | Male | Female |
| Agriculture, Fishing & Hunting | 0 (0.0%) | 0 (0.0%) |
| Mining, Quarrying, & Extraction | 106 (100.0%) | 0 (0.0%) |
| Construction | 234 (81.5%) | 53 (18.5%) |
| Manufacturing | 206 (86.9%) | 31 (13.1%) |
| Wholesale Trade | 38 (42.2%) | 52 (57.8%) |
| Retail Trade | 145 (65.0%) | 78 (35.0%) |
| Transportation & Warehousing | 54 (78.3%) | 15 (21.7%) |
| Utilities | 80 (51.0%) | 77 (49.0%) |
| Information | 38 (65.5%) | 20 (34.5%) |
| Finance & Insurance | 102 (59.0%) | 71 (41.0%) |
| Real Estate, Rental & Leasing | 71 (80.7%) | 17 (19.3%) |
| Professional & Scientific | 281 (55.0%) | 230 (45.0%) |
| Enterprise Management | 0 (0.0%) | 0 (0.0%) |
| Administrative & Support | 35 (16.3%) | 180 (83.7%) |
| Educational Services | 283 (76.1%) | 89 (23.9%) |
| Health Care & Social Assistance | 29 (7.7%) | 347 (92.3%) |
| Arts, Entertainment & Recreation | 34 (38.6%) | 54 (61.4%) |
| Accommodation & Food Services | 55 (33.1%) | 111 (66.9%) |
| Public Administration | 107 (100.0%) | 0 (0.0%) |
| Total | 2,044 (54.2%) | 1,728 (45.8%) |
Education in Woodland Park
School Enrollment in Woodland Park
The most common levels of schooling among the 1,551 students in Woodland Park are high school (427 | 27.5%), college / undergraduate (392 | 25.3%), and elementary school (326 | 21.0%).
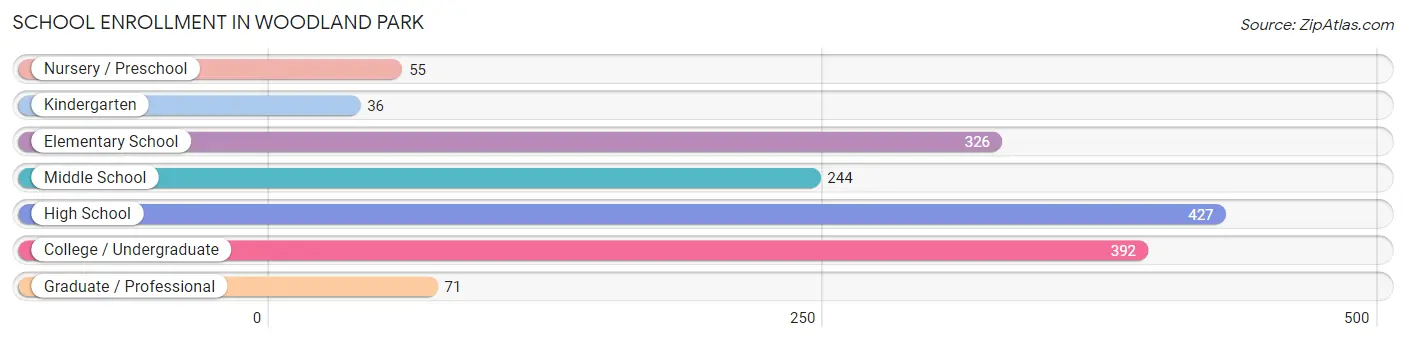
| School Level | # Students | % Students |
| Nursery / Preschool | 55 | 3.5% |
| Kindergarten | 36 | 2.3% |
| Elementary School | 326 | 21.0% |
| Middle School | 244 | 15.7% |
| High School | 427 | 27.5% |
| College / Undergraduate | 392 | 25.3% |
| Graduate / Professional | 71 | 4.6% |
| Total | 1,551 | 100.0% |
School Enrollment by Age by Funding Source in Woodland Park
Out of a total of 1,551 students who are enrolled in schools in Woodland Park, 330 (21.3%) attend a private institution, while the remaining 1,221 (78.7%) are enrolled in public schools. The age group of 20 to 24 year olds has the highest likelihood of being enrolled in private schools, with 100 (90.9% in the age bracket) enrolled. Conversely, the age group of 10 to 14 year olds has the lowest likelihood of being enrolled in a private school, with 260 (100.0% in the age bracket) attending a public institution.
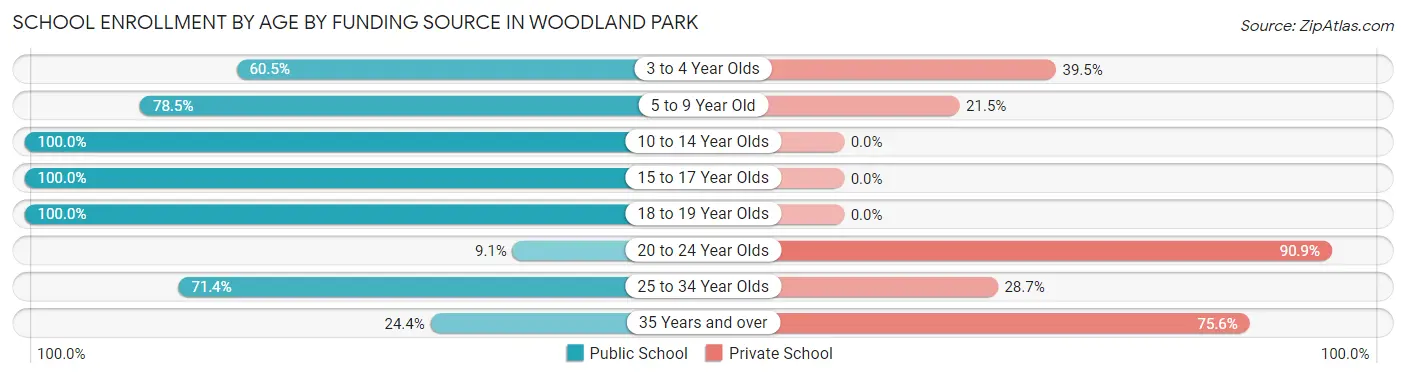
| Age Bracket | Public School | Private School |
| 3 to 4 Year Olds | 23 (60.5%) | 15 (39.5%) |
| 5 to 9 Year Old | 270 (78.5%) | 74 (21.5%) |
| 10 to 14 Year Olds | 260 (100.0%) | 0 (0.0%) |
| 15 to 17 Year Olds | 326 (100.0%) | 0 (0.0%) |
| 18 to 19 Year Olds | 179 (100.0%) | 0 (0.0%) |
| 20 to 24 Year Olds | 10 (9.1%) | 100 (90.9%) |
| 25 to 34 Year Olds | 122 (71.4%) | 49 (28.6%) |
| 35 Years and over | 30 (24.4%) | 93 (75.6%) |
| Total | 1,221 (78.7%) | 330 (21.3%) |
Educational Attainment by Field of Study in Woodland Park
Business (626 | 23.5%), engineering (270 | 10.2%), education (239 | 9.0%), science & technology (224 | 8.4%), and bio, nature & agricultural (194 | 7.3%) are the most common fields of study among 2,659 individuals in Woodland Park who have obtained a bachelor's degree or higher.
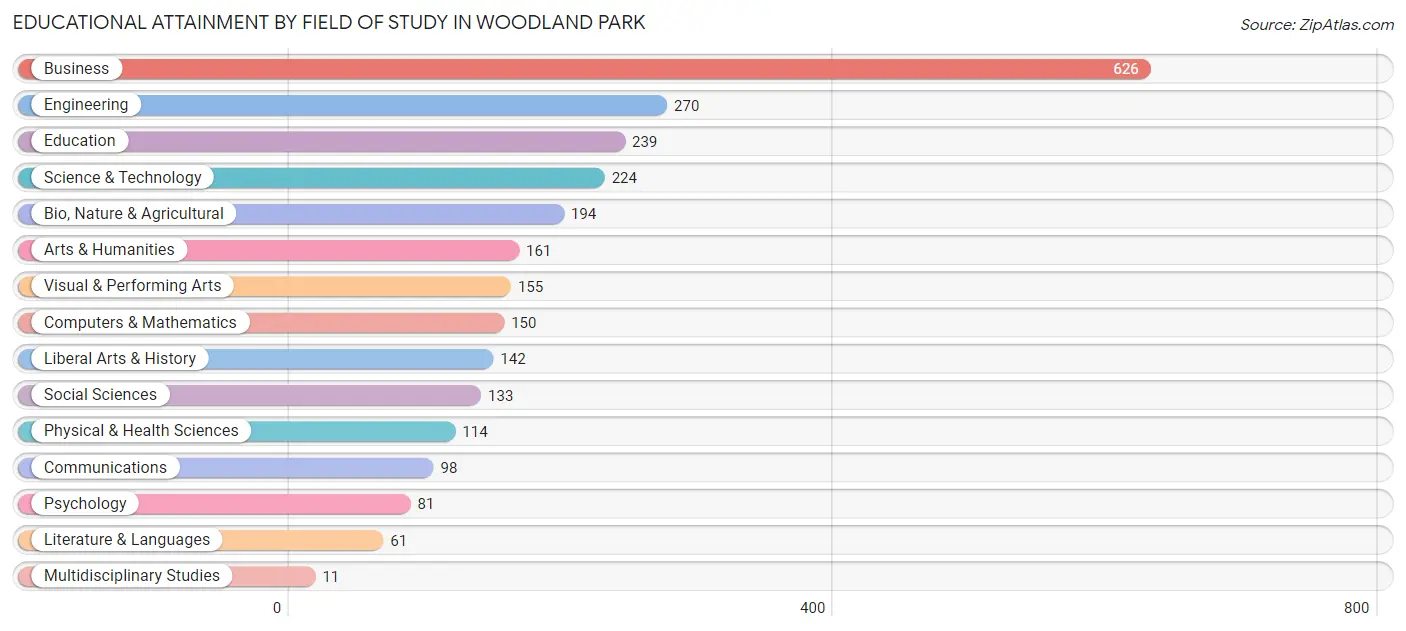
| Field of Study | # Graduates | % Graduates |
| Computers & Mathematics | 150 | 5.6% |
| Bio, Nature & Agricultural | 194 | 7.3% |
| Physical & Health Sciences | 114 | 4.3% |
| Psychology | 81 | 3.0% |
| Social Sciences | 133 | 5.0% |
| Engineering | 270 | 10.2% |
| Multidisciplinary Studies | 11 | 0.4% |
| Science & Technology | 224 | 8.4% |
| Business | 626 | 23.5% |
| Education | 239 | 9.0% |
| Literature & Languages | 61 | 2.3% |
| Liberal Arts & History | 142 | 5.3% |
| Visual & Performing Arts | 155 | 5.8% |
| Communications | 98 | 3.7% |
| Arts & Humanities | 161 | 6.0% |
| Total | 2,659 | 100.0% |
Transportation & Commute in Woodland Park
Vehicle Availability by Sex in Woodland Park
The most prevalent vehicle ownership categories in Woodland Park are males with 2 vehicles (908, accounting for 44.0%) and females with 2 vehicles (724, making up 55.1%).
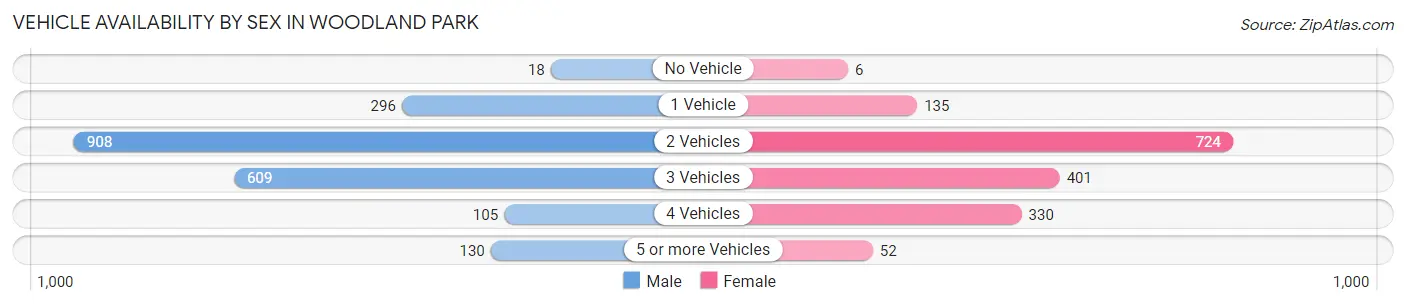
| Vehicles Available | Male | Female |
| No Vehicle | 18 (0.9%) | 6 (0.4%) |
| 1 Vehicle | 296 (14.3%) | 135 (8.2%) |
| 2 Vehicles | 908 (44.0%) | 724 (43.9%) |
| 3 Vehicles | 609 (29.5%) | 401 (24.3%) |
| 4 Vehicles | 105 (5.1%) | 330 (20.0%) |
| 5 or more Vehicles | 130 (6.3%) | 52 (3.2%) |
| Total | 2,066 (100.0%) | 1,648 (100.0%) |
Commute Time in Woodland Park
The most frequently occuring commute durations in Woodland Park are 5 to 9 minutes (548 commuters, 18.4%), 10 to 14 minutes (457 commuters, 15.4%), and 35 to 39 minutes (453 commuters, 15.2%).
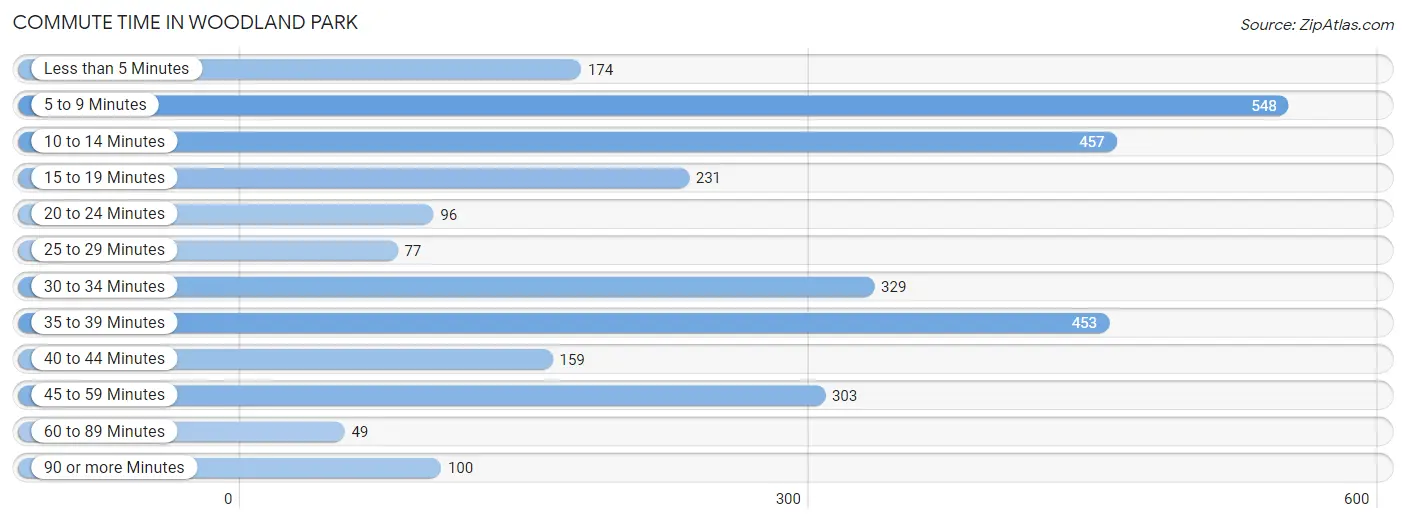
| Commute Time | # Commuters | % Commuters |
| Less than 5 Minutes | 174 | 5.9% |
| 5 to 9 Minutes | 548 | 18.4% |
| 10 to 14 Minutes | 457 | 15.4% |
| 15 to 19 Minutes | 231 | 7.8% |
| 20 to 24 Minutes | 96 | 3.2% |
| 25 to 29 Minutes | 77 | 2.6% |
| 30 to 34 Minutes | 329 | 11.1% |
| 35 to 39 Minutes | 453 | 15.2% |
| 40 to 44 Minutes | 159 | 5.3% |
| 45 to 59 Minutes | 303 | 10.2% |
| 60 to 89 Minutes | 49 | 1.7% |
| 90 or more Minutes | 100 | 3.4% |
Commute Time by Sex in Woodland Park
The most common commute times in Woodland Park are 10 to 14 minutes (321 commuters, 20.0%) for males and 35 to 39 minutes (277 commuters, 20.3%) for females.
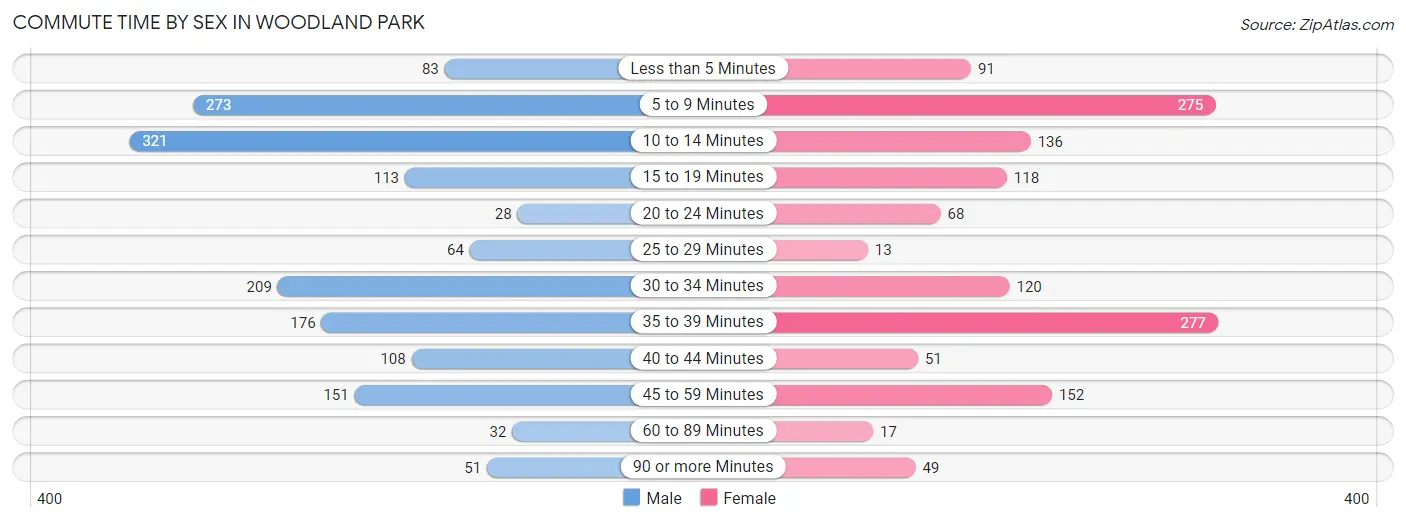
| Commute Time | Male | Female |
| Less than 5 Minutes | 83 (5.2%) | 91 (6.7%) |
| 5 to 9 Minutes | 273 (17.0%) | 275 (20.1%) |
| 10 to 14 Minutes | 321 (20.0%) | 136 (10.0%) |
| 15 to 19 Minutes | 113 (7.0%) | 118 (8.6%) |
| 20 to 24 Minutes | 28 (1.7%) | 68 (5.0%) |
| 25 to 29 Minutes | 64 (4.0%) | 13 (0.9%) |
| 30 to 34 Minutes | 209 (13.0%) | 120 (8.8%) |
| 35 to 39 Minutes | 176 (10.9%) | 277 (20.3%) |
| 40 to 44 Minutes | 108 (6.7%) | 51 (3.7%) |
| 45 to 59 Minutes | 151 (9.4%) | 152 (11.1%) |
| 60 to 89 Minutes | 32 (2.0%) | 17 (1.2%) |
| 90 or more Minutes | 51 (3.2%) | 49 (3.6%) |
Time of Departure to Work by Sex in Woodland Park
The most frequent times of departure to work in Woodland Park are 8:00 AM to 8:29 AM (282, 17.5%) for males and 7:00 AM to 7:29 AM (242, 17.7%) for females.
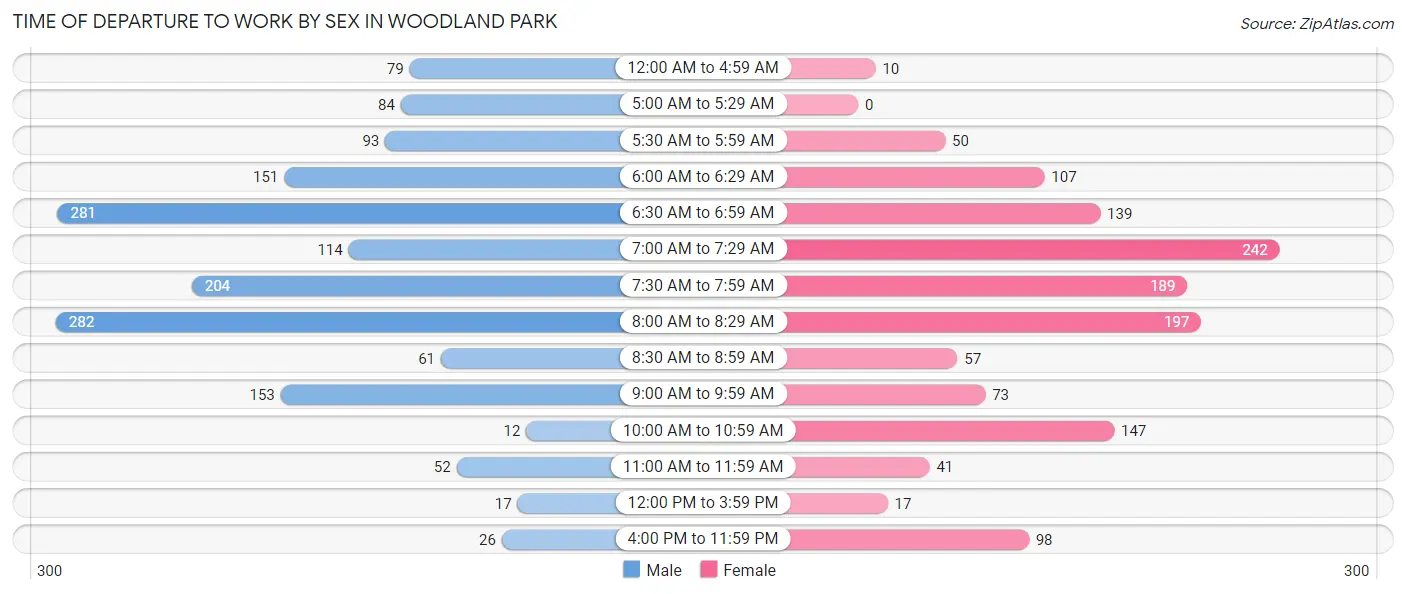
| Time of Departure | Male | Female |
| 12:00 AM to 4:59 AM | 79 (4.9%) | 10 (0.7%) |
| 5:00 AM to 5:29 AM | 84 (5.2%) | 0 (0.0%) |
| 5:30 AM to 5:59 AM | 93 (5.8%) | 50 (3.7%) |
| 6:00 AM to 6:29 AM | 151 (9.4%) | 107 (7.8%) |
| 6:30 AM to 6:59 AM | 281 (17.5%) | 139 (10.2%) |
| 7:00 AM to 7:29 AM | 114 (7.1%) | 242 (17.7%) |
| 7:30 AM to 7:59 AM | 204 (12.7%) | 189 (13.8%) |
| 8:00 AM to 8:29 AM | 282 (17.5%) | 197 (14.4%) |
| 8:30 AM to 8:59 AM | 61 (3.8%) | 57 (4.2%) |
| 9:00 AM to 9:59 AM | 153 (9.5%) | 73 (5.3%) |
| 10:00 AM to 10:59 AM | 12 (0.7%) | 147 (10.7%) |
| 11:00 AM to 11:59 AM | 52 (3.2%) | 41 (3.0%) |
| 12:00 PM to 3:59 PM | 17 (1.1%) | 17 (1.2%) |
| 4:00 PM to 11:59 PM | 26 (1.6%) | 98 (7.2%) |
| Total | 1,609 (100.0%) | 1,367 (100.0%) |
Housing Occupancy in Woodland Park
Occupancy by Ownership in Woodland Park
Of the total 3,265 dwellings in Woodland Park, owner-occupied units account for 2,383 (73.0%), while renter-occupied units make up 882 (27.0%).
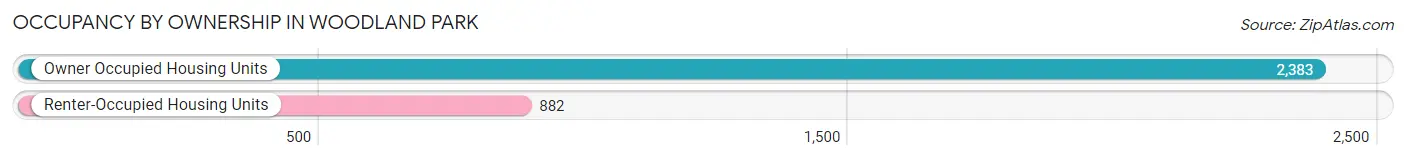
| Occupancy | # Housing Units | % Housing Units |
| Owner Occupied Housing Units | 2,383 | 73.0% |
| Renter-Occupied Housing Units | 882 | 27.0% |
| Total Occupied Housing Units | 3,265 | 100.0% |
Occupancy by Household Size in Woodland Park
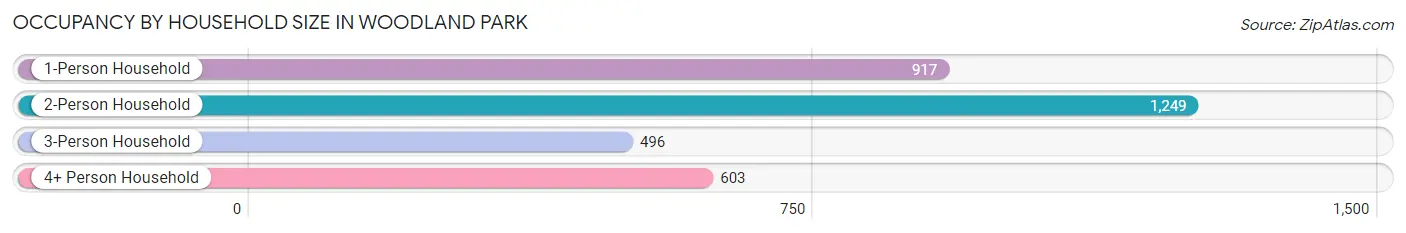
| Household Size | # Housing Units | % Housing Units |
| 1-Person Household | 917 | 28.1% |
| 2-Person Household | 1,249 | 38.3% |
| 3-Person Household | 496 | 15.2% |
| 4+ Person Household | 603 | 18.5% |
| Total Housing Units | 3,265 | 100.0% |
Occupancy by Ownership by Household Size in Woodland Park
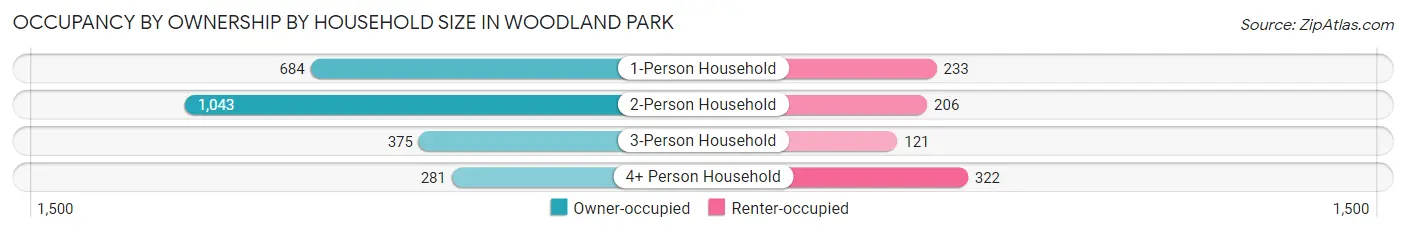
| Household Size | Owner-occupied | Renter-occupied |
| 1-Person Household | 684 (74.6%) | 233 (25.4%) |
| 2-Person Household | 1,043 (83.5%) | 206 (16.5%) |
| 3-Person Household | 375 (75.6%) | 121 (24.4%) |
| 4+ Person Household | 281 (46.6%) | 322 (53.4%) |
| Total Housing Units | 2,383 (73.0%) | 882 (27.0%) |
Occupancy by Educational Attainment in Woodland Park
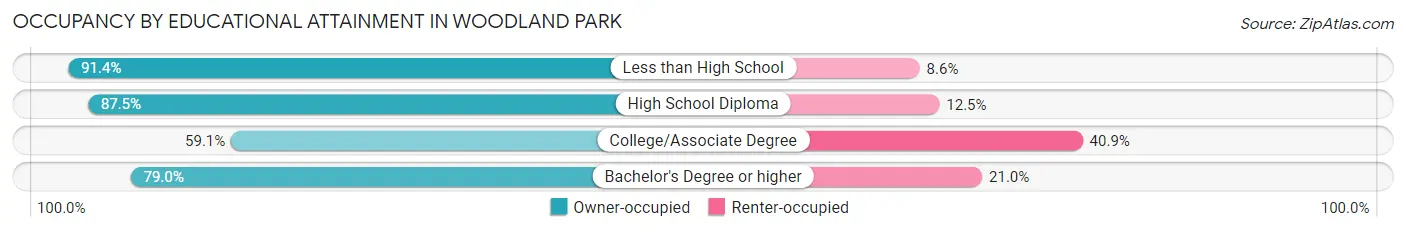
| Household Size | Owner-occupied | Renter-occupied |
| Less than High School | 106 (91.4%) | 10 (8.6%) |
| High School Diploma | 405 (87.5%) | 58 (12.5%) |
| College/Associate Degree | 740 (59.1%) | 513 (40.9%) |
| Bachelor's Degree or higher | 1,132 (79.0%) | 301 (21.0%) |
Occupancy by Age of Householder in Woodland Park
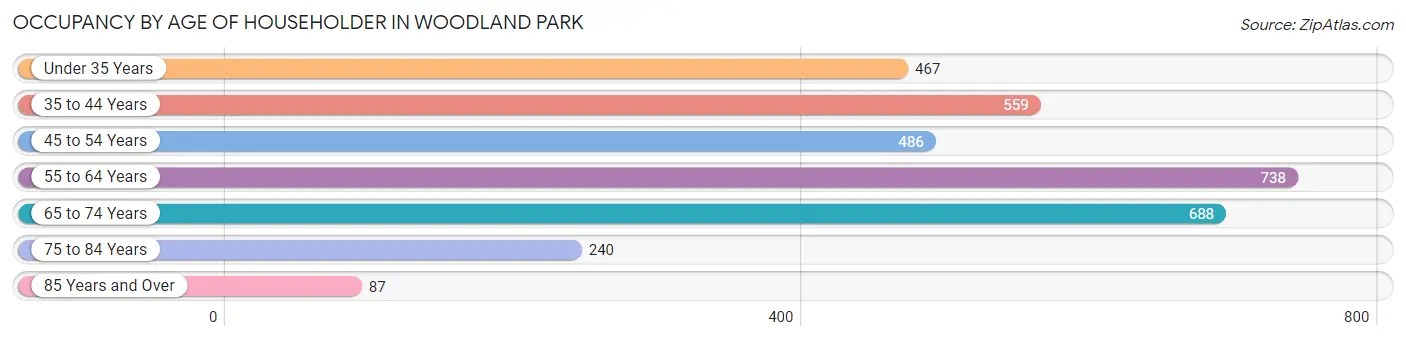
| Age Bracket | # Households | % Households |
| Under 35 Years | 467 | 14.3% |
| 35 to 44 Years | 559 | 17.1% |
| 45 to 54 Years | 486 | 14.9% |
| 55 to 64 Years | 738 | 22.6% |
| 65 to 74 Years | 688 | 21.1% |
| 75 to 84 Years | 240 | 7.3% |
| 85 Years and Over | 87 | 2.7% |
| Total | 3,265 | 100.0% |
Housing Finances in Woodland Park
Median Income by Occupancy in Woodland Park
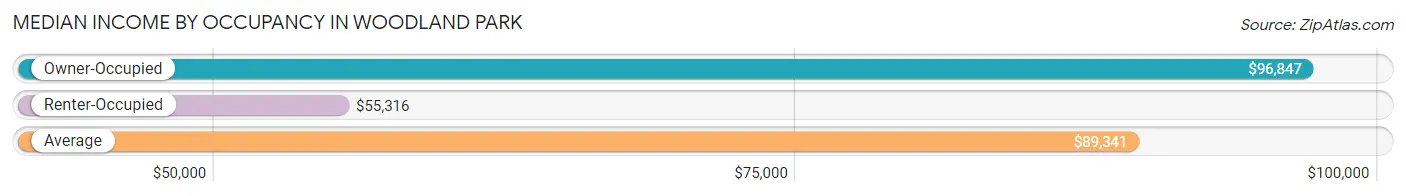
| Occupancy Type | # Households | Median Income |
| Owner-Occupied | 2,383 (73.0%) | $96,847 |
| Renter-Occupied | 882 (27.0%) | $55,316 |
| Average | 3,265 (100.0%) | $89,341 |
Occupancy by Householder Income Bracket in Woodland Park
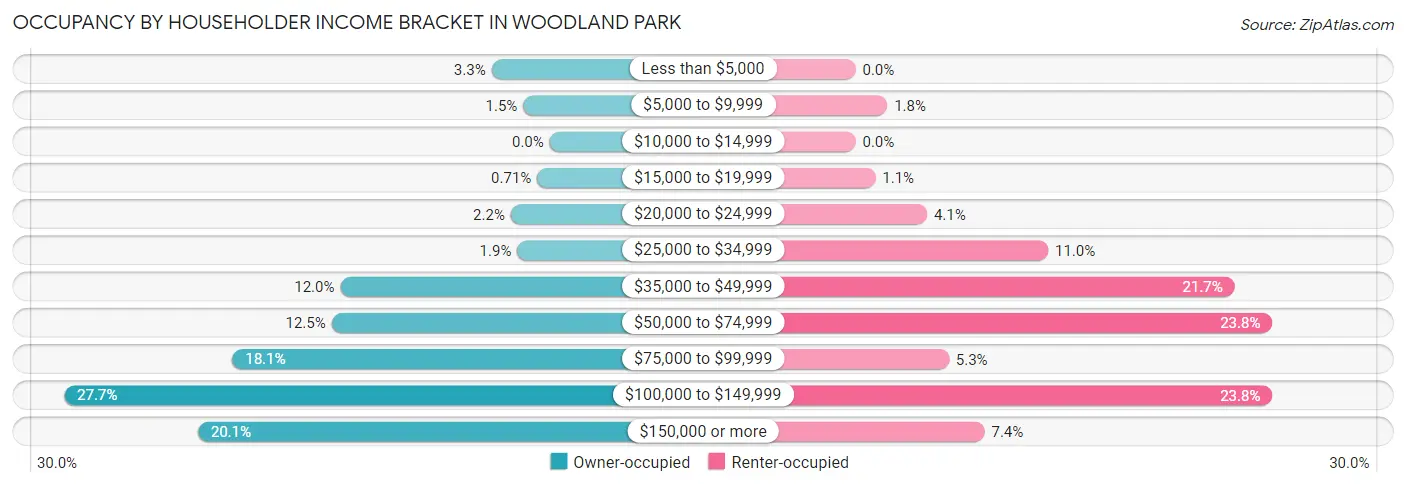
| Income Bracket | Owner-occupied | Renter-occupied |
| Less than $5,000 | 79 (3.3%) | 0 (0.0%) |
| $5,000 to $9,999 | 36 (1.5%) | 16 (1.8%) |
| $10,000 to $14,999 | 0 (0.0%) | 0 (0.0%) |
| $15,000 to $19,999 | 17 (0.7%) | 10 (1.1%) |
| $20,000 to $24,999 | 53 (2.2%) | 36 (4.1%) |
| $25,000 to $34,999 | 44 (1.8%) | 97 (11.0%) |
| $35,000 to $49,999 | 285 (12.0%) | 191 (21.7%) |
| $50,000 to $74,999 | 297 (12.5%) | 210 (23.8%) |
| $75,000 to $99,999 | 432 (18.1%) | 47 (5.3%) |
| $100,000 to $149,999 | 661 (27.7%) | 210 (23.8%) |
| $150,000 or more | 479 (20.1%) | 65 (7.4%) |
| Total | 2,383 (100.0%) | 882 (100.0%) |
Monthly Housing Cost Tiers in Woodland Park
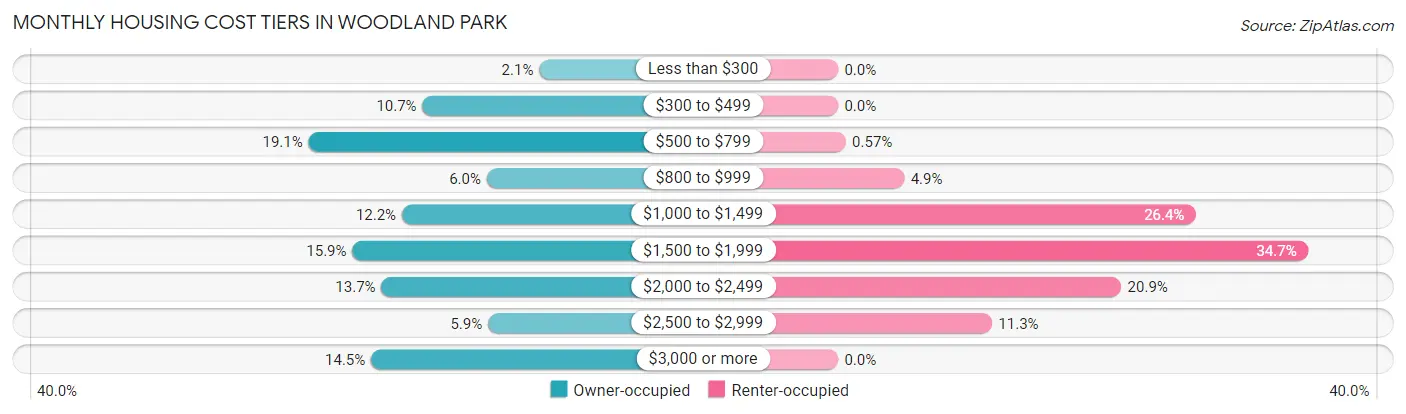
| Monthly Cost | Owner-occupied | Renter-occupied |
| Less than $300 | 50 (2.1%) | 0 (0.0%) |
| $300 to $499 | 255 (10.7%) | 0 (0.0%) |
| $500 to $799 | 455 (19.1%) | 5 (0.6%) |
| $800 to $999 | 142 (6.0%) | 43 (4.9%) |
| $1,000 to $1,499 | 291 (12.2%) | 233 (26.4%) |
| $1,500 to $1,999 | 378 (15.9%) | 306 (34.7%) |
| $2,000 to $2,499 | 327 (13.7%) | 184 (20.9%) |
| $2,500 to $2,999 | 140 (5.9%) | 100 (11.3%) |
| $3,000 or more | 345 (14.5%) | 0 (0.0%) |
| Total | 2,383 (100.0%) | 882 (100.0%) |
Physical Housing Characteristics in Woodland Park
Housing Structures in Woodland Park
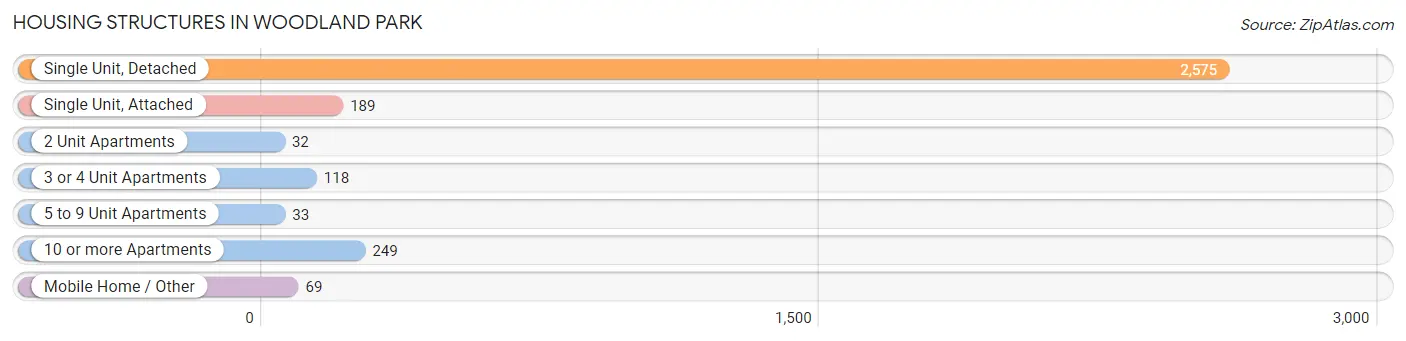
| Structure Type | # Housing Units | % Housing Units |
| Single Unit, Detached | 2,575 | 78.9% |
| Single Unit, Attached | 189 | 5.8% |
| 2 Unit Apartments | 32 | 1.0% |
| 3 or 4 Unit Apartments | 118 | 3.6% |
| 5 to 9 Unit Apartments | 33 | 1.0% |
| 10 or more Apartments | 249 | 7.6% |
| Mobile Home / Other | 69 | 2.1% |
| Total | 3,265 | 100.0% |
Housing Structures by Occupancy in Woodland Park
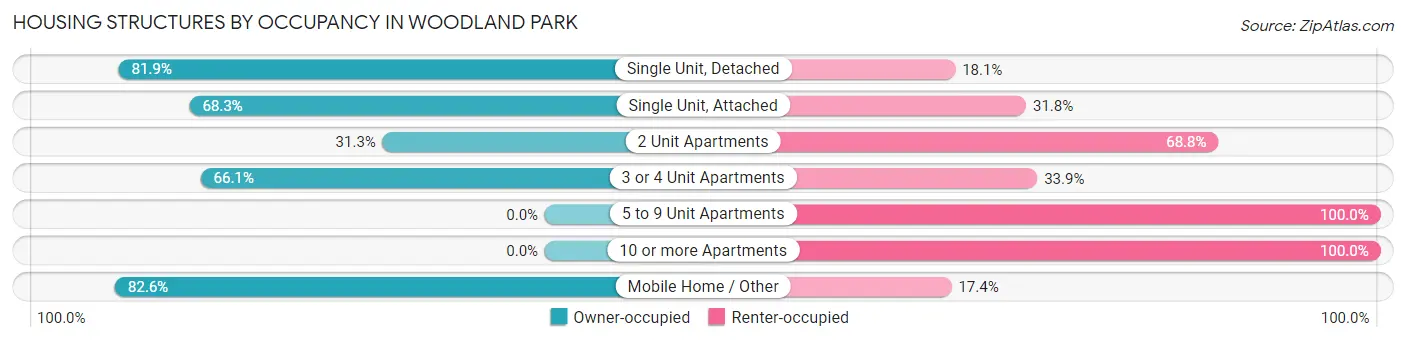
| Structure Type | Owner-occupied | Renter-occupied |
| Single Unit, Detached | 2,109 (81.9%) | 466 (18.1%) |
| Single Unit, Attached | 129 (68.2%) | 60 (31.8%) |
| 2 Unit Apartments | 10 (31.2%) | 22 (68.8%) |
| 3 or 4 Unit Apartments | 78 (66.1%) | 40 (33.9%) |
| 5 to 9 Unit Apartments | 0 (0.0%) | 33 (100.0%) |
| 10 or more Apartments | 0 (0.0%) | 249 (100.0%) |
| Mobile Home / Other | 57 (82.6%) | 12 (17.4%) |
| Total | 2,383 (73.0%) | 882 (27.0%) |
Housing Structures by Number of Rooms in Woodland Park
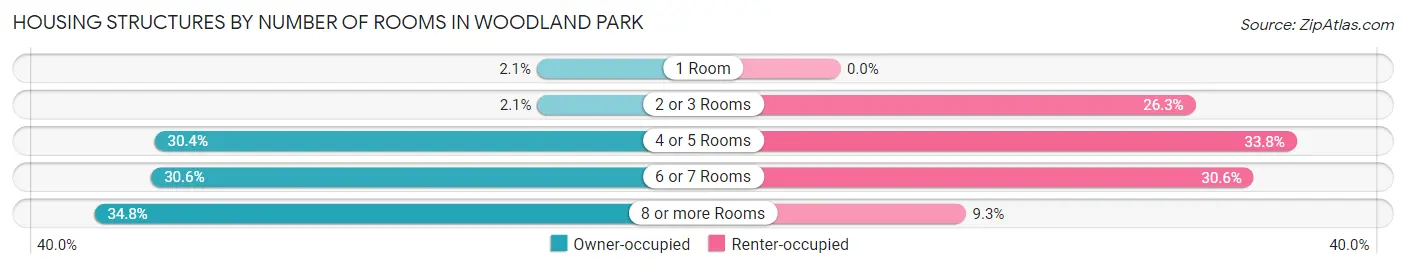
| Number of Rooms | Owner-occupied | Renter-occupied |
| 1 Room | 50 (2.1%) | 0 (0.0%) |
| 2 or 3 Rooms | 49 (2.1%) | 232 (26.3%) |
| 4 or 5 Rooms | 724 (30.4%) | 298 (33.8%) |
| 6 or 7 Rooms | 730 (30.6%) | 270 (30.6%) |
| 8 or more Rooms | 830 (34.8%) | 82 (9.3%) |
| Total | 2,383 (100.0%) | 882 (100.0%) |
Housing Structure by Heating Type in Woodland Park
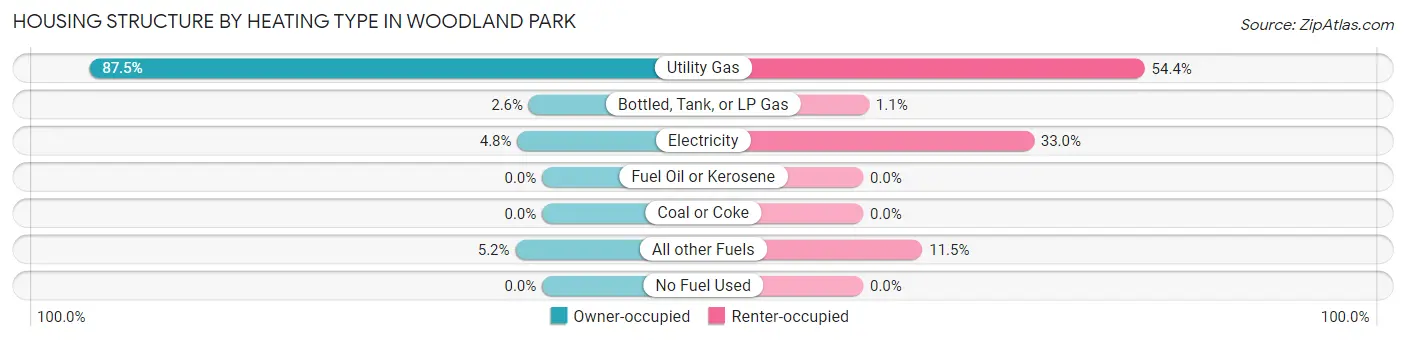
| Heating Type | Owner-occupied | Renter-occupied |
| Utility Gas | 2,085 (87.5%) | 480 (54.4%) |
| Bottled, Tank, or LP Gas | 61 (2.6%) | 10 (1.1%) |
| Electricity | 114 (4.8%) | 291 (33.0%) |
| Fuel Oil or Kerosene | 0 (0.0%) | 0 (0.0%) |
| Coal or Coke | 0 (0.0%) | 0 (0.0%) |
| All other Fuels | 123 (5.2%) | 101 (11.5%) |
| No Fuel Used | 0 (0.0%) | 0 (0.0%) |
| Total | 2,383 (100.0%) | 882 (100.0%) |
Household Vehicle Usage in Woodland Park
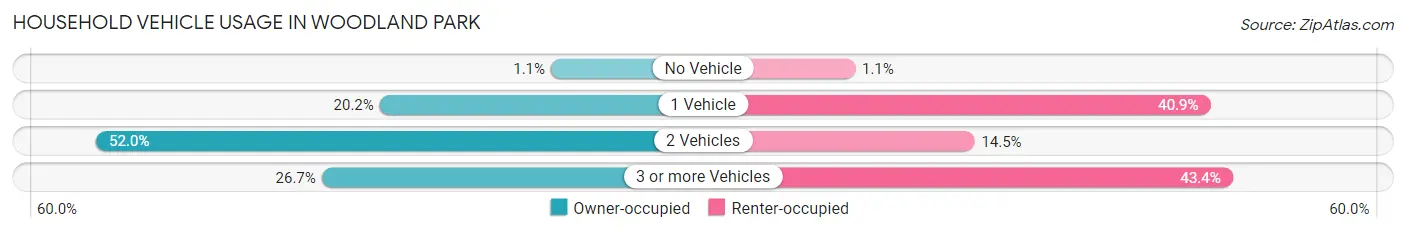
| Vehicles per Household | Owner-occupied | Renter-occupied |
| No Vehicle | 25 (1.1%) | 10 (1.1%) |
| 1 Vehicle | 482 (20.2%) | 361 (40.9%) |
| 2 Vehicles | 1,239 (52.0%) | 128 (14.5%) |
| 3 or more Vehicles | 637 (26.7%) | 383 (43.4%) |
| Total | 2,383 (100.0%) | 882 (100.0%) |
Real Estate & Mortgages in Woodland Park
Real Estate and Mortgage Overview in Woodland Park
| Characteristic | Without Mortgage | With Mortgage |
| Housing Units | 843 | 1,540 |
| Median Property Value | $458,400 | $460,700 |
| Median Household Income | $72,545 | $345 |
| Monthly Housing Costs | $571 | $345 |
| Real Estate Taxes | $2,047 | $0 |
Property Value by Mortgage Status in Woodland Park
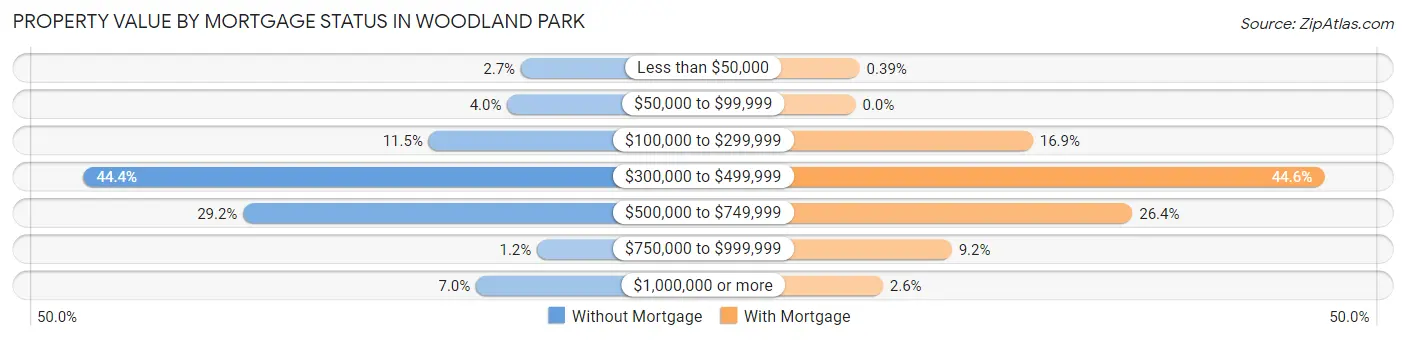
| Property Value | Without Mortgage | With Mortgage |
| Less than $50,000 | 23 (2.7%) | 6 (0.4%) |
| $50,000 to $99,999 | 34 (4.0%) | 0 (0.0%) |
| $100,000 to $299,999 | 97 (11.5%) | 260 (16.9%) |
| $300,000 to $499,999 | 374 (44.4%) | 687 (44.6%) |
| $500,000 to $749,999 | 246 (29.2%) | 406 (26.4%) |
| $750,000 to $999,999 | 10 (1.2%) | 141 (9.2%) |
| $1,000,000 or more | 59 (7.0%) | 40 (2.6%) |
| Total | 843 (100.0%) | 1,540 (100.0%) |
Household Income by Mortgage Status in Woodland Park
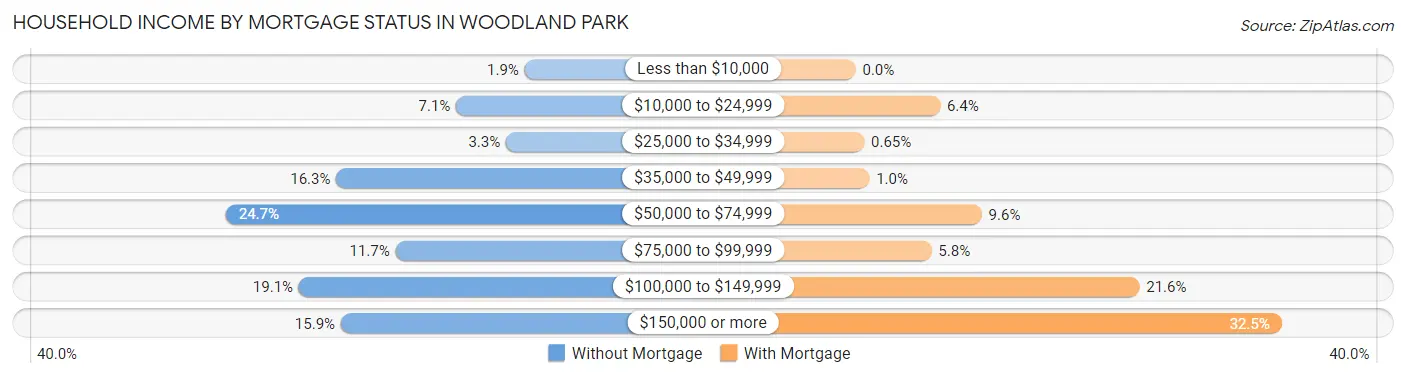
| Household Income | Without Mortgage | With Mortgage |
| Less than $10,000 | 16 (1.9%) | 0 (0.0%) |
| $10,000 to $24,999 | 60 (7.1%) | 99 (6.4%) |
| $25,000 to $34,999 | 28 (3.3%) | 10 (0.6%) |
| $35,000 to $49,999 | 137 (16.3%) | 16 (1.0%) |
| $50,000 to $74,999 | 208 (24.7%) | 148 (9.6%) |
| $75,000 to $99,999 | 99 (11.7%) | 89 (5.8%) |
| $100,000 to $149,999 | 161 (19.1%) | 333 (21.6%) |
| $150,000 or more | 134 (15.9%) | 500 (32.5%) |
| Total | 843 (100.0%) | 1,540 (100.0%) |
Property Value to Household Income Ratio in Woodland Park
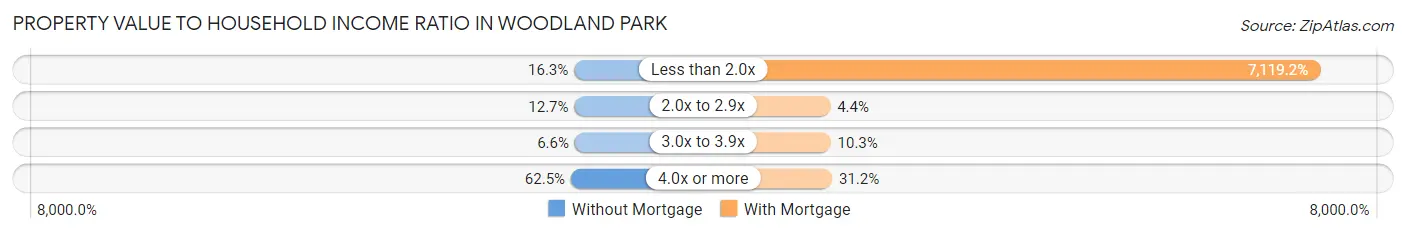
| Value-to-Income Ratio | Without Mortgage | With Mortgage |
| Less than 2.0x | 137 (16.3%) | 109,636 (7,119.2%) |
| 2.0x to 2.9x | 107 (12.7%) | 67 (4.3%) |
| 3.0x to 3.9x | 56 (6.6%) | 159 (10.3%) |
| 4.0x or more | 527 (62.5%) | 481 (31.2%) |
| Total | 843 (100.0%) | 1,540 (100.0%) |
Real Estate Taxes by Mortgage Status in Woodland Park
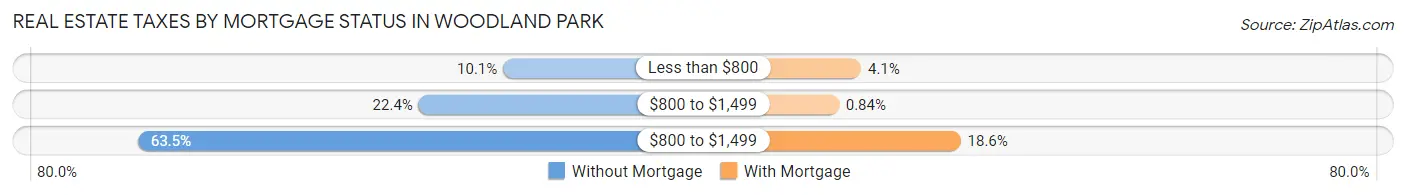
| Property Taxes | Without Mortgage | With Mortgage |
| Less than $800 | 85 (10.1%) | 63 (4.1%) |
| $800 to $1,499 | 189 (22.4%) | 13 (0.8%) |
| $800 to $1,499 | 535 (63.5%) | 287 (18.6%) |
| Total | 843 (100.0%) | 1,540 (100.0%) |
Health & Disability in Woodland Park
Health Insurance Coverage by Age in Woodland Park
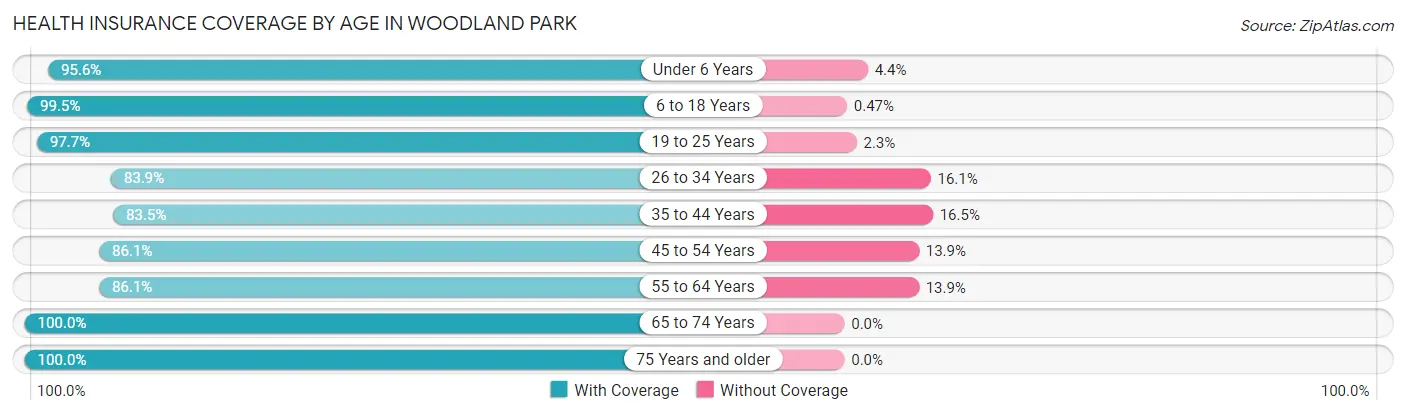
| Age Bracket | With Coverage | Without Coverage |
| Under 6 Years | 549 (95.6%) | 25 (4.4%) |
| 6 to 18 Years | 1,053 (99.5%) | 5 (0.5%) |
| 19 to 25 Years | 558 (97.7%) | 13 (2.3%) |
| 26 to 34 Years | 829 (83.9%) | 159 (16.1%) |
| 35 to 44 Years | 714 (83.5%) | 141 (16.5%) |
| 45 to 54 Years | 719 (86.1%) | 116 (13.9%) |
| 55 to 64 Years | 1,186 (86.1%) | 191 (13.9%) |
| 65 to 74 Years | 1,024 (100.0%) | 0 (0.0%) |
| 75 Years and older | 603 (100.0%) | 0 (0.0%) |
| Total | 7,235 (91.8%) | 650 (8.2%) |
Health Insurance Coverage by Citizenship Status in Woodland Park
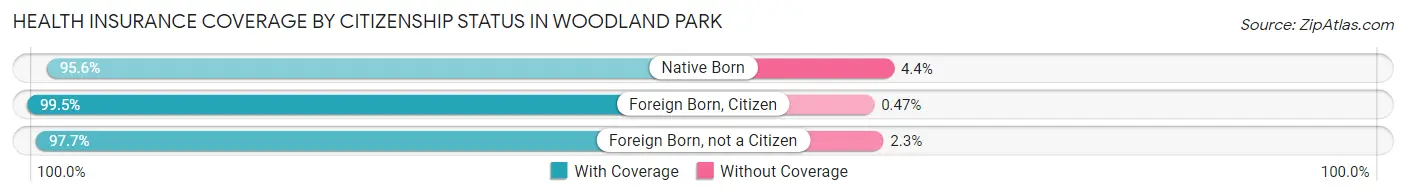
| Citizenship Status | With Coverage | Without Coverage |
| Native Born | 549 (95.6%) | 25 (4.4%) |
| Foreign Born, Citizen | 1,053 (99.5%) | 5 (0.5%) |
| Foreign Born, not a Citizen | 558 (97.7%) | 13 (2.3%) |
Health Insurance Coverage by Household Income in Woodland Park
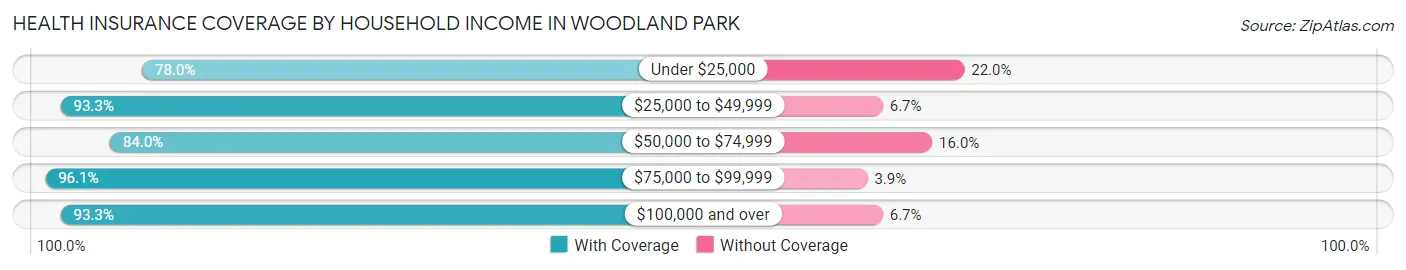
| Household Income | With Coverage | Without Coverage |
| Under $25,000 | 209 (78.0%) | 59 (22.0%) |
| $25,000 to $49,999 | 1,148 (93.3%) | 83 (6.7%) |
| $50,000 to $74,999 | 1,072 (84.0%) | 204 (16.0%) |
| $75,000 to $99,999 | 1,342 (96.1%) | 54 (3.9%) |
| $100,000 and over | 3,460 (93.3%) | 250 (6.7%) |
Public vs Private Health Insurance Coverage by Age in Woodland Park
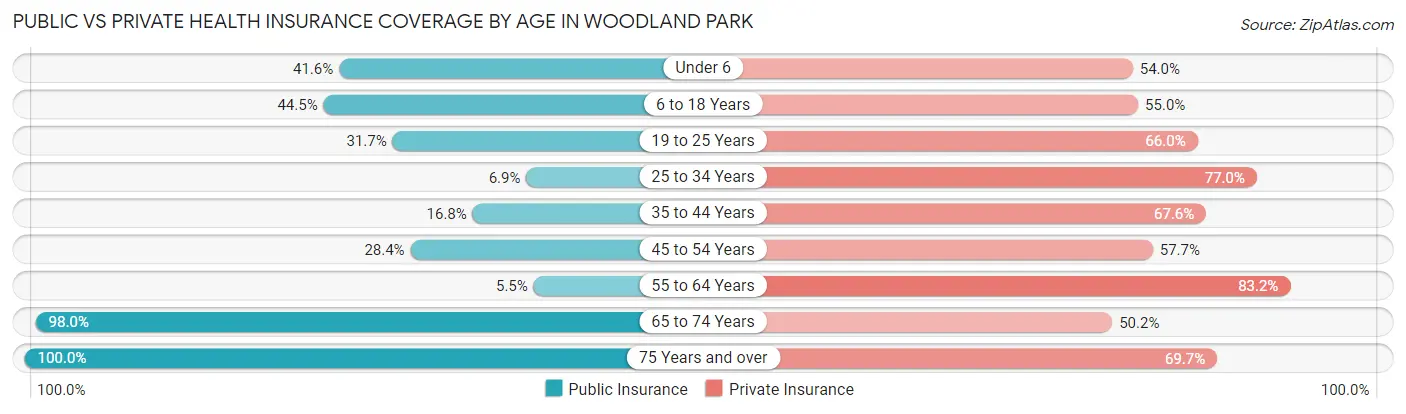
| Age Bracket | Public Insurance | Private Insurance |
| Under 6 | 239 (41.6%) | 310 (54.0%) |
| 6 to 18 Years | 471 (44.5%) | 582 (55.0%) |
| 19 to 25 Years | 181 (31.7%) | 377 (66.0%) |
| 25 to 34 Years | 68 (6.9%) | 761 (77.0%) |
| 35 to 44 Years | 144 (16.8%) | 578 (67.6%) |
| 45 to 54 Years | 237 (28.4%) | 482 (57.7%) |
| 55 to 64 Years | 76 (5.5%) | 1,146 (83.2%) |
| 65 to 74 Years | 1,003 (98.0%) | 514 (50.2%) |
| 75 Years and over | 603 (100.0%) | 420 (69.7%) |
| Total | 3,022 (38.3%) | 5,170 (65.6%) |
Disability Status by Sex by Age in Woodland Park
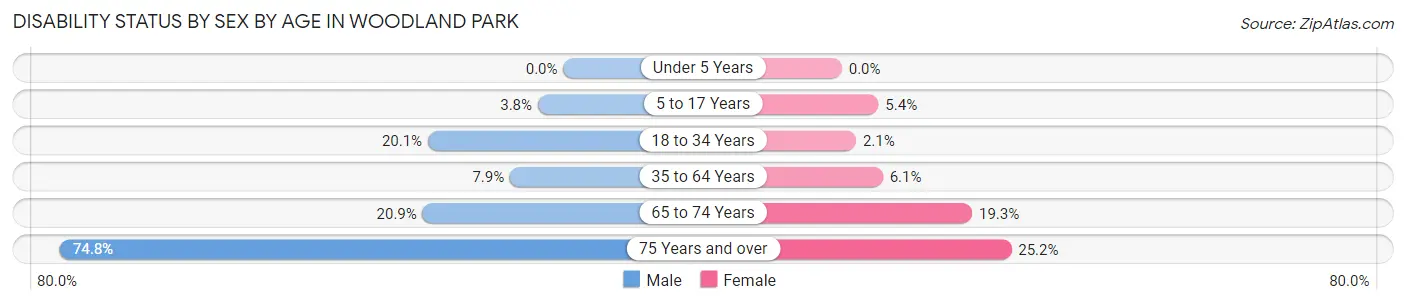
| Age Bracket | Male | Female |
| Under 5 Years | 0 (0.0%) | 0 (0.0%) |
| 5 to 17 Years | 20 (3.8%) | 28 (5.4%) |
| 18 to 34 Years | 176 (20.1%) | 17 (2.1%) |
| 35 to 64 Years | 127 (7.9%) | 89 (6.1%) |
| 65 to 74 Years | 107 (20.9%) | 99 (19.3%) |
| 75 Years and over | 228 (74.8%) | 75 (25.2%) |
Disability Class by Sex by Age in Woodland Park
Disability Class: Hearing Difficulty
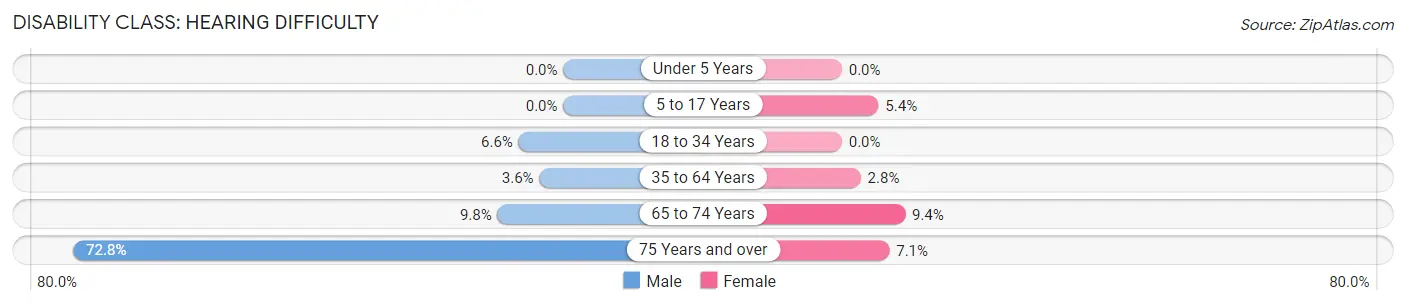
| Age Bracket | Male | Female |
| Under 5 Years | 0 (0.0%) | 0 (0.0%) |
| 5 to 17 Years | 0 (0.0%) | 28 (5.4%) |
| 18 to 34 Years | 58 (6.6%) | 0 (0.0%) |
| 35 to 64 Years | 57 (3.5%) | 41 (2.8%) |
| 65 to 74 Years | 50 (9.8%) | 48 (9.4%) |
| 75 Years and over | 222 (72.8%) | 21 (7.0%) |
Disability Class: Vision Difficulty
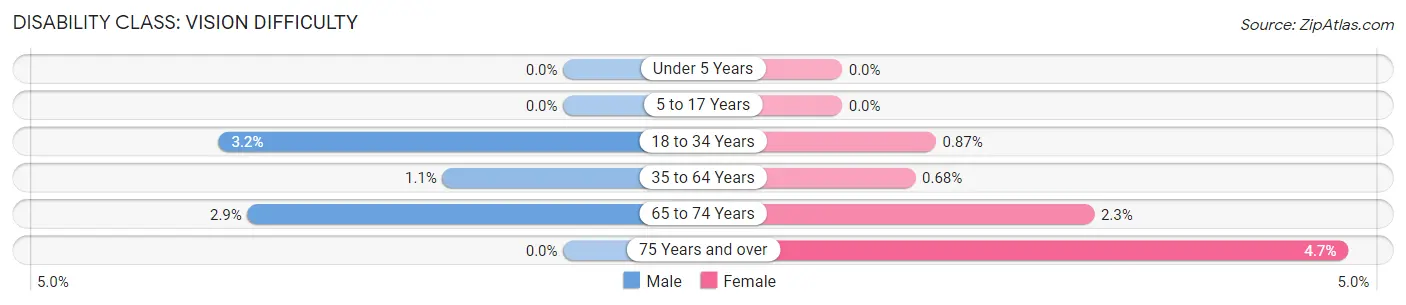
| Age Bracket | Male | Female |
| Under 5 Years | 0 (0.0%) | 0 (0.0%) |
| 5 to 17 Years | 0 (0.0%) | 0 (0.0%) |
| 18 to 34 Years | 28 (3.2%) | 7 (0.9%) |
| 35 to 64 Years | 18 (1.1%) | 10 (0.7%) |
| 65 to 74 Years | 15 (2.9%) | 12 (2.3%) |
| 75 Years and over | 0 (0.0%) | 14 (4.7%) |
Disability Class: Cognitive Difficulty
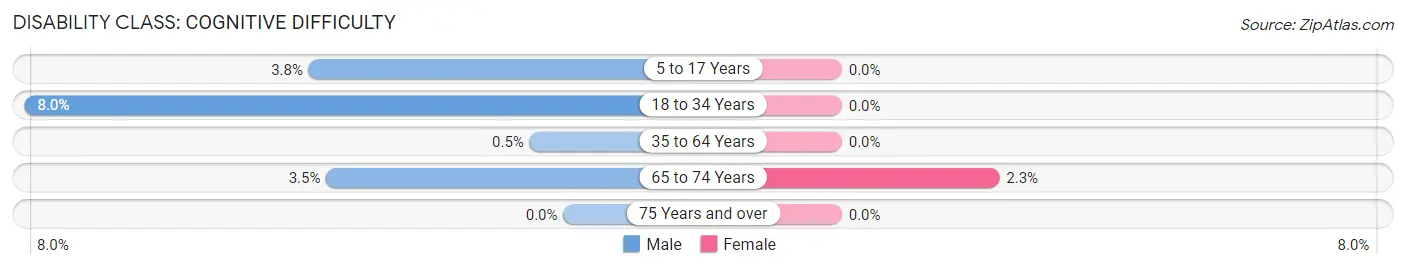
| Age Bracket | Male | Female |
| 5 to 17 Years | 20 (3.8%) | 0 (0.0%) |
| 18 to 34 Years | 70 (8.0%) | 0 (0.0%) |
| 35 to 64 Years | 8 (0.5%) | 0 (0.0%) |
| 65 to 74 Years | 18 (3.5%) | 12 (2.3%) |
| 75 Years and over | 0 (0.0%) | 0 (0.0%) |
Disability Class: Ambulatory Difficulty
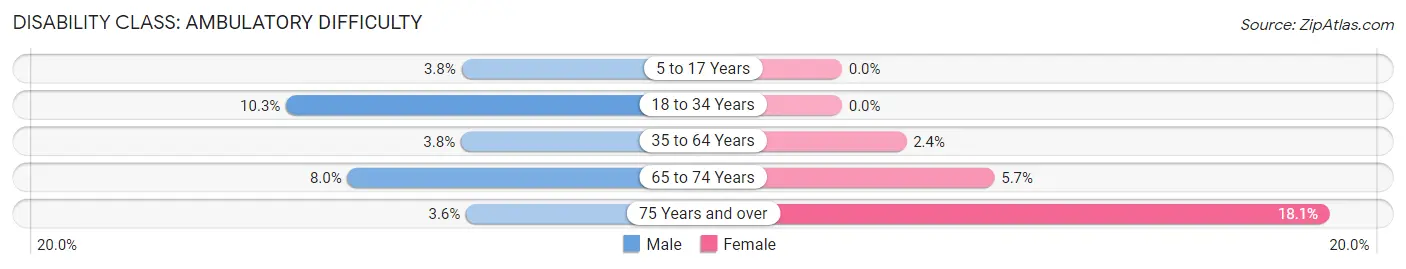
| Age Bracket | Male | Female |
| 5 to 17 Years | 20 (3.8%) | 0 (0.0%) |
| 18 to 34 Years | 90 (10.3%) | 0 (0.0%) |
| 35 to 64 Years | 61 (3.8%) | 35 (2.4%) |
| 65 to 74 Years | 41 (8.0%) | 29 (5.7%) |
| 75 Years and over | 11 (3.6%) | 54 (18.1%) |
Disability Class: Self-Care Difficulty
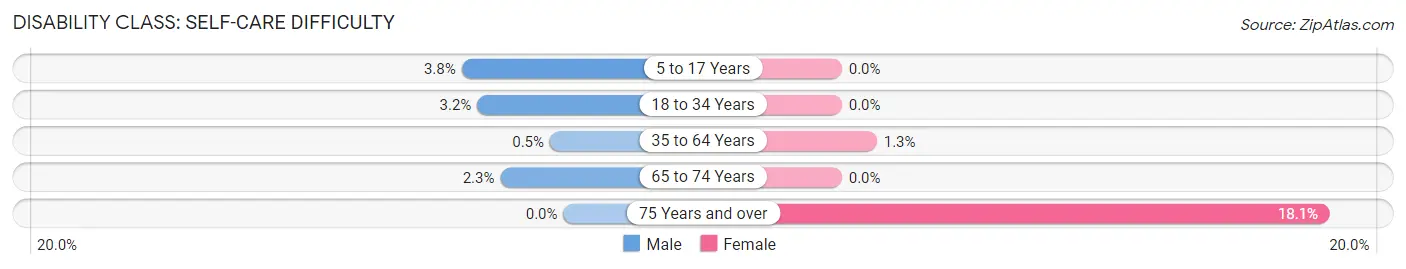
| Age Bracket | Male | Female |
| 5 to 17 Years | 20 (3.8%) | 0 (0.0%) |
| 18 to 34 Years | 28 (3.2%) | 0 (0.0%) |
| 35 to 64 Years | 8 (0.5%) | 19 (1.3%) |
| 65 to 74 Years | 12 (2.3%) | 0 (0.0%) |
| 75 Years and over | 0 (0.0%) | 54 (18.1%) |
Technology Access in Woodland Park
Computing Device Access in Woodland Park
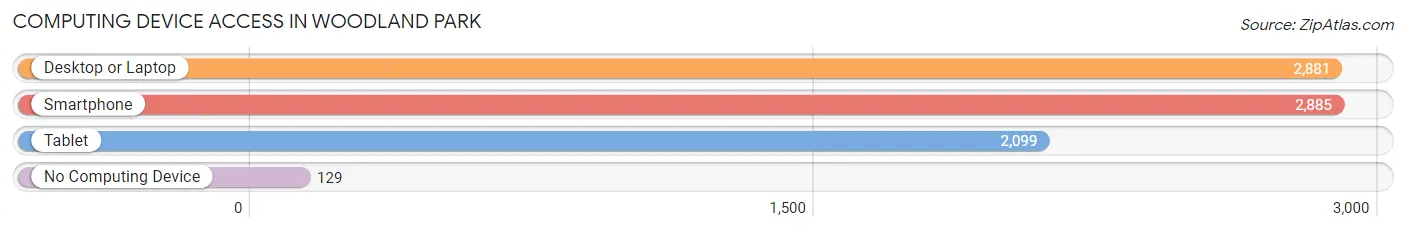
| Device Type | # Households | % Households |
| Desktop or Laptop | 2,881 | 88.2% |
| Smartphone | 2,885 | 88.4% |
| Tablet | 2,099 | 64.3% |
| No Computing Device | 129 | 4.0% |
| Total | 3,265 | 100.0% |
Internet Access in Woodland Park
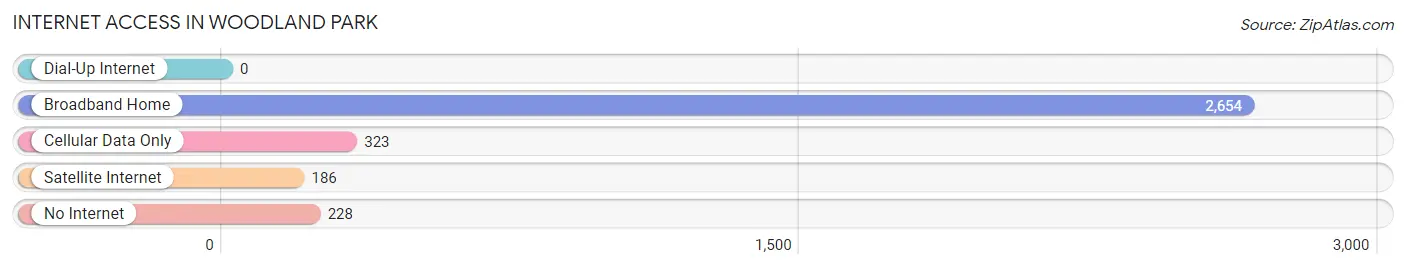
| Internet Type | # Households | % Households |
| Dial-Up Internet | 0 | 0.0% |
| Broadband Home | 2,654 | 81.3% |
| Cellular Data Only | 323 | 9.9% |
| Satellite Internet | 186 | 5.7% |
| No Internet | 228 | 7.0% |
| Total | 3,265 | 100.0% |
Woodland Park Summary
Woodland Park is a city located in Teller County, Colorado, United States. The city is situated at an elevation of 8,465 feet (2,584 m) in the Rocky Mountains, just west of Colorado Springs. As of the 2010 census, the city had a population of 6,515.
History
Woodland Park was founded in 1891 by General William Jackson Palmer, the founder of the Denver and Rio Grande Railroad. The city was originally named Ute Pass, but was renamed Woodland Park in 1895. The city was incorporated in 1891 and was the first incorporated city in Teller County.
Geography
Woodland Park is located in the foothills of the Rocky Mountains, just west of Colorado Springs. The city is situated at an elevation of 8,465 feet (2,584 m). The city is surrounded by Pike National Forest and is located at the base of Pikes Peak.
Climate
Woodland Park has a humid continental climate, with cold, snowy winters and warm, dry summers. The average annual temperature is 43.3°F (6.3°C). The average annual precipitation is 19.3 inches (490 mm).
Economy
Woodland Park's economy is largely based on tourism. The city is home to several tourist attractions, including the Royal Gorge Bridge and Park, the Colorado Wolf and Wildlife Center, and the Rocky Mountain Dinosaur Resource Center. The city is also home to several retail stores, restaurants, and hotels.
Demographics
As of the 2010 census, the city had a population of 6,515. The racial makeup of the city was 94.2% White, 0.7% African American, 0.7% Native American, 0.7% Asian, 0.1% Pacific Islander, 1.7% from other races, and 2.0% from two or more races. Hispanic or Latino of any race were 5.3% of the population.
The median income for a household in the city was $50,945, and the median income for a family was $58,958. The per capita income for the city was $25,945. About 6.2% of families and 8.2% of the population were below the poverty line, including 10.2% of those under age 18 and 6.2% of those age 65 or over.
Common Questions
What is the Total Population of Woodland Park?
Total Population of Woodland Park is 7,911.
What is the Total Male Population of Woodland Park?
Total Male Population of Woodland Park is 4,094.
What is the Total Female Population of Woodland Park?
Total Female Population of Woodland Park is 3,817.
What is the Ratio of Males per 100 Females in Woodland Park?
There are 107.26 Males per 100 Females in Woodland Park.
What is the Ratio of Females per 100 Males in Woodland Park?
There are 93.23 Females per 100 Males in Woodland Park.
What is the Median Population Age in Woodland Park?
Median Population Age in Woodland Park is 43.1 Years.
What is the Average Family Size in Woodland Park
Average Family Size in Woodland Park is 3.0 People.
What is the Average Household Size in Woodland Park
Average Household Size in Woodland Park is 2.4 People.
What is Per Capita Income in Woodland Park?
Per Capita income in Woodland Park is $43,146.
What is the Median Family Income in Woodland Park?
Median Family Income in Woodland Park is $98,813.
What is the Median Household income in Woodland Park?
Median Household Income in Woodland Park is $89,341.
What is Income or Wage Gap in Woodland Park?
Income or Wage Gap in Woodland Park is 55.2%.
Women in Woodland Park earn 44.8 cents for every dollar earned by a man.
What is Inequality or Gini Index in Woodland Park?
Inequality or Gini Index in Woodland Park is 0.39.
How Large is the Labor Force in Woodland Park?
There are 3,946 People in the Labor Forcein in Woodland Park.
What is the Percentage of People in the Labor Force in Woodland Park?
59.6% of People are in the Labor Force in Woodland Park.
What is the Unemployment Rate in Woodland Park?
Unemployment Rate in Woodland Park is 3.8%.