Zip Codes with the Highest Percentage of Hispanic or Latino Population in Pueblo, CO
RELATED REPORTS & OPTIONS
Hispanic or Latino
Pueblo
Compare Zip Codes
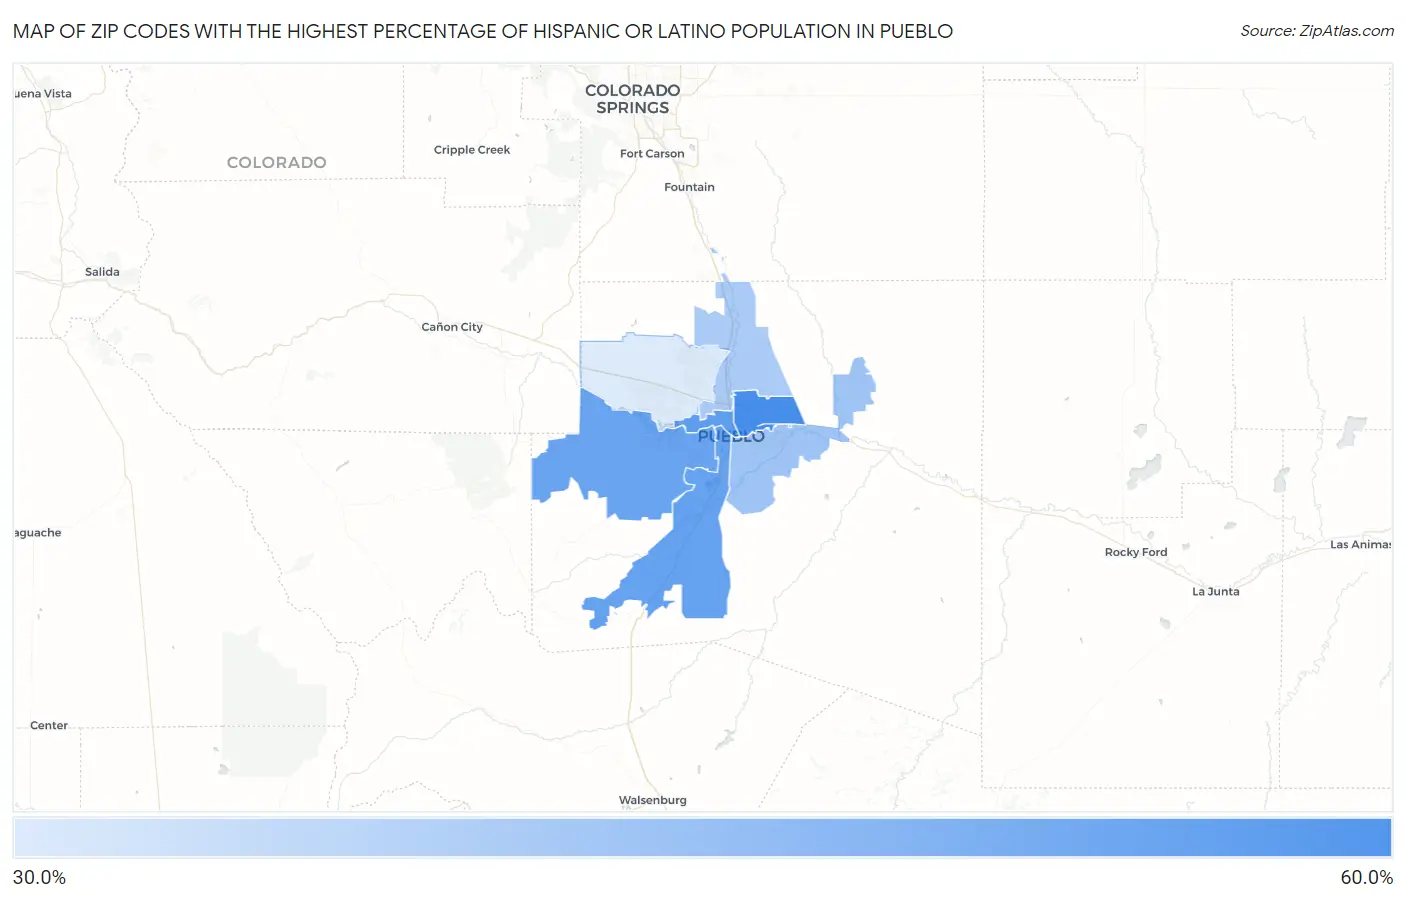
Map of Zip Codes with the Highest Percentage of Hispanic or Latino Population in Pueblo
31.8%
53.4%
Zip Codes with the Highest Percentage of Hispanic or Latino Population in Pueblo, CO
| Zip Code | Hispanic or Latino | vs State | vs National | |
| 1. | 81001 | 53.4% | 22.1%(+31.4)#24 | 18.7%(+34.8)#1,379 |
| 2. | 81003 | 49.5% | 22.1%(+27.4)#32 | 18.7%(+30.8)#1,568 |
| 3. | 81004 | 48.7% | 22.1%(+26.7)#35 | 18.7%(+30.1)#1,599 |
| 4. | 81005 | 48.1% | 22.1%(+26.1)#38 | 18.7%(+29.5)#1,634 |
| 5. | 81006 | 40.3% | 22.1%(+18.3)#59 | 18.7%(+21.7)#2,134 |
| 6. | 81008 | 38.7% | 22.1%(+16.6)#67 | 18.7%(+20.1)#2,258 |
| 7. | 81007 | 31.8% | 22.1%(+9.71)#89 | 18.7%(+13.1)#2,905 |
1
Common Questions
What are the Top 5 Zip Codes with the Highest Percentage of Hispanic or Latino Population in Pueblo, CO?
Top 5 Zip Codes with the Highest Percentage of Hispanic or Latino Population in Pueblo, CO are:
What zip code has the Highest Percentage of Hispanic or Latino Population in Pueblo, CO?
81001 has the Highest Percentage of Hispanic or Latino Population in Pueblo, CO with 53.4%.
What is the Percentage of Hispanic or Latino Population in Pueblo, CO?
Percentage of Hispanic or Latino Population in Pueblo is 50.0%.
What is the Percentage of Hispanic or Latino Population in Colorado?
Percentage of Hispanic or Latino Population in Colorado is 22.1%.
What is the Percentage of Hispanic or Latino Population in the United States?
Percentage of Hispanic or Latino Population in the United States is 18.7%.