Zip Codes with the Highest Percentage of Population Employed in Agriculture, Fishing & Hunting in Loveland, CO
RELATED REPORTS & OPTIONS
Agriculture, Fishing & Hunting
Loveland
Compare Zip Codes
Map of Zip Codes with the Highest Percentage of Population Employed in Agriculture, Fishing & Hunting in Loveland
0.0%
0.80%
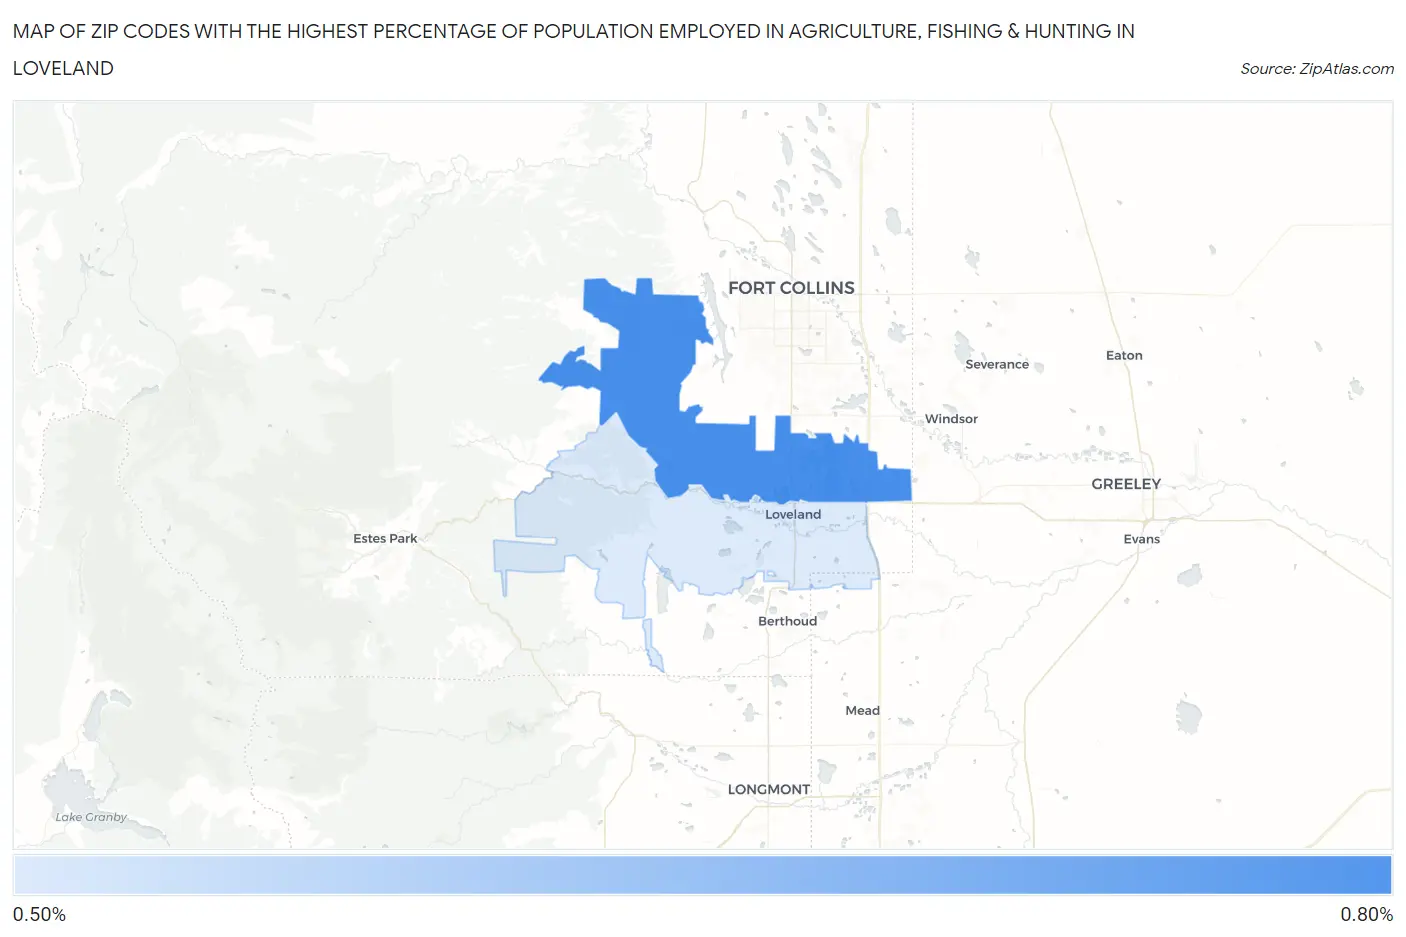
Zip Codes with the Highest Percentage of Population Employed in Agriculture, Fishing & Hunting in Loveland, CO
| Zip Code | % Employed | vs State | vs National | |
| 1. | 80538 | 0.78% | 1.1%(-0.365)#300 | 1.2%(-0.417)#17,352 |
| 2. | 80537 | 0.60% | 1.1%(-0.552)#319 | 1.2%(-0.604)#18,514 |
1
Common Questions
What are the Top Zip Codes with the Highest Percentage of Population Employed in Agriculture, Fishing & Hunting in Loveland, CO?
Top Zip Codes with the Highest Percentage of Population Employed in Agriculture, Fishing & Hunting in Loveland, CO are:
What zip code has the Highest Percentage of Population Employed in Agriculture, Fishing & Hunting in Loveland, CO?
80538 has the Highest Percentage of Population Employed in Agriculture, Fishing & Hunting in Loveland, CO with 0.78%.
What is the Percentage of Population Employed in Agriculture, Fishing & Hunting in Loveland, CO?
Percentage of Population Employed in Agriculture, Fishing & Hunting in Loveland is 0.55%.
What is the Percentage of Population Employed in Agriculture, Fishing & Hunting in Colorado?
Percentage of Population Employed in Agriculture, Fishing & Hunting in Colorado is 1.1%.
What is the Percentage of Population Employed in Agriculture, Fishing & Hunting in the United States?
Percentage of Population Employed in Agriculture, Fishing & Hunting in the United States is 1.2%.