Zip Codes with the Highest Percentage of Hispanic or Latino Population in Littleton, CO
RELATED REPORTS & OPTIONS
Hispanic or Latino
Littleton
Compare Zip Codes
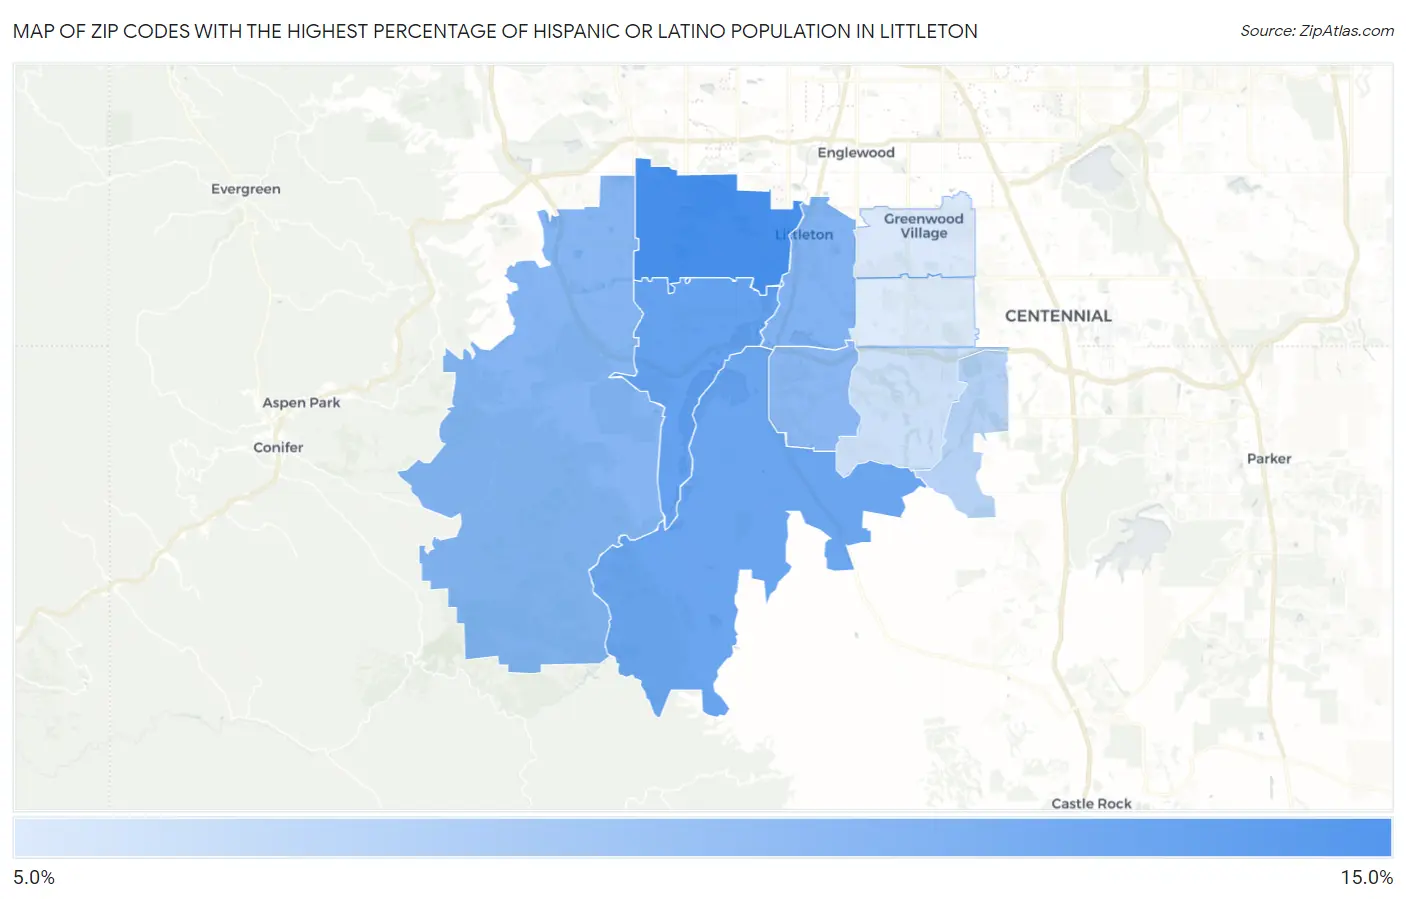
Map of Zip Codes with the Highest Percentage of Hispanic or Latino Population in Littleton
7.7%
13.3%
Zip Codes with the Highest Percentage of Hispanic or Latino Population in Littleton, CO
| Zip Code | Hispanic or Latino | vs State | vs National | |
| 1. | 80123 | 13.3% | 22.1%(-8.76)#253 | 18.7%(-5.34)#7,095 |
| 2. | 80128 | 12.1% | 22.1%(-9.95)#278 | 18.7%(-6.53)#7,688 |
| 3. | 80125 | 11.9% | 22.1%(-10.2)#281 | 18.7%(-6.77)#7,819 |
| 4. | 80120 | 11.1% | 22.1%(-11.0)#296 | 18.7%(-7.55)#8,237 |
| 5. | 80127 | 10.9% | 22.1%(-11.1)#300 | 18.7%(-7.73)#8,343 |
| 6. | 80129 | 10.7% | 22.1%(-11.4)#302 | 18.7%(-7.93)#8,443 |
| 7. | 80130 | 9.1% | 22.1%(-13.0)#331 | 18.7%(-9.58)#9,636 |
| 8. | 80126 | 8.3% | 22.1%(-13.8)#346 | 18.7%(-10.4)#10,347 |
| 9. | 80121 | 7.7% | 22.1%(-14.3)#359 | 18.7%(-10.9)#10,821 |
| 10. | 80122 | 7.7% | 22.1%(-14.4)#361 | 18.7%(-11.0)#10,897 |
1
Common Questions
What are the Top 5 Zip Codes with the Highest Percentage of Hispanic or Latino Population in Littleton, CO?
Top 5 Zip Codes with the Highest Percentage of Hispanic or Latino Population in Littleton, CO are:
What zip code has the Highest Percentage of Hispanic or Latino Population in Littleton, CO?
80123 has the Highest Percentage of Hispanic or Latino Population in Littleton, CO with 13.3%.
What is the Percentage of Hispanic or Latino Population in Littleton, CO?
Percentage of Hispanic or Latino Population in Littleton is 12.2%.
What is the Percentage of Hispanic or Latino Population in Colorado?
Percentage of Hispanic or Latino Population in Colorado is 22.1%.
What is the Percentage of Hispanic or Latino Population in the United States?
Percentage of Hispanic or Latino Population in the United States is 18.7%.