Zip Codes with the Highest Percentage of Population Employed in Farming, Fishing & Forestry in Littleton, CO
RELATED REPORTS & OPTIONS
Farming, Fishing & Forestry
Littleton
Compare Zip Codes
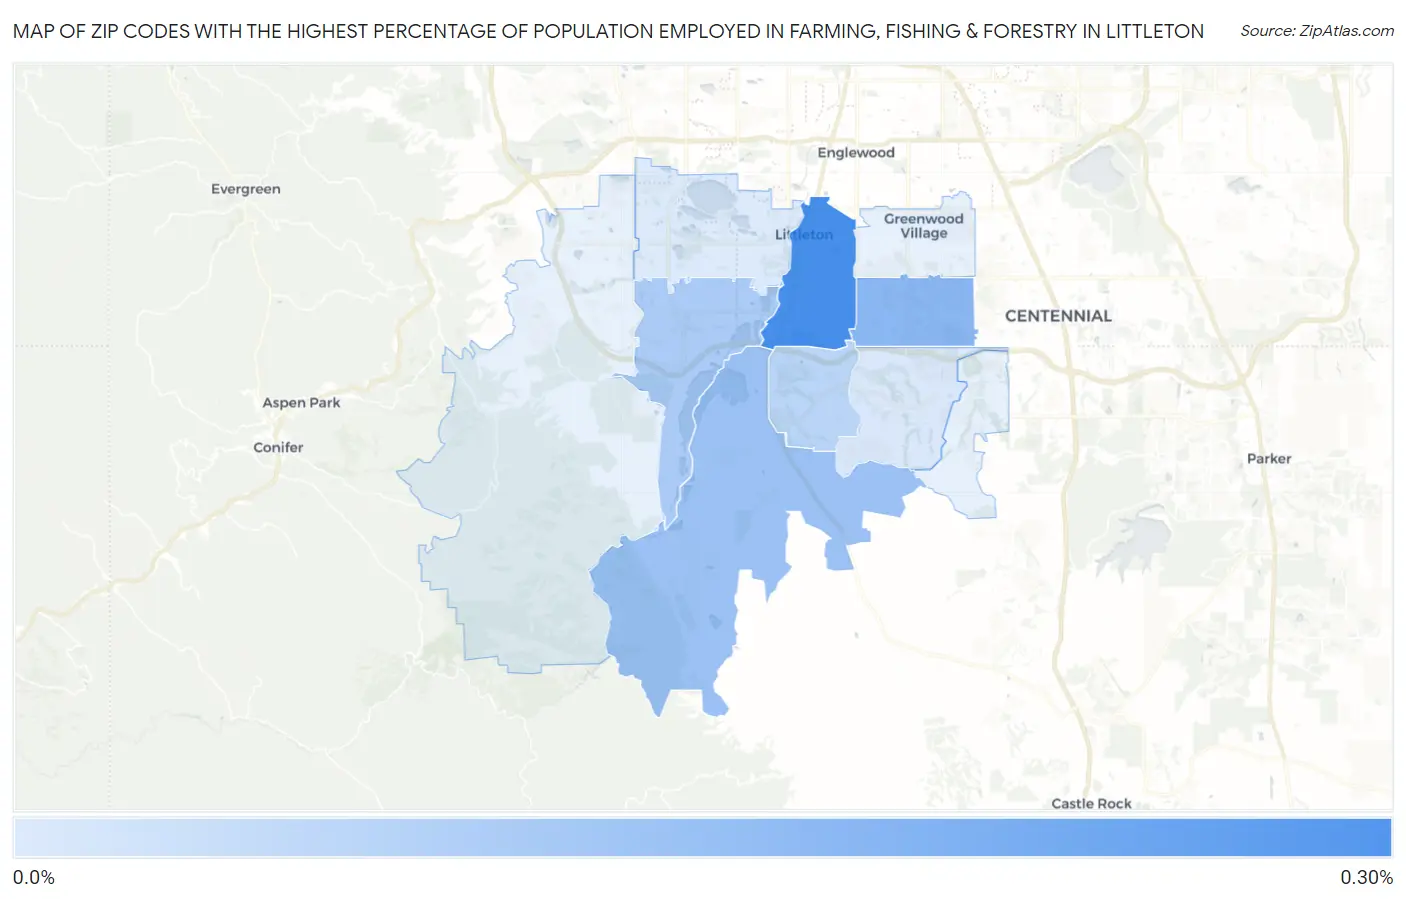
Map of Zip Codes with the Highest Percentage of Population Employed in Farming, Fishing & Forestry in Littleton
0.0%
0.30%
Zip Codes with the Highest Percentage of Population Employed in Farming, Fishing & Forestry in Littleton, CO
| Zip Code | % Employed | vs State | vs National | |
| 1. | 80120 | 0.26% | 0.49%(-0.226)#253 | 0.61%(-0.344)#15,267 |
| 2. | 80122 | 0.16% | 0.49%(-0.331)#284 | 0.61%(-0.449)#16,806 |
| 3. | 80125 | 0.13% | 0.49%(-0.359)#293 | 0.61%(-0.477)#17,298 |
| 4. | 80128 | 0.11% | 0.49%(-0.381)#299 | 0.61%(-0.499)#17,643 |
| 5. | 80129 | 0.081% | 0.49%(-0.406)#303 | 0.61%(-0.525)#18,108 |
| 6. | 80126 | 0.034% | 0.49%(-0.454)#317 | 0.61%(-0.572)#18,910 |
| 7. | 80123 | 0.029% | 0.49%(-0.459)#318 | 0.61%(-0.577)#18,977 |
1
Common Questions
What are the Top 5 Zip Codes with the Highest Percentage of Population Employed in Farming, Fishing & Forestry in Littleton, CO?
Top 5 Zip Codes with the Highest Percentage of Population Employed in Farming, Fishing & Forestry in Littleton, CO are:
What zip code has the Highest Percentage of Population Employed in Farming, Fishing & Forestry in Littleton, CO?
80120 has the Highest Percentage of Population Employed in Farming, Fishing & Forestry in Littleton, CO with 0.26%.
What is the Percentage of Population Employed in Farming, Fishing & Forestry in Littleton, CO?
Percentage of Population Employed in Farming, Fishing & Forestry in Littleton is 0.17%.
What is the Percentage of Population Employed in Farming, Fishing & Forestry in Colorado?
Percentage of Population Employed in Farming, Fishing & Forestry in Colorado is 0.49%.
What is the Percentage of Population Employed in Farming, Fishing & Forestry in the United States?
Percentage of Population Employed in Farming, Fishing & Forestry in the United States is 0.61%.